Targeting Estrogen Receptors: Nanoparticle Drug Delivery Systems for Precision Cancer Therapy
This article provides a comprehensive overview of estrogen receptor (ER)-targeted nanoparticles for cancer drug delivery.
Targeting Estrogen Receptors: Nanoparticle Drug Delivery Systems for Precision Cancer Therapy
Abstract
This article provides a comprehensive overview of estrogen receptor (ER)-targeted nanoparticles for cancer drug delivery. It explores the foundational biology of ERs as therapeutic targets, details current methodologies for nanoparticle design and ligand conjugation, addresses critical challenges in formulation and targeting efficiency, and evaluates validation strategies through comparative analysis with other targeted systems. Aimed at researchers and drug development professionals, the content synthesizes recent advances, practical optimization techniques, and future clinical translation pathways for this promising precision oncology approach.
ER Signaling and Targeting: The Biological Rationale for Nanoparticle Drug Delivery
The Role of Estrogen Receptors (ERα and ERβ) in Cancer Pathogenesis and Progression
Estrogen Receptors (ERα, encoded by ESR1, and ERβ, encoded by ESR2) are ligand-activated transcription factors pivotal in regulating cell proliferation, differentiation, and survival. In the context of cancer, their dysregulation is a hallmark of hormone-responsive malignancies, most notably breast and endometrial cancers. ERα primarily drives oncogenic proliferation, while ERβ often exhibits tumor-suppressive effects, though its role is context-dependent. Understanding the distinct and overlapping functions of these receptors is fundamental for developing targeted therapies, including the advanced design of ER-targeted nanoparticles for precise drug delivery.
Table 1: Comparative Roles of ERα and ERβ in Major Cancers
| Parameter | ERα | ERβ |
|---|---|---|
| Primary Role in Cancer | Oncogenic driver; promotes cell proliferation, survival, and metastasis. | Context-dependent; often tumor-suppressive (anti-proliferative, pro-apoptotic), but can be oncogenic in some contexts (e.g., colon, prostate). |
| Major Cancer Association | ~70% of breast cancers (ER+), endometrial, ovarian. | Colorectal, prostate, triple-negative breast cancer (TNBC), neuroblastoma. |
| Ligand Binding Affinity | High affinity for 17β-estradiol (E2). | Similar high affinity for E2, but distinct ligand preferences for certain phytoestrogens and SERMs. |
| Common Mutations/Variants | ESR1 mutations (Y537S, D538G) common in metastatic, endocrine-resistant breast cancer. | Somatic mutations less frequent; promoter hypermethylation leading to loss of expression is common. |
| 5-Year Survival Correlation (Example: Breast Cancer) | ERα+ status correlates with better survival due to responsiveness to endocrine therapy. | High ERβ expression in ERα+ breast cancer may correlate with improved response to tamoxifen. |
| Targetability | Well-targeted by SERMs (e.g., Tamoxifen), AIs (e.g., Letrozole), SERDs (e.g., Fulvestrant). | Emerging target; selective ERβ agonists (e.g., LY500307) under investigation for therapy. |
Table 2: Key Quantitative Findings from Recent Studies (2023-2024)
| Study Focus | Key Quantitative Finding | Implication for Therapy |
|---|---|---|
| ERα Mutations in mBC | ESR1 mutations detected in ~40% of ER+ metastatic breast cancer patients after prior AI therapy. | Drives resistance; necessitates development of next-gen SERDs and targeted nanoparticle delivery. |
| ERβ in TNBC | ERβ expression identified in ~30% of TNBC cases; high expression linked to 20% reduced risk of recurrence. | Suggests ERβ as a therapeutic target and potential biomarker in a subset of TNBC. |
| ERα/ERβ Ratio | A high ERα:ERβ ratio (>5) in breast tumors correlates with a 2.1-fold increased hazard for progression. | Highlights the prognostic value of measuring both receptors; targeting the ratio could be beneficial. |
| Nanoparticle Targeting Efficiency | Ligand-conjugated nanoparticles showed 3.5-fold higher uptake in ERα+ MCF-7 cells vs. non-targeted NPs. | Validates the strategy of using ER ligands (e.g., E2, SERM analogs) for active targeting in drug delivery. |
Experimental Protocols
Protocol 1: Differential Analysis of ERα and ERβ Signaling via Luciferase Reporter Assay
Purpose: To quantify the transcriptional activity of ERα vs. ERβ in response to ligands in cancer cell lines. Materials:
- ER-positive (e.g., MCF-7) and ER-negative (e.g., MDA-MB-231) control cell lines.
- Expression plasmids for ERα and ERβ.
- Estrogen Response Element (ERE)-luciferase reporter plasmid (e.g., pGL4-ERE).
- Renilla luciferase control plasmid (e.g., pRL-TK) for normalization.
- Ligands: 17β-estradiol (E2, 10 nM), selective agonists/antagonists (e.g., PPT for ERα, DPN for ERβ, Fulvestrant).
- Dual-Luciferase Reporter Assay System.
- Luminometer.
Procedure:
- Day 1: Seeding. Seed cells in 24-well plates at 60-70% confluence in phenol-red-free medium supplemented with charcoal-stripped serum.
- Day 2: Transfection. Transfect cells using a suitable reagent (e.g., Lipofectamine 3000) with a mix containing: 0.4 µg ERE-luciferase plasmid, 0.1 µg ERα or ERβ expression plasmid (or empty vector control), and 0.01 µg pRL-TK per well.
- Day 3: Ligand Treatment. 6 hours post-transfection, treat cells with vehicle control or specified ligands in fresh medium. Use at least triplicate wells per condition.
- Day 4: Lysis and Assay. 24h post-treatment, lyse cells and measure Firefly and Renilla luciferase activity using the Dual-Luciferase Assay kit on a luminometer.
- Analysis: Normalize Firefly luciferase activity to Renilla activity for each well. Calculate fold induction relative to vehicle-treated control.
Protocol 2: Evaluating ER-Targeted Nanoparticle Uptake and Efficacy
Purpose: To assess the specificity and cytotoxicity of drug-loaded nanoparticles functionalized with an ER-targeting ligand (e.g., estradiol or a SERM derivative). Materials:
- Nanoparticles (NPs): Poly(lactic-co-glycolic acid) (PLGA) NPs loaded with a model drug (e.g., Doxorubicin) and fluorescent dye (e.g., Cy5.5).
- Targeting Ligand: Estradiol-PEG conjugate or Tamoxifen-PEG conjugate for surface conjugation.
- Cells: ERα+ (MCF-7), ERβ+ (e.g., transfected cell line), and ER- (MDA-MB-231) cells.
- Flow Cytometer & Confocal Microscope.
- Cell Viability Kit (e.g., MTT or CellTiter-Glo).
Procedure:
- NP Preparation & Characterization: Prepare targeted (ER-ligand-conjugated) and non-targeted (PEG-only) NPs via nanoprecipitation. Characterize size (DLS), zeta potential, drug loading (HPLC), and ligand conjugation efficiency (NMR/spectroscopy).
- Cellular Uptake (Flow Cytometry):
- Seed cells in 12-well plates.
- Treat with Cy5.5-labeled targeted or non-targeted NPs (equivalent dye concentration) for 2-4 hours.
- Wash, trypsinize, and resuspend in PBS. Analyze Cy5.5 fluorescence intensity per cell via flow cytometry. Use excess free ligand as a competitive inhibition control.
- Cellular Uptake (Confocal Microscopy):
- Seed cells on glass-bottom dishes.
- Treat with NPs as above for 2 hours. Stain nuclei (DAPI) and actin (Phalloidin-FITC).
- Image using a confocal microscope to visualize intracellular NP localization.
- Cytotoxicity Assay (MTT):
- Seed cells in 96-well plates.
- Treat with increasing concentrations of drug-loaded targeted/non-targeted NPs or free drug for 72 hours.
- Add MTT reagent, incubate, solubilize formazan crystals, and measure absorbance at 570 nm.
- Calculate IC50 values and compare targeting efficacy.
Signaling Pathways & Workflow Visualizations
Diagram 1: Canonical Genomic Signaling of ERα and ERβ.
Diagram 2: Workflow for Evaluating ER-Targeted Nanoparticles.
The Scientist's Toolkit: Key Research Reagent Solutions
Table 3: Essential Reagents for ER and ER-Targeted Nanoparticle Research
| Reagent / Material | Supplier Examples | Function in Research |
|---|---|---|
| Charcoal-Stripped Fetal Bovine Serum | Gibco, Sigma-Aldrich | Removes endogenous steroids for controlled in vitro studies of ER signaling. |
| Selective ER Ligands: PPT (ERα agonist), DPN (ERβ agonist), Fulvestrant (SERD) | Tocris, Sigma-Aldrich | Pharmacological tools to dissect functions of ER isoforms and model resistance. |
| ESR1 & ESR2 siRNA/shRNA Kits | Dharmacon, Santa Cruz Biotech | For genetic knockdown of specific ERs to study loss-of-function phenotypes. |
| ERE-Luciferase Reporter Plasmid | Addgene, Promega | Standardized vector for quantifying ER transcriptional activity in reporter assays. |
| ERα & ERβ Antibodies (Validated for ChIP, IF, WB) | Cell Signaling, Abcam | Detection, localization, and quantification of ER proteins and their post-translational modifications. |
| PLGA (50:50) Resorbable Polymer | Lactel, Sigma-Aldrich | Biocompatible, FDA-approved polymer for constructing drug-loaded nanoparticle cores. |
| Maleimide-PEG-NHS Heterobifunctional Linker | Creative PEGWorks, Iris Biotech | Enables covalent conjugation of ER-targeting ligands (e.g., thiolated E2) to nanoparticle surfaces. |
| Fluorescent Cell Trackers (e.g., Cy5.5 NHS ester) | Lumiprobe, Thermo Fisher | For labeling nanoparticles to track cellular uptake and biodistribution in vitro and in vivo. |
| Pre-formulated ER-Targeted NP Kits (Research Grade) | Nanosoft Polymers, Avanti | Accelerate proof-of-concept studies with standardized, ligand-conjugated blank nanoparticles for loading. |
Current Limitations of Conventional Chemotherapy and Small-Molecule ER Modulators
Application Notes: Key Limitations in Clinical Practice
Conventional chemotherapy and small-molecule Estrogen Receptor (ER) modulators, while foundational in cancer treatment, present significant clinical and pharmacological challenges. These limitations form the critical rationale for developing advanced delivery systems like ER-targeted nanoparticles.
1.1. Systemic Toxicity of Conventional Chemotherapeutics Cytotoxic chemotherapeutic agents lack tumor selectivity, leading to dose-limiting damage to healthy, rapidly dividing tissues. This results in severe adverse effects that compromise patient quality of life and often necessitate dose reduction or treatment cessation.
1.2. Pharmacokinetic and Biodistribution Challenges Small-molecule drugs, including Selective Estrogen Receptor Modulators (SERMs) and degraders (SERDs), exhibit suboptimal pharmacokinetic profiles. Their rapid clearance and widespread distribution reduce therapeutic index and necessitate frequent, high-dose administration.
1.3. Drug Resistance Mechanisms Both chemotherapy and endocrine therapy are hampered by intrinsic and acquired resistance. Key resistance pathways in ER+ breast cancer include ER mutations (e.g., ESR1 Y537S), altered co-regulator expression, and cross-talk with growth factor signaling pathways (e.g., PI3K/AKT/mTOR, HER2).
1.4. Limitations of Current Small-Molecule ER Modulators While SERMs (e.g., tamoxifen) and SERDs (e.g., fulvestrant) are standards of care, they have specific drawbacks. Tamoxifen has partial agonist activity in the endometrium, increasing cancer risk. Fulvestrant has poor oral bioavailability and requires intramuscular injection.
Table 1: Clinical Limitations of Conventional Chemotherapy for Solid Tumors
| Limitation Category | Example Metrics/Data | Clinical Consequence |
|---|---|---|
| Therapeutic Index (Low) | Median TI for doxorubicin: ~2-4 | Severe cardiotoxicity limits cumulative lifetime dose (max 450-550 mg/m²) |
| Tumor Accumulation | Typically <1-2% of injected dose reaches tumor | Inefficient delivery necessitates high systemic doses |
| Major Adverse Effects | Grade 3/4 neutropenia in 30-50% of patients; Severe fatigue in 40-80% | Dose delays, reductions, treatment discontinuation |
| Resistance Incidence | Primary resistance in ~30-50% of metastatic cases; Acquired resistance nearly universal | Treatment failure and disease progression |
Table 2: Limitations of Approved Small-Molecule ER Modulators
| Drug (Class) | Key Pharmacokinetic Limitation | Key Resistance/Toxicity Issue | Administration Challenge |
|---|---|---|---|
| Tamoxifen (SERM) | Extensive hepatic metabolism (CYP2D6/3A4), variable active metabolite (endoxifen) levels | Endometrial hyperplasia/cancer risk (2-7x increase); ESR1 mutations | Daily oral dosing for 5-10 years; adherence issues |
| Fulvestrant (SERD) | Poor oral bioavailability (<1%); slow absorption from IM site (Cmax in 7-9 days) | ESR1 ligand-binding domain mutations (Y537S, D538G); PI3K pathway activation | High-volume (2x 5 mL) intramuscular injection monthly |
| Raloxifene (SERM) | Low absolute bioavailability (~2%) | Limited efficacy in advanced disease | Not used in metastatic setting |
| New Oral SERDs (e.g., Elacestrant) | CYP3A4 metabolism; potential for drug-drug interactions | Emerging resistance mechanisms under study | Requires monitoring with strong CYP3A inducers/inhibitors |
Experimental Protocols for Characterizing Limitations
Protocol 3.1: Evaluating Chemotherapy-Induced Systemic Toxicity In Vivo Objective: To quantify the differential toxicity of a conventional chemotherapeutic (e.g., doxorubicin) on tumor versus healthy organs in a murine xenograft model.
- Animal Model Establishment: Inoculate 1x10^6 MCF-7 ER+ breast cancer cells subcutaneously into the flank of female athymic nude mice. Allow tumors to reach ~100 mm³.
- Treatment Groups: Randomize mice (n=8/group) into: (a) Vehicle control, (b) Free doxorubicin (5 mg/kg, IV bolus, weekly), (c) Nanoparticle-encapsulated doxorubicin (equivalent dose, weekly).
- Toxicity Monitoring:
- Weight & Clinical Signs: Record weight and monitor for morbidity (lethargy, ruffled fur) daily.
- Hematological Toxicity: Collect 50 µL blood via submandibular bleed on days 0, 4, 7, and 11. Analyze complete blood count (CBC) using an automated hematology analyzer. Focus on absolute neutrophil count (ANC).
- Cardiotoxicity Biomarkers: At endpoint (day 28), collect serum. Measure cardiac troponin I (cTnI) and brain natriuretic peptide (BNP) via ELISA.
- Histopathological Analysis: Euthanize animals. Harvest heart, liver, kidney, and tumor. Fix in 10% neutral buffered formalin, paraffin-embed, section (5 µm), and stain with H&E. Score tissue damage (e.g., myocardial vacuolization, hepatocyte degeneration) on a semi-quantitative scale (0-4).
- Data Analysis: Compare mean body weight change, ANC nadir, biomarker levels, and histopathology scores between free drug and nanoparticle groups using a two-tailed Student's t-test (p<0.05 significant).
Protocol 3.2: Profiling Resistance to SERDs in ER+ Cell Lines Objective: To establish and characterize acquired resistance to fulvestrant in ER+ breast cancer cells and identify associated signaling pathways.
- Development of Resistant Cell Line:
- Culture MCF-7 or T47D cells in phenol-red free RPMI-1640 with 5% charcoal-stripped FBS.
- Expose cells to increasing concentrations of fulvestrant (starting at 1 nM) over 6-9 months. Maintain cells at a lethal concentration for >90% of cells for 2-3 passages before incrementally increasing dose.
- Maintain a parental control line in parallel without drug pressure.
- Characterization of Resistant Phenotype:
- IC50 Determination: Seed cells in 96-well plates (5,000/well). Treat with a fulvestrant dilution series (0.1 nM - 10 µM) for 72 hours. Assess viability via MTT assay. Calculate IC50 using non-linear regression (log(inhibitor) vs. response).
- ER Expression & Localization: Perform Western blot for total ERα and immunofluorescence for ERα (clone SP1) to assess nuclear/cytoplasmic distribution.
- ESR1 Mutation Detection: Isolate genomic DNA and RNA. Perform Sanger sequencing or digital droplet PCR of the ESR1 ligand-binding domain (exon 8) to identify hotspot mutations (Y537S, D538G).
- Analysis of Bypass Signaling Pathways:
- Perform phospho-kinase array on lysates from resistant vs. parental cells under fulvestrant treatment.
- Validate up-regulated pathways (e.g., p-AKT, p-ERK, p-STAT3) by Western blot.
- Data Interpretation: A >10-fold increase in IC50, loss of ER nuclear localization, presence of ESR1 mutations, and sustained phosphorylated bypass pathways confirm a resistant model.
Diagrams
Title: Rationale for ER-Targeted Nanoparticle Development
Title: ER Therapy Resistance Mechanisms
The Scientist's Toolkit: Research Reagent Solutions
Table 3: Essential Reagents for Studying ER Therapy Limitations
| Reagent / Material | Vendor Examples (Catalog #) | Function in Research |
|---|---|---|
| Charcoal-Stripped Fetal Bovine Serum (cs-FBS) | Gibco (12676029), Sigma-Aldrich (F6765) | Depletes steroid hormones from culture media for in vitro ER signaling studies. |
| Fulvestrant (ICI 182,780) | Tocris (1047), Sigma-Aldrich (I4409) | A pure SERD used to induce ER degradation; key reagent for developing resistant cell lines and studying SERD mechanisms. |
| 4-Hydroxytamoxifen (4-OHT) | Sigma-Aldrich (H7904), Cayman Chemical (13350) | The active metabolite of tamoxifen; used in vitro to study SERM activity without metabolic conversion. |
| Phospho-Kinase Array Kit | R&D Systems (ARY003B) | Multiplex immunoblotting to profile activation states of 45+ kinases, critical for identifying bypass resistance pathways. |
| ESR1 (Y537S, D538G) Mutation ddPCR Assay | Bio-Rad (dHsaMDV2010585, dHsaMDV2010586) | Ultrasensitive detection and quantification of low-frequency ESR1 mutations in cell lines or patient-derived samples. |
| ERα Antibody (Clone SP1) | Abcam (ab16660), Thermo Fisher Scientific (MA5-14501) | A standard antibody for Immunohistochemistry (IHC) and Immunofluorescence (IF) to assess ER expression and subcellular localization. |
| Matrigel Basement Membrane Matrix | Corning (354234) | Used for establishing orthotopic or patient-derived xenograft (PDX) tumor models with more realistic microenvironment for drug testing. |
| CYP2D6 & CYP3A4 Metabolizing Enzymes | Corning (456203, 456202) | Recombinant enzymes for in vitro studies of tamoxifen metabolism to active metabolites (endoxifen). |
Application Notes: Quantifying the EPR Effect and Active Targeting
The Enhanced Permeability and Retention (EPR) effect remains a cornerstone of passive nanoparticle (NP) tumor targeting. Recent data, however, highlights significant heterogeneity in its manifestation across tumor types and individuals. Concurrently, active targeting strategies, particularly those involving Endoplasmic Reticulum (ER) stress induction, are being developed to improve specificity and therapeutic efficacy. The following tables synthesize current quantitative findings.
Table 1: Comparative Analysis of Nanoparticle Performance In Vivo
| Parameter | Conventional Liposome (Passive) | PEGylated NP (Passive) | Ligand-Targeted NP (Active) | ER-Targeted NP (Active) | Measurement Method |
|---|---|---|---|---|---|
| Avg. Tumor Accumulation (%ID/g) | 3.2 ± 0.8 | 5.7 ± 1.2 | 8.5 ± 2.1 | 12.4 ± 3.0 | Radiolabeling (¹¹¹In), ICP-MS |
| Plasma Half-life (t½, h) | ~2-4 | 12-24 | 8-16 | 10-18 | Pharmacokinetic (PK) analysis |
| Tumor Penetration Depth (µm) | 30-50 | 40-60 | 60-90 | 70-100 | Fluorescence Microscopy |
| Cellular Uptake (Fold Increase vs. Passive) | 1 (ref) | 1.5 | 3-5 | 6-10 | Flow Cytometry |
| Off-Target Accumulation (Liver, %ID/g) | 25-35 | 15-25 | 18-30 | 20-28 | Ex Vivo Biodistribution |
%ID/g = Percent of Injected Dose per gram of tissue; ICP-MS = Inductively Coupled Plasma Mass Spectrometry.
Table 2: Key Physicochemical Properties Influencing EPR & Targeting
| Property | Optimal Range for EPR | Optimal Range for ER Targeting | Impact on Performance |
|---|---|---|---|
| Hydrodynamic Size (nm) | 20-200 (ideal: 80-150) | 70-120 | Size governs vascular extravasation and interstitial diffusion. |
| Surface Charge (Zeta Potential, mV) | Slightly negative to neutral (-10 to +10) | Slightly positive (+5 to +15) | Charge affects circulation time, opsonization, and membrane interaction. |
| Ligand Density (molecules/nm²) | N/A (PEG only) | 2-5 (e.g., TPP, ER-targeting peptide) | High density can cause steric hindrance; optimal density maximizes receptor-mediated uptake. |
| PEGylation Density (mol%) | 5-10% | 3-7% (cloaking ligand) | Shields NP, reduces clearance. Lower density may be needed for ligand exposure. |
Experimental Protocols
Protocol 2.1: Synthesis and Characterization of ER-Targeted Polymeric Nanoparticles
Objective: To fabricate and characterize triphenylphosphonium (TPP)-conjugated, drug-loaded PLGA-PEG nanoparticles for mitochondrial/ER-associated targeting.
Materials: PLGA-PEG-COOH copolymer, Triphenylphosphonium (TPP)-NH₂, EDC, NHS, Doxorubicin (Dox), Dichloromethane (DCM), Polyvinyl Alcohol (PVA), Dialysis tubing (MWCO 10kDa), Sonicator, Zetasizer.
Procedure:
- Conjugation: Activate PLGA-PEG-COOH (50 mg) with EDC/NHS (molar ratio 1:2:1.5) in MES buffer (pH 6.0) for 15 min. Add TPP-NH₂ (1.5x molar excess to COOH). React for 12h at RT with stirring. Purify by dialysis against DI water (48h) and lyophilize.
- Nanoprecipitation: Dissolve 10 mg of TPP-PLGA-PEG and 2 mg of Dox in 2 mL acetone. Inject rapidly into 8 mL of 2% w/v PVA solution under probe sonication (50 W, 1 min).
- Purification: Stir overnight to evaporate acetone. Centrifuge suspension at 21,000 x g for 30 min. Wash pellet 3x with DI water. Resuspend in PBS and filter (0.22 µm).
- Characterization:
- Size & Zeta: Dilute NP suspension 1:50 in 1 mM KCl. Measure hydrodynamic diameter (DLS) and zeta potential using Zetasizer.
- Drug Loading: Lyophilize known NP volume. Dissolve in DMSO. Measure Dox absorbance at 480 nm. Calculate Loading Capacity (LC%) and Encapsulation Efficiency (EE%).
- In Vitro Release: Place 1 mL of NP suspension in a dialysis bag (MWCO 10kDa). Immerse in 30 mL PBS (pH 7.4) with 0.1% Tween at 37°C with gentle shaking. Sample release medium at intervals and measure Dox fluorescence (Ex/Em: 480/590 nm).
Protocol 2.2: Evaluating Cellular Uptake and ER Stress Induction
Objective: To quantify cellular internalization of targeted NPs and assess downstream ER stress pathway activation.
Materials: MCF-7 or HeLa cells, Fluorescently-labeled NPs (e.g., Cy5), Brefeldin A, ER-Tracker Green, Antibodies: Anti-GRP78/BiP, Anti-CHOP, Anti-β-Actin, Flow cytometer, Confocal microscope, Western blot apparatus.
Procedure:
- Cellular Uptake (Flow Cytometry):
- Seed cells in 12-well plates (2x10⁵ cells/well). Grow overnight.
- Treat with Cy5-labeled Non-targeted or TPP-NPs (equivalent Cy5 dose) for 1, 2, and 4h.
- Wash cells 3x with cold PBS, trypsinize, and resuspend in PBS containing 2% FBS.
- Analyze using flow cytometry (Cy5 channel). Use untreated cells as negative control. Report geometric mean fluorescence intensity (MFI).
- Subcellular Localization (Confocal Microscopy):
- Seed cells on glass-bottom dishes. Incubate with ER-Tracker Green (500 nM) for 30 min.
- Replace medium with Cy5-labeled TPP-NPs (50 µg/mL) for 2h.
- Wash, fix with 4% PFA, and mount. Acquire z-stack images using a confocal microscope. Analyze colocalization using Pearson's coefficient.
- ER Stress Marker Analysis (Western Blot):
- Treat cells with NPs (Dox-loaded or empty) for 24h. Include positive control (Brefeldin A, 5 µM, 12h).
- Lyse cells in RIPA buffer with protease inhibitors.
- Resolve 30 µg protein on 10% SDS-PAGE, transfer to PVDF membrane.
- Block and incubate with primary antibodies (GRP78, CHOP, β-Actin) overnight at 4°C.
- Incubate with HRP-conjugated secondary antibody. Develop using ECL. Densitometry to quantify fold-change vs. untreated control.
Visualization Diagrams
Title: ER-Targeted NP Intracellular Pathway and Apoptosis Induction
Title: Key Experimental Workflow for ER-Targeted NP Development
The Scientist's Toolkit: Research Reagent Solutions
| Reagent / Material | Function / Purpose in Research | Example Vendor / Cat. No. (Illustrative) |
|---|---|---|
| PLGA-PEG-COOH Copolymer | Base biodegradable polymer for NP formulation; PEG provides stealth, COOH enables ligand conjugation. | PolySciTech (AP041), Sigma-Aldrich |
| Triphenylphosphonium (TPP) Conjugates | Mitochondria/ER-targeting cationic ligand; drives accumulation in organelles due to membrane potential. | Sigma-Aldrich (TPhP), Custom synthesis from peptide vendors. |
| ER-Tracker Dyes (Green/Red) | Live-cell staining of the endoplasmic reticulum for colocalization studies via fluorescence microscopy. | Thermo Fisher Scientific (E34251, E34250) |
| GRP78/BiP & CHOP Antibodies | Key markers for detecting Unfolded Protein Response (UPR) and ER stress via Western blot or IF. | Cell Signaling Technology (3177, 5554) |
| Dynamic Light Scattering (DLS) / Zetasizer | Instrument for measuring nanoparticle hydrodynamic size, polydispersity index (PDI), and zeta potential. | Malvern Panalytical (Zetasizer Nano series) |
| Dialysis Tubing (MWCO 3.5-14 kDa) | For purifying nanoparticles and conjugates from unreacted small molecules, solvents, and free drug. | Spectrum Labs (Spectra/Por) |
| Inductively Coupled Plasma Mass Spectrometry (ICP-MS) | Highly sensitive quantification of metal-containing NPs (e.g., gold, iron oxide) in biodistribution studies. | PerkinElmer, Thermo Fisher (iCAP series) |
| IVIS Spectrum Imaging System | Non-invasive, in vivo optical imaging for tracking fluorescently-labeled NPs in small animal models. | Revvity (formerly PerkinElmer) |
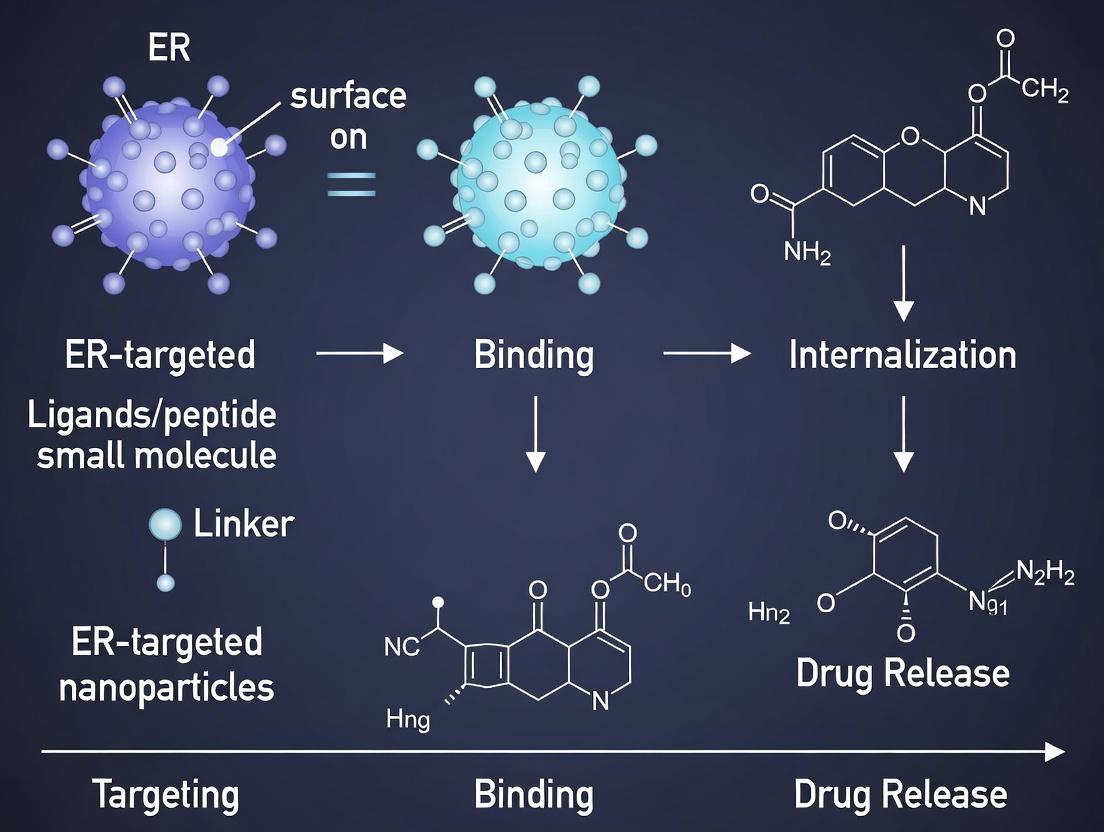
The Estrogen Receptor (ER), a nuclear hormone receptor, is a critical therapeutic target, particularly in ER-positive (ER+) breast and gynecological cancers. Targeted delivery of chemotherapeutic agents, siRNA, or contrast agents via nanoparticles (NPs) conjugated to ER-binding ligands minimizes systemic toxicity and enhances tumor accumulation. The choice of targeting ligand—antibody, peptide, or small molecule—fundamentally dictates the nanoparticle's pharmacokinetics, cellular internalization mechanism, and therapeutic efficacy.
Key Considerations for Ligand Selection:
- Binding Affinity & Specificity: Monoclonal antibodies (mAbs) offer the highest specificity, while small molecules often have superior tissue penetration.
- Ligand Density & Orientation: Critical for maintaining binding avidity and receptor engagement post-conjugation.
- Endocytic Fate: Ligands influence the intracellular trafficking pathway (e.g., clathrin-mediated vs. caveolae-mediated endocytosis), affecting payload release.
- Immunogenicity: Peptides and small molecules are typically less immunogenic than antibodies.
The following sections detail current ligands, their applications, and quantitative comparisons.
Quantitative Comparison of ER-Targeting Ligands
Table 1: Comparative Profile of Key ER-Targeting Ligands for Nanoparticle Conjugation
| Ligand Class | Specific Example | Target ER Subtype | Reported KD/IC50 | Key Advantage for NP Delivery | Primary Limitation |
|---|---|---|---|---|---|
| Antibody | Fulvestrant (as mAb) | ERα | ~0.1 nM (functional) | Extreme specificity; blocks dimerization & degradation. | Large size (~150 kDa) limits NP loading & tumor penetration. |
| Antibody | H222 (Anti-ERα mAb) | ERα | 0.2-0.5 nM | Well-characterized for imaging; induces internalization. | Potential immunogenicity; batch-to-batch variability. |
| Peptide | LHTLLQEL (Phage-derived) | ERα | ~120 nM (Cell assay) | Small size (~1 kDa); easy chemical conjugation; modifiable. | Moderate monovalent affinity; prone to enzymatic degradation. |
| Peptide | ERα-17p (Y1 peptide) | ERα | ~50 nM (SPR) | Binds AF-2 region; disrupts coactivator recruitment. | Requires multivalency for effective NP targeting. |
| Small Molecule | 17β-Estradiol (E2) | ERα/ERβ | ~0.1 nM | Natural ligand; very high affinity; promotes nuclear translocation. | Potent estrogenic activity; safety concerns for therapy. |
| Small Molecule | 4-Hydroxytamoxifen (4-OHT) | ERα | ~1-3 nM (antagonist) | Clinically relevant antagonist; high affinity. | Metabolically labile; partial agonist context. |
| Small Molecule | GDC-0927 (SERD) | ERα | ~0.7 nM (cell-free) | Pure antagonist/degrader; clinical-stage molecule. | Synthetic complexity may complicate conjugation chemistry. |
Table 2: Nanoparticle Formulations Featuring ER Ligands (Recent Examples)
| NP Core | Ligand Conjugated | Payload | Key In Vivo Result (ER+ Model) | Reference (Year) |
|---|---|---|---|---|
| PLGA-PEG | E2 analog | Doxorubicin | 3.2-fold higher tumor accumulation vs. non-targeted NP. | J. Control. Release (2022) |
| Lipid NP | H222 mAb (surface) | siRNA (anti-PLK1) | 70% tumor growth inhibition; enhanced cellular uptake. | Biomaterials (2023) |
| Gold Nanorod | ERα-17p peptide | None (Photothermal) | Selective tumor ablation with laser; reduced off-target heating. | Nanomedicine (2023) |
| Mesoporous Silica | 4-OHT analog | Gemcitabine | Synergistic cytotoxicity; significant apoptosis induction. | ACS Appl. Mater. Interfaces (2024) |
| Polymeric Micelle | LHTLLQEL peptide | Curcumin & Docetaxel | Dual-drug co-delivery; superior anti-metastatic effect. | Eur. J. Pharm. Biopharm. (2023) |
Detailed Experimental Protocols
Protocol 1: Conjugation of ER-Targeting Peptide (LHTLLQEL) to PLGA-b-PEG-COOH Nanoparticles via EDC/NHS Chemistry
Objective: To covalently attach an ERα-binding peptide to pre-formed drug-loaded nanoparticles for active targeting.
Research Reagent Solutions Toolkit:
| Item | Function/Description |
|---|---|
| PLGA-b-PEG-COOH NPs | Pre-formed nanoparticles with surface-exposed carboxylic acid groups for ligand conjugation. |
| LHTLLQEL peptide (N-term NH2, C-term COOH) | The ERα-targeting ligand sequence. |
| EDC Hydrochloride (1-Ethyl-3-(3-dimethylaminopropyl)carbodiimide) | Carboxyl-activating agent for amide bond formation. |
| NHS (N-Hydroxysuccinimide) | Stabilizes the amine-reactive O-acylisourea intermediate, increasing conjugation efficiency. |
| MES Buffer (0.1M, pH 6.0) | Optimal pH buffer for EDC/NHS activation chemistry. |
| Amicon Ultra Centrifugal Filters (MWCO 100kDa) | For buffer exchange and removal of unreacted small molecules/peptides. |
| Dialysis Tubing (MWCO 10kDa) | Alternative purification method. |
| BCA Protein Assay Kit | To quantify surface peptide density indirectly. |
Procedure:
- Activation of NP Surface: Resuspend 10 mg of purified, drug-loaded PLGA-b-PEG-COOH NPs in 5 mL of cold 0.1 M MES buffer (pH 6.0). Add EDC (molar excess 10:1 to estimated surface -COOH) and NHS (molar excess 25:1) under gentle stirring. React for 15 minutes at room temperature (RT).
- Purification of Activated NPs: Immediately transfer the reaction mixture to an Amicon Ultra-15 filter (100 kDa MWCO). Centrifuge at 4000 x g for 10 minutes. Wash three times with 10 mL of cold MES buffer to completely remove excess EDC/NHS. Do not let the NPs dry.
- Peptide Conjugation: Recover the activated NPs in 4 mL of MES buffer. Rapidly add the LHTLLQEL peptide (1000-fold molar excess to initial -COOH groups) in 1 mL of MES buffer. Allow the reaction to proceed for 2-4 hours at RT with gentle stirring or rotation.
- Purification & Characterization: Purify the conjugated NPs via centrifugal filtration (as in Step 2) using PBS (pH 7.4) as the wash buffer. Perform three washes. Characterize the final product for size (DLS), zeta potential, and peptide coupling efficiency (e.g., via BCA assay of unconjugated peptide in filtrate or using a fluorescently labeled peptide analog).
Protocol 2: In Vitro Evaluation of Targeted NP Uptake in ER+ MCF-7 Cells
Objective: To quantify and visualize the cellular internalization of ER-targeted vs. non-targeted nanoparticles.
Procedure:
- Cell Seeding: Seed MCF-7 cells in 24-well plates (for flow cytometry) or on glass coverslips in 12-well plates (for microscopy) at 5 x 10⁴ cells/well in phenol red-free RPMI 1640 supplemented with 10% charcoal-stripped FBS. Culture for 48 hours to ensure receptor expression.
- NP Treatment: Prepare fluorescently labeled (e.g., DiO, Cy5) versions of targeted (peptide-conjugated) and non-targeted NPs in serum-free medium at a standardized particle number or fluorescent intensity. Pre-treat control wells with a 100-fold excess of free 17β-estradiol (E2) for 1 hour to block ERs.
- Incubation & Washing: Treat cells with NPs (0.1-1 nM equivalent) for 1-4 hours at 37°C. Terminate uptake by placing plates on ice. Wash cells 3x with cold PBS containing 0.1% BSA to remove non-internalized NPs.
- Analysis:
- Flow Cytometry: Detach cells with trypsin, quench with complete medium, pellet, and resuspend in cold PBS containing 1% FBS. Analyze median fluorescence intensity (MFI) of 10,000 cells per sample using a flow cytometer. Calculate fold-increase in uptake for targeted NPs.
- Confocal Microscopy: Fix cells with 4% PFA for 15 min, permeabilize with 0.1% Triton X-100 (optional), and mount with DAPI-containing medium. Image using a 60x/63x oil objective. Co-localization with early endosome marker (EEA1) can be assessed via immunostaining.
Pathways & Workflows: Visualization
Diagram 1: Cellular Trafficking Pathway of ER-Targeted NPs
Diagram 2: Experimental Workflow for Developing ER-Targeted NPs
Estrogen Receptor-alpha (ERα) expression, a hallmark and primary therapeutic target in breast cancer, is increasingly recognized as a critical oncogenic driver in other solid tumors. This application note contextualizes the development of ER-targeted nanoparticle (NP) therapeutics within this broader oncology landscape. Recent clinical data underscores the prevalence of ER positivity across multiple cancer types, as summarized in Table 1.
Table 1: ERα Positivity Rates and Clinical Correlates Across Cancers
| Cancer Type | Approximate ERα+ Prevalence | Common Histological Subtype Association | Prognostic Implication | Key Reference (2022-2024) |
|---|---|---|---|---|
| Breast Cancer | ~70-80% | Luminal A/B | Favorable, but risk of late recurrence | (Standard Baseline) |
| Endometrial Carcinoma | 40-70% | Endometrioid (Type I) | Favorable, but associated with advanced stage in a subset | Ghandehari et al., Gynecol Oncol, 2023 |
| Ovarian Carcinoma | 30-60% | Low-Grade Serous, Endometrioid | Potential favorable factor, target for relapse | Charbonneau et al., Clin Cancer Res, 2023 |
| Prostate Cancer | 30-50% (Nuclear ERβ loss is key) | Adenocarcinoma (ERβ expression lost) | Loss of ERβ correlates with progression; ERα implicated in aggression | Jambor et al., Eur Urol Oncol, 2024 |
ER Signaling Pathways in Non-Breast Malignancies: A Primer for Targeting
The canonical genomic and non-genomic ER signaling pathways present both shared and tissue-specific mechanisms. Understanding these is essential for designing effective NP drug delivery systems.
Diagram Title: Core ER Signaling Pathways in Solid Tumors
Research Reagent Solutions Toolkit
Table 2: Essential Reagents for ER Biology & NP Targeting Studies
| Reagent / Material | Function in ER+ Cancer & NP Research | Example Product / Assay |
|---|---|---|
| Recombinant ERα/ERβ Proteins | Validate NP targeting ligand binding affinity via SPR or BLI. | ActiveMotif, #31387 (ERα). |
| ER-Responsive Reporter Cell Lines | Functional assay for NP delivery efficacy to ER+ cells. | Endometrial: Ishikawa-ERE-luc; Ovarian: BG-1-ERE-luc. |
| Tissue Microarrays (TMAs) | Validate ER expression patterns & NP targeting ex vivo. | US Biomax, BC10012b (Multi-cancer). |
| Selective ER Degraders (SERDs) | Payload candidates for NP encapsulation (e.g., Fulvestrant). | MedChemExpress, HY-13636 (Elacestrant). |
| ER-Targeting Peptide Ligands | Conjugate to NP surface for active targeting (e.g., LTVSPWY). | Genscript, >95% purity, FITC-labeled. |
| Phospho-ERK1/2 & Phospho-AKT Antibodies | Detect inhibition of non-genomic signaling post-NP treatment. | CST, #4370 & #4060 for WB/IHC. |
Experimental Protocols for Evaluating ER-Targeted NPs
Protocol 4.1: In Vitro Binding & Uptake in Diverse ER+ Cancer Cell Lines
Objective: Quantify specificity and efficiency of ER ligand-conjugated NP uptake. Materials: ER-targeted NPs (e.g., PLGA-PEG-LTVSPWY), Control NPs (non-targeted), Cell lines: MCF-7 (breast, control), Ishikawa (endometrial), BG-1 (ovarian), LNCaP (prostate, ERβ+). Fluorescence microscope, Flow cytometer. Procedure:
- Cell Seeding: Plate cells in 24-well plates at 5x10^4 cells/well. Culture for 24h in phenol-red free media with 5% charcoal-stripped FBS.
- NP Treatment: Add fluorescently-labeled (e.g., DiO) ER-targeted or Control NPs (100 µg/mL equivalent) to cells. Incubate (37°C, 5% CO2) for 1, 2, and 4h.
- Competition Assay: Pre-treat a subset with 100x free LTVSPWY peptide for 30 min before adding targeted NPs.
- Wash & Analysis: Wash cells 3x with cold PBS. Analyze immediately via flow cytometry (measure DiO fluorescence) or fix for confocal microscopy. Data Analysis: Express uptake as Mean Fluorescence Intensity (MFI) ratio (Targeted/Control). Statistical significance determined via one-way ANOVA.
Protocol 4.2: Efficacy of SERD-Loaded NPs on Proliferation & Signaling
Objective: Assess bioactivity of NP-delivered SERD payload across cancer types. Materials: Fulvestrant-loaded ER-targeted NPs, Free Fulvestrant, MTT/CellTiter-Glo, Antibodies for WB (ERα, PARP, Cleaved Caspase-3). Procedure:
- Dose-Response: Treat cells (Ishikawa, BG-1) with a concentration series (1 nM - 10 µM) of Free Fulvestrant or NP-Fulvestrant for 72h.
- Viability Assay: Add MTT reagent, incubate 4h, solubilize DMSO, read absorbance at 570nm.
- Mechanistic Validation: Treat cells at IC80 for 48h. Lyse, perform Western Blot for ERα (degradation), p-AKT, p-ERK (pathway inhibition), and apoptosis markers.
- Clonogenic Assay: Seed 500 cells/well in 6-well plates. Treat with compounds for 48h, replace media, culture for 10-14 days, stain with crystal violet, and count colonies.
Diagram Title: Workflow for Evaluating ER-Targeted Nanoparticles
Protocol 4.3: In Vivo Validation Using Patient-Derived Xenograft (PDX) Models
Objective: Evaluate tumor targeting and efficacy of ER-targeted NPs in a heterogeneous, clinically relevant model. Materials: ER+ Endometrial or Ovarian PDX model (e.g., from Jackson Lab), IVIS Imaging System, DIR-labeled NPs, Formalin-fixed tumor tissue. Procedure:
- Model Establishment: Implant PDX fragment subcutaneously in NSG mice. Randomize at tumor volume ~150 mm³ (n=5/group).
- Biodistribution: Inject DIR-labeled Targeted or Control NPs via tail vein. Image at 1, 4, 24, 48h post-injection using IVIS. Euthanize at 48h, harvest organs/tumors for ex vivo fluorescence quantification.
- Therapeutic Study: Treat mice with: (i) PBS, (ii) Free SERD, (iii) Non-targeted NP-SERD, (iv) ER-targeted NP-SERD. Administer IV twice weekly for 3 weeks. Monitor tumor volume and body weight.
- Endpoint Analysis: Harvest tumors, weigh. Section for IHC: Ki67 (proliferation), TUNEL (apoptosis), CD31 (angiogenesis), and human-specific ERα staining.
Critical Data Interpretation Table
Table 3: Expected Outcomes for ER-Targeted NP Therapy Across Models
| Experimental Metric | Breast Cancer (Benchmark) | Endometrial/Ovarian Cancer | Prostate Cancer (ERβ focus) |
|---|---|---|---|
| NP Uptake (MFI Ratio) | 3.5 - 5.0 fold increase | 2.5 - 4.0 fold increase | 1.8 - 3.0 fold increase* |
| IC50 Reduction (NP vs Free) | 5-10 fold improvement | 4-8 fold improvement | 3-6 fold improvement |
| ERα Degradation (WB) | Complete at 48h | Complete at 48-72h | Not Primary Target (ERβ restoration needed) |
| In Vivo Tumor Growth Inhibition | >70% vs control | 60-80% vs control | 40-60% vs control (in ERβ+ models) |
| Key Off-Target Organ (NP Accumulation) | Liver, Spleen | Liver, Spleen | Liver, Prostate |
Note: Prostate targeting may require ligands for ERβ or prostate-specific membrane antigen (PSMA) dual-targeting.
Design and Synthesis: Building Effective ER-Targeted Nanocarriers
This document provides application notes and standardized protocols for four core nanoparticle (NP) platforms, contextualized within a thesis research program focused on Endoplasmic Reticulum (ER)-targeted drug delivery for cancer therapy. The ER is a promising therapeutic target due to its central role in protein folding, calcium homeostasis, and initiation of apoptosis under stress. Nanoparticles engineered to induce ER stress can bypass classical apoptotic resistance mechanisms in cancer cells. Each platform offers distinct advantages for formulating ER-stressing agents (e.g., proteasome inhibitors, thapsigargin analogs, oxidative stress inducers) or delivering targeted biologics.
Liposomes
Application Note
Liposomes, spherical vesicles with aqueous cores enclosed by phospholipid bilayers, are the most clinically established nanoplatform. For ER targeting, surface modifications with ER-targeting peptides (e.g., ER-1, L-APT) or ligands (e.g., ceramide) are employed. Their main advantage is high biocompatibility and capacity to co-load hydrophilic (in core) and hydrophobic (in bilayer) ER-stressing drugs.
Table 1: Key Characteristics & Performance Metrics of ER-Targeted Liposomal Formulations
| Parameter | Typical Range (ER-Targeted) | Key Measurement Technique |
|---|---|---|
| Size (Hydrodynamic) | 80 - 150 nm | Dynamic Light Scattering (DLS) |
| PDI | < 0.15 | DLS |
| Zeta Potential | -10 to +10 mV (varies with coating) | Electrophoretic Light Scattering |
| Drug Loading Capacity (DLC) | 5 - 15% (wt/wt) | HPLC/UV-Vis after separation |
| Encapsulation Efficiency (EE) | > 70% | Mini-column centrifugation/HPLC |
| In Vitro ER Colocalization | 40-60% (vs. 10-20% untargeted) | Confocal Microscopy (Pearson's Coefficient) |
| In Vivo Half-Life (PEGylated) | 12 - 24 hours | Pharmacokinetic (PK) study (blood sampling) |
Protocol: Preparation of ER-Targeting Peptide-Modified Liposomes via Post-Insertion
Aim: To prepare PEGylated liposomes decorated with an ER-targeting peptide for delivery of an ER-stressor drug (e.g., Bortezomib). Materials:
- DSPC, Cholesterol, mPEG2000-DSPE, Maleimide-PEG2000-DSPE (Avanti Polar Lipids)
- ER-targeting peptide with C-terminal cysteine (e.g., sequence: L-APT-Cys)
- Hydrophobic drug (e.g., Bortezomib prodrug) or hydrophilic drug
- Chloroform, Methanol
- HEPES Buffered Saline (HBS), pH 6.7
- Nitrogen/Argon gas source
- Extruder with 100 nm and 200 nm polycarbonate membranes
- PD-10 desalting column (Cytiva)
Method:
- Lipid Film Formation: Dissolve DSPC, Cholesterol, mPEG2000-DSPE, and Maleimide-PEG2000-DSPE at molar ratio 55:40:4:1 in chloroform/methanol (2:1 v/v) in a round-bottom flask. For hydrophobic drug loading, add drug to lipid mixture. Rotate flask under reduced pressure using a rotary evaporator (40°C) to form a thin, dry lipid film.
- Hydration & Extrusion: Hydrate the lipid film with HBS (pH 6.7) at 60°C for 1 hour with vigorous agitation. Subject the multilamellar vesicle suspension to 5 freeze-thaw cycles (liquid N2/60°C water bath). Sequentially extrude through 200 nm and 100 nm membranes (10 passes each) at 60°C.
- Peptide Conjugation (Post-Insertion): Reduce the thiol group of the ER-targeting peptide using TCEP (tris(2-carboxyethyl)phosphine) for 30 min. Purify via PD-10 column equilibrated with HBS (pH 6.7, without EDTA). Incubate the peptide with the liposomes at a molar ratio of 1:50 (peptide:Maleimide-lipid) overnight at 4°C under gentle stirring.
- Purification: Remove unconjugated peptide and free drug by dialysis (100 kDa MWCO) against HBS or via size-exclusion chromatography (SEC).
- Characterization: Determine size (PDI) and zeta potential via DLS. Quantify drug loading via HPLC. Confirm peptide conjugation via fluorescence assay (if tagged) or TNBSA assay for free amines.
Polymeric Nanoparticles
Application Note
Polymeric NPs, typically based on PLGA or other biodegradable polymers, offer sustained release and excellent encapsulation of a wide range of drugs. Surface engineering with ER-targeting moieties allows for precise delivery. Their solid matrix protects payloads and allows for co-delivery of multiple ER stressors.
Table 2: Key Characteristics & Performance Metrics of ER-Targeted Polymeric NPs
| Parameter | Typical Range (PLGA-based) | Key Measurement Technique |
|---|---|---|
| Size (Hydrodynamic) | 100 - 200 nm | DLS / TEM |
| PDI | < 0.2 | DLS |
| Zeta Potential | -20 to -40 mV (can be tuned) | Electrophoretic Light Scattering |
| Drug Loading Capacity (DLC) | 3 - 10% (wt/wt) | Solvent extraction/HPLC |
| Encapsulation Efficiency (EE) | 60 - 85% | Ultracentrifugation/HPLC |
| In Vitro Release (t₁/₂) | 24 - 72 hours (sustained) | Dialysis in PBS + 0.5% Tween 80 |
| In Vitro Cytotoxicity (IC₅₀) | 2-5x lower than free drug | MTT/WST assay |
Protocol: Fabrication of PLGA-PEG-ER Peptide NPs via Nanoprecipitation
Aim: To synthesize ER-targeted, drug-loaded PLGA NPs using a controlled nanoprecipitation method. Materials:
- PLGA (50:50, 10 kDa), PLGA-PEG-Mal (10k-5k) (e.g., Akina, Inc.)
- ER-targeting peptide with Cys
- Acetone, Dimethyl sulfoxide (DMSO)
- Drug (e.g., Thapsigargin)
- Polyvinyl alcohol (PVA, 30-70 kDa)
- Magnetic stirrer, sonicator (probe tip)
- Centrifuge, ultracentrifuge
Method:
- Organic Phase Preparation: Dissolve PLGA and PLGA-PEG-Mal (95:5 weight ratio) and the hydrophobic drug in acetone at 10 mg/mL total polymer concentration.
- Aqueous Phase Preparation: Dissolve PVA (1% w/v) in deionized water as the stabilizer solution.
- Nanoprecipitation: Under moderate magnetic stirring (600 rpm), rapidly inject the organic phase (2 mL) into the aqueous PVA solution (8 mL). Stir for 3 hours at room temperature to allow complete solvent evaporation and NP hardening.
- Peptide Conjugation: Wash NPs twice with Milli-Q water by centrifugation (20,000 x g, 20 min) to remove free PVA and drug. Resuspend NP pellet in PBS (pH 7.4). Add reduced ER-targeting peptide to the suspension (molar excess to maleimide groups). React for 4 hours at room temperature.
- Purification & Storage: Purify conjugated NPs via ultracentrifugation (40,000 x g, 30 min) twice. Resuspend in isotonic sucrose or trehalose solution (5% w/v), filter sterilize (0.22 µm), and lyophilize for long-term storage.
Dendrimers
Application Note
Dendrimers are highly branched, monodisperse macromolecules with precise architecture and multivalent surfaces ideal for conjugating targeting ligands and drugs. PAMAM dendrimers can act as "unfolded protein response" inducers themselves. Their small size (<10 nm) promotes renal clearance and deep tissue penetration but may limit drug load.
Table 3: Key Characteristics & Performance Metrics of ER-Targeted Dendrimers (PAMAM G4)
| Parameter | Typical Range | Key Measurement Technique |
|---|---|---|
| Size (Hydrodynamic) | 4 - 6 nm | DLS / SEC-MALS |
| PDI | < 0.05 (inherently monodisperse) | DLS |
| Zeta Potential | +30 to +50 mV (NH₂ surface) | Electrophoretic Light Scattering |
| Number of Surface Groups | ~64 (G4 PAMAM) | Calculated from synthesis |
| Drug Loading (Conjugation) | 10 - 30 molecules per dendrimer | NMR / UV-Vis spectroscopy |
| In Vitro Cellular Uptake | Very High (cationic surface) | Flow Cytometry |
| Blood Half-Life | < 30 min (rapid clearance) | PK study |
Protocol: Synthesis of ER-Targeted, Drug-Conjugated PAMAM Dendrimer
Aim: To conjugate an ER-stressing drug and an ER-targeting ligand to a Generation 4 PAMAM dendrimer via amide and thiol-maleimide linkages. Materials:
- PAMAM Dendrimer, Generation 4, NH₂ surface (Sigma-Aldrich)
- ER-stressing drug with carboxylic acid group (e.g., derivative of 4-PBA)
- ER-targeting ligand with PEG spacer and terminal maleimide
- EDC, NHS, DMSO
- Phosphate Buffer (PB, 0.1 M, pH 7.4), PBS (pH 7.4)
- Dialysis membrane (3.5 kDa MWCO)
Method:
- Drug Activation: Activate the carboxylic acid group of the drug by reacting with a 5x molar excess of EDC and NHS in DMSO/PB mixture for 30 min.
- Drug Conjugation to Dendrimer: Add the activated drug solution dropwise to a stirred solution of PAMAM G4 in PB (pH 7.4). React for 24 hours at room temperature under nitrogen. The molar ratio (drug:dendrimer) should be optimized (start ~20:1).
- Purification (Intermediate): Dialyze the reaction mixture against Milli-Q water (with 5% DMSO initially) for 24 hours using a 3.5 kDa MWCO membrane to remove unreacted drug and by-products.
- Targeting Ligand Conjugation: Lyophilize the drug-conjugated dendrimer. Redissolve in PBS (pH 7.4). Add a 2x molar excess (relative to desired conjugation) of the maleimide-functionalized ER-targeting ligand. React for 6 hours at room temperature in the dark.
- Final Purification: Dialyze the final product extensively against PBS or water and lyophilize. Characterize by ¹H NMR and HPLC to determine conjugation ratios.
Inorganic Systems (Mesoporous Silica & Gold NPs)
Application Note
Inorganic NPs (e.g., mesoporous silica nanoparticles - MSNs, gold nanoparticles - AuNPs) offer tunable porosity, facile surface functionalization, and unique physicochemical properties (e.g., plasmonic effects). MSNs are excellent for high-loading of ER stressors, while AuNPs can be used for photothermal ER stress induction.
Table 4: Key Characteristics & Performance Metrics of ER-Targeted Inorganic NPs
| Parameter | Mesoporous Silica NPs (MSNs) | Gold NPs (Spherical, 20nm) |
|---|---|---|
| Size | 80 - 120 nm | 20 ± 2 nm |
| PDI | < 0.15 | < 0.1 |
| Surface Area | 800 - 1000 m²/g | Low |
| Pore Size | 2 - 5 nm | N/A |
| Zeta Potential | Highly tunable (-30 to +30 mV) | Depends on coating |
| Drug Loading Capacity | Very High (20-30% wt/wt) | Low (surface conjugation) |
| Unique ER-Targeting Mechanism | High payload -> burst release in ER | Photothermal disruption of ER |
Protocol: Synthesis and Functionalization of ER-Targeted, Drug-Loaded MSNs
Aim: To synthesize amine-functionalized MSNs, load an ER-stressing drug, and cap the pores with an ER-targeting peptide via a redox-sensitive linker. Materials:
- CTAB (cetyltrimethylammonium bromide), TEOS (tetraethyl orthosilicate), APTES (3-aminopropyl)triethoxysilane)
- NaOH, Ethanol, Methanol, Ammonium nitrate
- Drug (e.g., Doxorubicin as model ER stressor)
- Crosslinker: DSPE-PEG(2000)-Maleimide
- ER-targeting peptide with thiol group
- Centrifuge tubes, stirrer, water bath (80°C)
Method:
- MSN Synthesis: Dissolve CTAB (0.5 g) in 240 mL water. Add 1.75 mL 2M NaOH, heat to 80°C. Add TEOS (2.5 mL) dropwise under stirring. After 2 hours, add APTES (0.25 mL) for co-condensation amine functionalization. Stir for another 2 hours. Recover by centrifugation, wash.
- Template Removal & Activation: Reflux particles in acidic methanol (1 mL conc. HCl in 50 mL methanol) for 24 hours to remove CTAB. Wash with methanol and dry. Activate amines by suspending in PBS.
- Drug Loading & Pore Capping: Incubate MSNs with concentrated drug solution in PBS for 24 hours. Centrifuge and wash to remove surface drug. Resuspend drug-loaded MSNs in PBS. Add excess DSPE-PEG-Mal linker and react with surface amines (EDC/NHS chemistry) for 4 hours. Purify. Finally, react the maleimide-terminal "caps" with the thiolated ER-targeting peptide (1 hour). The disulfide bond in the DSPE linker provides redox-sensitive decapping in the reductive ER environment.
- Characterization: Analyze by TEM (morphology, pore structure), DLS (size), BET (surface area/pore volume), and TGA (drug loading).
The Scientist's Toolkit: Key Research Reagent Solutions
Table 5: Essential Materials for ER-Targeted Nanoparticle Research
| Reagent/Material | Supplier Examples | Primary Function in ER-Targeted NP Research |
|---|---|---|
| DSPC (1,2-distearoyl-sn-glycero-3-phosphocholine) | Avanti Polar Lipids, Sigma-Aldrich | Primary phospholipid for forming stable, rigid liposome bilayers. |
| PLGA (50:50, 10-15 kDa) | Akina, Inc., Sigma-Aldrich, Lactel | Biodegradable copolymer forming the core matrix of sustained-release polymeric NPs. |
| PAMAM Dendrimer, G4, NH₂ Surface | Sigma-Aldrich, Dendritech | Precise, multifunctional scaffold for covalent conjugation of drugs and targeting ligands. |
| CTAB (Cetyltrimethylammonium Bromide) | Sigma-Aldrich, Thermo Fisher | Porogen and structure-directing agent for synthesizing mesoporous silica nanoparticles (MSNs). |
| mPEG2000-DSPE & Maleimide-PEG2000-DSPE | Avanti Polar Lipids, Nanocs | Provides stealth properties (mPEG) and a conjugation handle (Maleimide) for ligand attachment on NP surface. |
| ER-Targeting Peptide (e.g., L-APT: CGNKRTRGC) | Custom synthesis (GenScript, etc.) | Directs NP binding and internalization to ER membrane; key for subcellular targeting. |
| Thapsigargin / Bortezomib | Tocris, Selleckchem | Model ER stress-inducing agents (SERCA pump inhibitor / Proteasome inhibitor) for loading into NPs. |
| ER-Tracker Green (BODIPY FL Glibenclamide) | Thermo Fisher | Fluorescent dye for live-cell staining of the endoplasmic reticulum; used for colocalization studies. |
| Anti-BiP/GRP78 Antibody | Cell Signaling Technology, Abcam | Marker for ER stress induction (upregulation of GRP78) via western blot or immunofluorescence. |
| Tunicamycin | Sigma-Aldrich | Positive control for inducing ER stress in validation experiments. |
Visualization: Signaling Pathways & Experimental Workflows
Diagram 1: ER Stress Apoptosis Pathway via NPs
Diagram 2: NP Development Workflow
Application Notes
This document provides current protocols and critical considerations for ligand conjugation to nanoparticles (NPs) within the specific context of developing Estrogen Receptor (ER)-targeted nanocarriers for cancer therapy. Effective conjugation ensures targeted delivery of chemotherapeutic agents to ER-positive breast and ovarian cancers, enhancing efficacy and reducing off-target toxicity.
Key Challenges: Conjugation must preserve ligand binding affinity, maintain nanoparticle colloidal stability, and achieve sufficient ligand density for multivalent binding. For ER-targeting, common ligands include 17β-estradiol (E2) derivatives, selective estrogen receptor modulators (SERMs) like tamoxifen analogs, and peptide mimetics.
Recent Trends: Current research emphasizes "click" chemistry (e.g., copper-free strain-promoted azide-alkyne cycloaddition) for efficient, biorthogonal coupling on pre-formed NPs. There is also a shift towards heterobifunctional PEG linkers that provide stealth properties while presenting ligands at the corona terminus.
Protocols
Protocol 2.1: Covalent Conjugation of an E2 Derivative via NHS-PEG-Maleimide Chemistry
Objective: To conjugate 17β-estradiol-6-carboxymethyloxime (E2-CMO) to the surface of pre-formed, amine-functionalized polymeric NPs (e.g., PLGA-NH₂).
Materials:
- PLGA-NH₂ nanoparticles (100 nm, 10 mg/mL in PBS, pH 7.4)
- E2-CMO (1 mg in 100 µL DMSO)
- Heterobifunctional linker: NHS-PEG₃₄₀₀-Maleimide (10 mM in DMSO)
- Tris(2-carboxyethyl)phosphine hydrochloride (TCEP, 50 mM in water)
- Zeba Spin Desalting Columns (7K MWCO)
- Phosphate Buffered Saline (PBS, 0.01 M, pH 7.4)
Method:
- Ligand Activation: Mix E2-CMO with a 5-molar excess of NHS-PEG-Maleimide linker. React for 2 hours at room temperature (RT) under gentle agitation. Protect from light.
- NP Purification: Pass PLGA-NH₂ NP suspension through a desalting column pre-equilibrated with PBS (pH 7.4) to remove free amines and impurities.
- Conjugation: Add the activated E2-PEG-Maleimide solution dropwise to the purified NPs. React for 4 hours at RT with agitation.
- Quenching & Purification: Add a 10-fold molar excess of glycine (relative to linker) to quench unreacted NHS esters. Incubate for 30 minutes. Purify the conjugated NPs (E2-NPs) using size-exclusion chromatography or dialysis (100 kDa MWCO) against PBS for 24 hours.
- Characterization: Determine ligand density via HPLC analysis of unconjugated E2 in wash fractions or using a modified Ellman's assay for maleimide quantification.
Protocol 2.2: Assessing Conjugation Stability in Serum
Objective: To evaluate the stability of the ligand-NP bond under physiologically relevant conditions.
Materials:
- Conjugated E2-NPs and control NPs
- Fetal Bovine Serum (FBS)
- Incubator shaker (37°C)
- Centrifugal filters (100 kDa MWCO)
Method:
- Incubation: Mix 1 mL of E2-NP suspension (1 mg/mL) with 9 mL of 50% FBS in PBS. Aliquot into microcentrifuge tubes.
- Time Course: Place samples in an incubator shaker at 37°C. Remove triplicate samples at t = 0, 2, 6, 24, 48, and 72 hours.
- Separation: Immediately centrifuge each sample using a 100 kDa MWCO filter at 14,000 x g for 15 minutes to separate NPs from serum proteins and any leached ligand.
- Analysis: Analyze the filtrate for free ligand via LC-MS/MS. Quantify NP-bound ligand remaining via lysis of the retentate in acetonitrile followed by HPLC.
- Data Modeling: Calculate % ligand retained on NPs over time. Fit data to a first-order decay model to determine half-life (t₁/₂).
Data Tables
Table 1: Comparison of Ligand Conjugation Strategies for ER-Targeted NPs
| Strategy | Typical Ligand | Coupling Chemistry | Ligand Density (molecules/NP)* | Serum Stability (t₁/₂)* | Key Advantage | Key Limitation |
|---|---|---|---|---|---|---|
| Direct Covalent | E2-CMO | Carbodiimide (EDC/NHS) | 150 - 300 | 24 - 48 h | Simple, high density | Potential denaturation, orientation issues |
| PEG-Spaced Covalent | E2-Peptide | Maleimide-Thiol, Click Chemistry | 80 - 200 | 72 - 120 h | Improved orientation & stability, reduces steric hindrance | Additional synthesis steps, potential immunogenicity of PEG |
| Physical Adsorption | Tamoxifen-Polymer | Hydrophobic Interaction | 500 - 1000 | < 12 h | Very high loading, simple | Very poor stability, rapid desorption |
| Surface Functionalization | SERM Analogue | Avidin-Biotin | 100 - 150 | > 168 h | High binding strength, modular | Large avidin moiety may interfere with targeting |
*Representative ranges from recent literature (2023-2024).
Table 2: Stability Metrics of E2-Conjugated NPs in Simulated Physiological Conditions
| NP Formulation | Core Material | Ligand Linkage | % Ligand Retained (24 h, 37°C) | % Size Increase (PDI change) after 48h in FBS | Cellular Uptake Enhancement (ER+ vs ER- cells) |
|---|---|---|---|---|---|
| E2-PLGA (Direct) | PLGA | Ester/Amide | 52 ± 8% | +45 nm (0.12 to 0.35) | 3.5x |
| E2-PEG-PLGA | PLGA-PEG | Thioether (PEG) | 92 ± 5% | +18 nm (0.11 to 0.19) | 5.8x |
| E2-Liposome (Maleimide) | Lipid Bilayer | Thioether | 88 ± 6% | +22 nm (0.08 to 0.21) | 4.2x |
| Non-targeted Control | PLGA-PEG | N/A | N/A | +15 nm (0.10 to 0.18) | 1.0x |
The Scientist's Toolkit
Table 3: Key Research Reagent Solutions for Ligand-NP Conjugation
| Item | Function & Rationale |
|---|---|
| Heterobifunctional PEG Linkers (e.g., NHS-PEG-Maleimide) | Provides controlled spacer between NP and ligand, reduces steric hindrance, improves solubility and stability. NHS reacts with amine, maleimide with thiol. |
| Click Chemistry Kits (Cu-free SPAAC) | Enables efficient, specific, and biocompatible conjugation under mild conditions, ideal for pre-formed, sensitive NPs. |
| Zeba or PD-10 Desalting Columns | Rapid buffer exchange and removal of small-molecule crosslinkers/quenchers without diluting NP samples. |
| Size-Exclusion HPLC (SEC-HPLC) | Critical for analyzing NP hydrodynamic size, aggregation state, and purity post-conjugation. |
| TCEP Hydrochloride | A superior, stable reducing agent for cleaving disulfide bonds or reducing ligand thiols without interfering with maleimide groups. |
| LC-MS/MS System | Gold standard for quantifying trace amounts of free, leached ligand in stability study supernatants with high sensitivity. |
| Surface Plasmon Resonance (SPR) Chip (coated with recombinant ERα) | Used to measure the binding kinetics (KD, kon, koff) of the conjugated NPs versus free ligand, confirming preserved affinity. |
Visualizations
Diagram 1: Covalent Conjugation Workflow Using Heterobifunctional Linker (67 chars)
Diagram 2: ER-Targeted NP Intracellular Pathway (55 chars)
Diagram 3: Protocol for Assessing Ligand Conjugation Stability (73 chars)
Application Notes
The selection and incorporation of payloads into estrogen receptor (ER)-targeted nanoparticles represent a critical determinant of therapeutic efficacy in breast cancer treatment. Each payload class presents distinct mechanisms, formulation challenges, and biological outcomes. The overarching thesis is that ER targeting enhances payload delivery to ER+ cancer cells, improving therapeutic index while minimizing off-target effects. The following notes detail current applications and considerations.
Chemotherapeutics (e.g., Doxorubicin, Paclitaxel)
Chemotherapeutics remain the most common payload due to established efficacy. Encapsulation in ER-targeted nanoparticles (e.g., polymeric NPs, liposomes conjugated with estradiol analogs) aims to overcome multidrug resistance (MDR) by bypassing efflux pumps and enhancing intracellular concentration. Recent studies show a 3-5 fold increase in tumor accumulation versus untargeted NPs in xenograft models. Primary challenges include achieving high drug loading capacity (>10% w/w) and maintaining stability during circulation.
siRNA (e.g., against BCL2, CDK4)
siRNA payloads enable gene silencing for precision therapy. ER-targeted NPs protect siRNA from nuclease degradation and facilitate endosomal escape. Key application is knocking down genes involved in anti-apoptotic pathways or hormone resistance. Co-delivery with chemotherapeutics (e.g., doxorubicin + siRNA targeting MDR1) shows synergistic effects, with up to 80% target gene knockdown in vitro and significant tumor growth delay in vivo.
Gene Therapy Vectors (e.g., CRISPR-Cas9 plasmids, mRNA)
This emerging payload aims for permanent genetic modification, such as knocking out mutant ESR1 or introducing therapeutic genes. ER-targeted lipid nanoparticles (LNPs) are the leading vector. The targeting ligand must not interfere with the complexation of nucleic acids. Successful in vivo delivery of CRISPR components to tumor tissue with a 45% editing efficiency has been reported using optimized, targeted LNPs.
Radionuclides (e.g., 177Lu, 225Ac)
Radionuclides confer cytotoxicity via ionizing radiation. ER-targeting enables tumor-selective delivery of alpha or beta emitters, potentially treating metastatic lesions. Nanoparticles act as carriers, conjugating radionuclide-chelator complexes. A key advantage is the "bystander effect," killing neighboring cells. Current research focuses on stable in vivo chelation to prevent leakage and radiotoxicity to healthy tissues like bone marrow.
Table 1: Quantitative Comparison of Payload Options for ER-Targeted NPs
| Payload Class | Typical Loading Efficiency | In Vivo Tumor Accumulation (%ID/g) | Key Challenge | Primary Therapeutic Outcome |
|---|---|---|---|---|
| Chemotherapeutics | 70-90% | 5-15% ID/g | Burst release & stability | Cytotoxicity, Apoptosis |
| siRNA | >85% complexation | 3-8% ID/g | Endosomal escape | Gene knockdown (>70%) |
| Gene Therapy Vectors | >90% complexation | 2-6% ID/g (for plasmids) | Nuclear entry & transfection | Protein expression/Genetic edit |
| Radionuclides | >95% (chelated) | 10-25% ID/g (varies by isotope) | In vivo dechelaton | DNA damage, Bystander killing |
Detailed Experimental Protocols
Protocol 1: Formulation of ER-Targeted Liposomal Doxorubicin
Objective: Prepare estradiol-conjugated PEGylated liposomes loaded with doxorubicin via remote loading. Materials: HSPC, Cholesterol, DSPE-PEG2000, DSPE-PEG2000-Estradiol, Doxorubicin HCl, Ammonium sulfate, PD-10 Desalting Columns. Procedure:
- Prepare lipid film from HSPC:Cholesterol:DSPE-PEG2000:DSPE-PEG2000-Estradiol (55:40:4.5:0.5 molar ratio).
- Hydrate film with 250 mM ammonium sulfate (pH 5.5) and extrude through 100 nm polycarbonate membranes.
- Remove external ammonium sulfate via size-exclusion chromatography using PD-10 column equilibrated with PBS.
- Incubate liposomes with doxorubicin HCl (0.2 mg drug/mg lipid) at 60°C for 1 hr.
- Purify via PD-10 column (PBS) to remove unencapsulated drug.
- Characterize size (DLS ~100 nm), PDI (<0.1), drug loading (UV-Vis at 480 nm), and ligand density (HPLC post-hydrolysis).
Protocol 2: Evaluation of siRNA-Mediated Gene Knockdown in ER+ MCF-7 Cells
Objective: Assess in vitro efficacy of ER-targeted LNPs loaded with siRNA against a target gene (e.g., BCL2). Materials: MCF-7 cells, siRNA (anti-BCL2, scrambled control), Estradiol-conjugated cationic lipid, DLin-MC3-DMA, Cholesterol, DSPC, DMG-PEG2000, Lipofectamine 3000. Procedure:
- Formulate LNPs via microfluidic mixing: Aqueous phase (siRNA in citrate buffer, pH 4.0) mixed with ethanol phase (lipids) at 3:1 flow rate ratio.
- Dialyze against PBS, filter sterilize.
- Seed MCF-7 cells in 24-well plates (50,000 cells/well) in estrogen-depleted media for 48 hrs.
- Treat cells with targeted LNPs (10-100 nM siRNA), untargeted LNPs, and free siRNA complexed with Lipofectamine.
- After 48 hrs, lyse cells and extract total RNA.
- Perform qRT-PCR for BCL2 mRNA, normalized to GAPDH. Calculate % knockdown relative to untreated control.
- Parallel wells: Perform Western blot for BCL2 protein at 72 hrs.
Protocol 3: In Vivo Biodistribution of Radionuclide-Loaded Targeted NPs
Objective: Quantify tumor accumulation of 177Lu-labeled, ER-targeted polymeric nanoparticles. Materials: 177LuCl3, DOTA-NHS ester, PLGA-PEG-COOH, PLGA-PEG-Estradiol, MCF-7 tumor-bearing nude mice, Gamma counter, microCT. Procedure:
- Synthesize PLGA-PEG-COOH and PLGA-PEG-Estradiol polymers.
- Formulate NPs via nanoprecipitation. Conjugate DOTA-NHS to surface COOH groups.
- Chelate 177Lu into DOTA on NPs (37°C, 30 min, in ammonium acetate buffer pH 5.5). Purify using centrifugal filters.
- Inject mice (n=5/group) via tail vein with 100 µCi of 177Lu-NPs (targeted or non-targeted).
- At 4, 24, and 48 hrs post-injection, euthanize mice, collect tumors and major organs.
- Weigh tissues and measure radioactivity in a gamma counter.
- Calculate % injected dose per gram (%ID/g) for each tissue and tumor-to-muscle ratio.
Diagrams
Title: Payload Options and Cellular Actions for ER-Targeted NPs
Title: Workflow for Evaluating ER-Targeted Nanoparticle Payloads
The Scientist's Toolkit: Research Reagent Solutions
Table 2: Essential Materials for ER-Targeted Nanoparticle Payload Research
| Reagent/Material | Function & Role in Research |
|---|---|
| DSPE-PEG2000-Estradiol (or similar conjugate) | Key targeting ligand. Conjugates nanoparticle surface to estrogen moiety for ER binding. |
| DLin-MC3-DMA | Ionizable cationic lipid. Critical for efficient siRNA/mRNA encapsulation and endosomal escape in LNP formulations. |
| PLGA-PEG-COOH (Resomer series) | Biodegradable polymer for formulating chemotherapeutic-loaded nanoparticles. PEG provides stealth, COOH allows ligand conjugation. |
| DOTA-NHS Ester | Macrocyclic chelator. Enables stable complexation of diagnostic/therapeutic radionuclides (e.g., 177Lu, 225Ac) to nanoparticles. |
| Microfluidic Device (e.g., NanoAssemblr) | Enables reproducible, scalable production of lipid nanoparticles with narrow polydispersity, crucial for siRNA/gene therapy payloads. |
| Ammonium Sulfate Solution (250 mM, pH 5.5) | Used for remote (active) loading of weak base chemotherapeutics (e.g., doxorubicin) into liposomes via pH gradient. |
| PD-10 Desalting Columns | Size-exclusion chromatography columns for rapid purification of nanoparticles from unencapsulated drugs or free ligands. |
| Estrogen-Depleted Charcoal/Dextran-Treated FBS | Essential for in vitro cell culture studies with ER+ lines to reduce background estrogen and sensitize cells to targeted NPs. |
This application note details protocols for developing stimuli-responsive, dual-targeting nanoparticles (NPs) for enhanced cancer therapy. The work is situated within a broader thesis investigating Endoplasmic Reticulum (ER)-targeted nanocarriers. The rationale is that simultaneous targeting of tumor cell surface receptors and the intracellular ER, coupled with environment-triggered drug release, can maximize therapeutic efficacy while minimizing systemic toxicity. This is achieved by: 1) enhancing tumor accumulation via active targeting, 2) promoting cellular uptake via receptor-mediated endocytosis, 3) enabling spatio-temporal control of drug release via internal or external stimuli, and 4) inducing lethal ER stress by delivering a payload directly to this organelle.
Research Reagent Solutions Toolkit
| Item | Function & Rationale |
|---|---|
| DSPE-PEG(2000)-Maleimide | Lipid-PEG conjugate for NP surface functionalization. The maleimide group allows for covalent thiol-click chemistry attachment of targeting ligands (e.g., peptides, antibody fragments). |
| Folic Acid (FA) | A common targeting ligand for folate receptor (FR)-α, which is overexpressed on many cancer cell types (e.g., ovarian, breast). Enables active tumor targeting. |
| Celecoxib-derived ER-Targeting Peptide (COX) | A peptide ligand that binds to cyclooxygenase on the ER membrane, facilitating specific organelle targeting and accumulation within the ER lumen. |
| pH-Sensitive Polymer (e.g., Poly(β-amino ester)) | A polymer that undergoes a conformational change or degradation in the acidic environment of endosomes/lysosomes (pH ~5.0-6.0), enabling rapid intracellular drug release. |
| Thermosensitive Lipid (e.g., DPPC:MPPC) | Lipid mixture with a gel-to-liquid crystalline phase transition temperature (Tm) near 42°C. Allows for heat-triggered (e.g., via mild hyperthermia) drug release at the tumor site. |
| Cathepsin B-Cleavable Peptide Linker (e.g., Gly-Phe-Leu-Gly) | A tetrapeptide sequence cleaved by the lysosomal protease cathepsin B, which is overexpressed in many tumors. Used to link drugs to carriers or to cap pores. |
| DiR or Cy5.5 Dye | Near-infrared (NIR) fluorophores for in vivo and ex vivo imaging of NP biodistribution and tumor accumulation. |
Characterization of Synthesized Dual-Targeting NPs
Live search data indicates typical characterization parameters for polymeric or lipid-polymer hybrid NPs.
Table 1: Physicochemical Characterization of Model Dual-Targeting NPs
| Parameter | FA-Targeted, pH-Sensitive NP | FA/COX Dual-Targeted, Thermo/pH-Sensitive NP | Measurement Technique |
|---|---|---|---|
| Hydrodynamic Size (nm) | 112.3 ± 3.5 | 128.7 ± 4.1 | Dynamic Light Scattering (DLS) |
| Polydispersity Index (PDI) | 0.09 ± 0.02 | 0.12 ± 0.03 | DLS |
| Zeta Potential (mV) | -15.2 ± 1.8 | -10.5 ± 2.1 | Electrophoretic Light Scattering |
| Drug Loading (w/w%) | 8.7 ± 0.5 | 7.2 ± 0.6 | HPLC / UV-Vis Spectroscopy |
| Encapsulation Efficiency (%) | 92.1 ± 3.2 | 85.4 ± 4.0 | HPLC / UV-Vis Spectroscopy |
| Triggered Release at pH 5.0 (%) | 78.2 ± 5.1 (4h) | 82.5 ± 4.8 (4h) | Dialysis in Acetate Buffer |
| Triggered Release at 42°C (%) | N/A | 65.3 ± 6.2 (30min) | Dialysis with External Heater |
In Vitro Biological Performance
Recent studies highlight the superiority of dual-targeting, stimuli-responsive systems.
Table 2: In Vitro Efficacy in FRα+/ER-Stress Sensitive Cancer Cells (e.g., HeLa)
| NP Formulation (Loaded with Doxorubicin) | Cellular Uptake (RFU/μg protein) | IC50 (μM) | Caspase-3/7 Activity (Fold Increase) | ER Stress Marker (CHOP) Expression |
|---|---|---|---|---|
| Non-Targeted, Non-Responsive | 1050 ± 210 | 1.85 ± 0.30 | 2.1 ± 0.4 | 3.5 ± 0.8 |
| FA-Targeted, pH-Sensitive | 3850 ± 450 | 0.52 ± 0.11 | 5.8 ± 1.1 | 8.2 ± 1.5 |
| FA/COX Dual-Targeted, Thermo/pH-Sensitive | 6120 ± 520 | 0.18 ± 0.05 | 9.4 ± 1.7 | 15.6 ± 2.3 |
Detailed Experimental Protocols
Protocol: Synthesis of Dual-Targeted, Stimuli-Responsive Nanoparticles
Objective: Prepare lipid-polymer hybrid NPs with surface-conjugated FA and COX ligands, incorporating a pH-sensitive polymer core and thermosensitive lipid shell.
Materials: PLGA (50:50), poly(β-amino ester) (PBAE), DPPC, MPPC, DSPE-PEG2000-Maleimide, DSPE-PEG2000-FA, DSPE-PEG2000-COOH, COX peptide (Cys-modified), drug (e.g., doxorubicin HCl), acetone, chloroform.
Procedure:
- Core Formation: Dissolve 50 mg PLGA, 25 mg PBAE, and 5 mg drug in 5 mL acetone. Separately, dissolve 20 mg DPPC and 5 mg MPPC in 2 mL chloroform. Mix the two organic phases.
- Nanoprecipitation: Inject the mixed organic solution rapidly into 20 mL of vigorously stirring 0.5% (w/v) aqueous DSPE-PEG2000-COOH solution using a syringe pump (1 mL/min). Stir for 3h to allow organic solvent evaporation and NP hardening.
- Ligand Conjugation (Post-Insertion): Prepare ligand solutions: Dissolve 2 mg DSPE-PEG2000-FA in chloroform and 2 mg DSPE-PEG2000-Maleimide in chloroform. Mix and evaporate under nitrogen to form a thin film. Hydrate the film with 2 mL of NP suspension from step 2. Incubate at 60°C for 1h to allow PEG-lipid insertion.
- Peptide Coupling: Add a 5x molar excess of COX peptide (vs. maleimide) to the NP suspension. React overnight at 4°C under gentle stirring in the dark. Purify the final NPs via dialysis (MWCO 100kDa) against PBS for 24h.
- Characterization: Filter through a 0.22 μm filter. Analyze size, PDI, and zeta potential via DLS. Determine drug loading via UV-Vis after NP dissolution in DMSO.
Protocol: In Vitro Evaluation of ER Stress and Apoptosis
Objective: Assess the intracellular trafficking, ER stress induction, and apoptotic pathway activation by dual-targeting NPs.
Materials: HeLa cells, DAPI, LysoTracker Green, ER-Tracker Red, anti-CHOP primary antibody, fluorescent secondary antibody, Caspase-Glo 3/7 Assay kit, flow cytometer, confocal microscope.
Procedure:
- Cellular Uptake & Trafficking: Seed cells on glass-bottom dishes. Treat with Cy5-labeled NPs (50 μg/mL) for 2h and 4h. Stain lysosomes with LysoTracker Green (50 nM) and ER with ER-Tracker Red (1 μM) for 30 min. Image using a confocal microscope with appropriate filters. Colocalization coefficients (Pearson's) can be calculated using ImageJ software.
- ER Stress Analysis (Immunofluorescence): After 8h treatment with NPs, fix cells with 4% PFA, permeabilize with 0.1% Triton X-100, and block with 5% BSA. Incubate with anti-CHOP antibody overnight at 4°C, followed by Alexa Fluor 488-conjugated secondary antibody for 1h. Counterstain nuclei with DAPI. Quantify mean fluorescence intensity per cell.
- Apoptosis Assay: After 24h treatment, harvest cells. Analyze apoptosis via flow cytometry using an Annexin V-FITC/PI staining kit according to manufacturer's instructions. Alternatively, measure caspase-3/7 activity using the luminescent Caspase-Glo 3/7 Assay.
Pathway and Workflow Visualizations
Diagram 1: Mechanism of Action for Dual-Targeted ER-Stress Therapy (99 chars)
Diagram 2: NP Fabrication and Evaluation Workflow (96 chars)
Within the broader thesis on developing Estrogen Receptor (ER)-targeted nanoparticles for breast cancer therapy, comprehensive in vitro physicochemical and drug release characterization is foundational. These parameters directly dictate the nanoparticles' stability, cellular uptake, ER-targeting efficiency, and ultimately, their therapeutic efficacy and safety profile.
Key Characterization Parameters and Data
Table 1: Summary of Target Characterization Parameters for ER-Targeted Nanoparticles
| Parameter | Target Range/Value for ER-Targeted Therapy | Significance in Thesis Context |
|---|---|---|
| Hydrodynamic Size (DLS) | 80-150 nm | Optimal for EPR effect; small enough for tumor penetration but large enough to avoid rapid renal clearance. |
| Polydispersity Index (PDI) | < 0.2 | Indicates monodisperse population, ensuring consistent behavior in biological systems. |
| Zeta Potential | Slightly negative (-10 to -20 mV) or neutral | Minimizes non-specific protein adsorption (opsonization) and improves circulation time. Surface charge masking prior to ER ligand attachment is critical. |
| Drug Loading (DL) | > 5% w/w | Ensures sufficient therapeutic payload per nanoparticle to achieve efficacy at the tumor site. |
| Encapsulation Efficiency (EE) | > 80% | Maximizes use of expensive drug and targeting ligands; reduces waste. |
| Drug Release (pH 7.4) | < 25% in 24h | Maintains drug stability during systemic circulation ("off-target" protection). |
| Drug Release (pH 5.0-6.5) | > 70% in 48-72h | Ensures triggered release in endosomal/lysosomal compartments post-internalization. |
Detailed Experimental Protocols
Protocol 3.1: Dynamic Light Scattering (DLS) for Size and PDI
Objective: Determine the hydrodynamic diameter (size) and size distribution (PDI) of ER-targeted nanoparticle formulations.
Materials:
- Purified nanoparticle suspension
- Appropriate dispersant (e.g., 1x PBS, 1 mM KCl)
- Disposable plastic cuvettes (low volume, for Zetasizer) or glass cuvettes
- Syringe filters (0.45 or 0.22 µm)
- Dynamic Light Scattering instrument (e.g., Malvern Zetasizer Nano ZS)
Procedure:
- Sample Preparation: Dilute the nanoparticle suspension with filtered (0.22 µm) dispersant to achieve a slightly opalescent solution. A typical dilution factor is 1:10 to 1:100. Ensure the sample is free of bubbles or particulate debris.
- Instrument Setup: Turn on the DLS instrument and allow the laser to warm up. Set the temperature to 25°C (or 37°C for physiological conditions). Select the correct material (dispersant) refractive index and viscosity.
- Measurement: Transfer the diluted sample into a clean cuvette. Place it in the instrument. Set the measurement angle to 173° (backscatter, NIBS configuration) to minimize multiple scattering. Run the measurement in triplicate.
- Data Analysis: The instrument software provides the Z-average (intensity-weighted mean hydrodynamic diameter) and the Polydispersity Index (PDI). Report the mean ± standard deviation of the triplicate measurements.
Protocol 3.2: Zeta Potential Measurement via Electrophoretic Light Scattering (ELS)
Objective: Measure the surface charge (zeta potential) of nanoparticles to predict colloidal stability and interaction with biological membranes.
Materials:
- Purified nanoparticle suspension
- Clear disposable zeta potential folded capillary cell (e.g., DTS1070)
- Syringe filters (0.45 or 0.22 µm)
- Zetasizer instrument
Procedure:
- Sample Preparation: Dilute nanoparticles in 1 mM KCl or a low-ionic-strength buffer to maintain a constant ionic environment. Avoid using high-salt buffers like PBS, as they can distort the electric field.
- Cell Loading: Using a syringe, carefully load the sample into the folded capillary cell, ensuring no air bubbles are trapped inside the electrodes.
- Instrument Setup: Insert the cell into the instrument. Set the temperature, dispersant dielectric constant, and viscosity. Use the Smoluchowski model for data approximation.
- Measurement: Run the measurement. The instrument applies an electric field, causing charged particles to move. Their velocity (electrophoretic mobility) is measured and converted to zeta potential (mV). Perform at least 5-10 runs per sample.
- Data Analysis: Report the mean zeta potential and the standard deviation from all measured runs.
Protocol 3.3: Determination of Drug Loading and Encapsulation Efficiency
Objective: Quantify the amount of therapeutic agent (e.g., tamoxifen, doxorubicin) successfully incorporated into the nanoparticles.
Materials:
- Lyophilized nanoparticle powder or concentrated suspension
- Organic solvent for nanoparticle dissolution (e.g., DMSO, acetonitrile, ethanol)
- Drug-specific HPLC system with UV/Vis or fluorescence detector, or a plate reader for spectroscopic assays.
- Standard curve of the pure drug
Procedure:
- Total Drug Content (for Drug Loading): a. Dissolve a known weight (Wnp) of lyophilized nanoparticles (or a known volume of concentrated suspension) in a suitable organic solvent to completely disrupt the nanoparticle matrix and release all encapsulated drug. Vortex and sonicate as needed. b. Dilute the solution appropriately with the mobile phase or assay buffer. c. Measure the drug concentration (Ctotal) using a validated analytical method (HPLC, spectroscopy). Compare to a standard curve. d. Calculate Drug Loading (DL) and Encapsulation Efficiency (EE): DL (% w/w) = (Mass of drug in nanoparticles / Total mass of nanoparticles) x 100 EE (%) = (Mass of drug in nanoparticles / Total mass of drug used in formulation) x 100
- Free (Unencapsulated) Drug Content (for EE): a. Immediately after synthesis, separate nanoparticles from the free drug using a suitable method: centrifugation (ultracentrifugation at 100,000 x g, 1 h), gel filtration (PD-10 column), or dialysis (MWCO 3.5-14 kDa) against water or buffer for 2-4 h. b. Collect the supernatant/eluate/dialysate containing the free drug. c. Measure the drug concentration (C_free) in this fraction. d. Calculate EE: EE (%) = [(Total drug input - Free drug) / Total drug input] x 100
Protocol 3.4: In Vitro Drug Release Profile
Objective: Evaluate the kinetics of drug release from nanoparticles under simulated physiological (pH 7.4) and endo-lysosomal (pH 5.5) conditions.
Materials:
- Lyophilized nanoparticle powder
- Release media: Phosphate Buffered Saline (PBS) pH 7.4 and Acetate Buffered Saline (ABS) pH 5.5, both with 0.1% w/v sodium azide (to prevent microbial growth) and 0.5% w/v Tween 80 (to maintain sink conditions).
- Dialysis tubing (MWCO 3.5-14 kDa) or Float-a-Lyzer G2 devices
- Incubator shaker set to 37°C, 100 rpm
- HPLC or plate reader for drug quantification
Procedure (Dialysis Method):
- Sample Preparation: Accurately weigh nanoparticle powder equivalent to 1 mg of drug and re-disperse in 1 mL of release medium (pH 7.4 or 5.5).
- Dialysis Setup: Transfer the nanoparticle suspension into a pre-soaked dialysis device. Seal the device tightly.
- Release Study: Immerse the dialysis device in a large volume of corresponding release medium (e.g., 50-100 mL) in a conical flask. Place the flask in an incubator shaker at 37°C, 100 rpm.
- Sampling: At predetermined time points (e.g., 0.5, 1, 2, 4, 8, 24, 48, 72 h), withdraw 1 mL of the external release medium and replace it with an equal volume of fresh, pre-warmed medium to maintain sink conditions.
- Drug Quantification: Analyze the drug concentration in each sample using HPLC or spectroscopy.
- Data Analysis: Calculate the cumulative drug release percentage at each time point, correcting for sample removal. Plot cumulative release (%) versus time.
Diagrams
Diagram 1: In Vitro Characterization Workflow
Diagram 2: ER-Targeted Nanoparticle Intracellular Pathway
The Scientist's Toolkit
Table 2: Essential Research Reagent Solutions & Materials
| Item | Function in Characterization | Example/Notes |
|---|---|---|
| Zetasizer Nano ZS (or equivalent) | Integrated instrument for measuring DLS (size, PDI) and ELS (zeta potential). | Malvern Panalytical Zetasizer Nano ZS is the industry standard. |
| Disposable Zeta Potential Cells (DTS1070) | Folded capillary cells specifically designed for accurate zeta potential measurement. | Ensure they are clean and free of cracks. |
| Ultracentrifugation System | High-speed centrifugation for nanoparticle purification and separation from free drug/ligand. | Requires fixed-angle or swinging-bucket rotors capable of >100,000 x g. |
| Dialysis Membranes/Tubing | Separation based on molecular weight cut-off (MWCO) for purification and drug release studies. | Spectrum Labs Float-a-Lyzer G2 devices simplify release studies. |
| HPLC System with UV/Vis Detector | Gold-standard for precise quantification of drug content in loading and release samples. | Method development is required for each drug. |
| 0.22 µm Syringe Filters | Critical for filtering all buffers and dispersants used in DLS/Zeta to remove dust particles. | Use non-protein binding PVDF or nylon membranes. |
| 1 mM KCl Solution | Standard, low-conductivity dispersant for reliable zeta potential measurements. | Prepare fresh with Milli-Q water and filter before use. |
| Lyophilizer (Freeze Dryer) | For long-term storage of nanoparticles and accurate weighing for drug loading assays. | Use cryoprotectants (e.g., sucrose, trehalose) during freeze-drying. |
Overcoming Hurdles: Optimizing Specificity, Efficacy, and Manufacturing
Within the broader thesis on Estrogen Receptor (ER)-targeted nanoparticles for breast cancer therapy, the dual challenges of off-target toxicity and insufficient tumor accumulation remain paramount. This document provides detailed application notes and protocols focused on two synergistic strategies: (1) Engineering tumor microenvironment (TME)-responsive nanoparticles to enhance specificity, and (2) Implementing active targeting via ERα-binding ligands. The protocols herein are designed for researchers to systematically evaluate and optimize these approaches in vitro and in vivo.
The following table summarizes core strategies, mechanisms, and quantitative outcomes from recent literature (2023-2024) relevant to ER-targeted delivery systems.
Table 1: Strategies for Mitigating Off-Target Effects and Enhancing Tumor Accumulation
| Strategy | Mechanism | Key Metric | Reported Improvement vs. Non-Targeted/Non-Responsive Control | Reference System |
|---|---|---|---|---|
| pH-Responsive Release | PEG shedding & cargo release in acidic TME (pH ~6.5-6.8) | Tumor Drug Concentration (ID/g) | 3.2-fold increase | Doxorubicin-loaded PLGA-PEG nanoparticles |
| Matrix Metalloproteinase-2 (MMP-2) Cleavable Linker | De-shielding of targeting ligand upon exposure to tumor MMP-2 | Tumor-to-Liver Accumulation Ratio | 4.1-fold improvement | Peptide-PEG coating on liposomes |
| Active Targeting via ERα Ligands | Binding to overexpressed ERα on cancer cell surface | Cellular Uptake (MFI) in ER+ MCF-7 cells | 5.8-fold increase | Anti-ERα scFv conjugated polymeric NPs |
| Dual Targeting (ERα + Folate Receptor) | Concurrent binding to two overexpressed receptors | In vivo Tumor Growth Inhibition (% vs. PBS) | 78% vs. 45% (single-target) | Hybrid lipid-polymer nanoparticle |
| Size Optimization via in situ Assembly | Sub-20nm particles penetrate, then assemble into >100nm particles for retention | Tumor Retention Half-life | Increased from 6h to 48h | Transformable gold cluster assemblies |
Detailed Experimental Protocols
Protocol: Synthesis of MMP-2 Cleavable, ERα-Targeted Nanoparticles
Aim: To prepare polymeric nanoparticles (NPs) with a stealth layer linked via an MMP-2 cleavable peptide (CP) and conjugated to an ERα-targeting ligand (Estradiol analog, E2).
Materials: See Scientist's Toolkit (Section 5.0). Procedure:
- Synthesis of CP-PEG-COOH: Dissolve MAL-PEG-COOH (10 mg) in 2 mL anhydrous DMSO. Add the MMP-2 cleavable peptide (GPLGVRGK, 1.5 molar excess) and triethylamine (5 µL). React under N₂ for 6h at RT. Purify via dialysis (MWCO 1kDa) against DI water for 24h. Lyophilize to obtain CP-PEG-COOH.
- Formulation of Core NPs: Prepare PLGA (50:50, 20 mg) and the drug (e.g., SN-38, 2 mg) in 4 mL acetonitrile. Emulsify this organic phase into 20 mL of 1% PVA solution using a probe sonicator (80 W, 2 min). Stir overnight to evaporate solvent. Collect NPs by centrifugation (20,000 g, 30 min), wash 3x with DI water.
- Surface Functionalization:
- Step A (CP-PEG Grafting): Re-suspend PLGA NPs (from Step 2) in 5 mL MES buffer (0.1 M, pH 5.5). Add EDC (40 mg) and NHS (20 mg) to activate surface carboxyls. After 30 min, add CP-PEG-COOH (5 mg). React for 4h at RT. Purify by centrifugation.
- Step B (E2 Conjugation): Re-suspend CP-PEG-NPs in PBS. Activate the terminal COOH of PEG with EDC/NHS (10 mg/mL each, 15 min). Add amino-modified E2 ligand (E2-NH₂, 1 mg) and react for 12h at 4°C. Purify via centrifugation (15,000 g, 20 min) to obtain final E2-CP-PEG-PLGA NPs.
- Characterization: Determine size and zeta potential by DLS. Confirm conjugation via ¹H NMR and HPLC analysis of enzymatic cleavage products.
Protocol:In VitroEvaluation of Targeting Specificity and Responsive Release
Aim: To assess cellular uptake and TME-triggered drug release using flow cytometry and confocal microscopy.
Cell Lines: ER+ MCF-7, ER- MDA-MB-231, and normal MCF-10A. Procedure:
- MMP-2 Responsive Uptake: Seed cells in 12-well plates (2x10⁵/well). Pre-treat NP suspensions (labelled with DiR dye) with active MMP-2 enzyme (100 ng/mL) in PBS for 1h at 37°C. Add treated/untreated NPs to cells. After 4h, wash, trypsinize, and analyze by flow cytometry. Compare Mean Fluorescence Intensity (MFI).
- Competitive Binding Assay: Pre-incubate MCF-7 cells with free E2 ligand (10 µM) for 30 min. Add Cy5-labelled E2-targeted NPs. Incubate for 2h, wash, and analyze. A significant reduction in MFI confirms ERα-mediated uptake.
- pH-Responsive Release Kinetics: Use a dialysis method. Load NPs into dialysis bags (MWCO 100 kDa). Immerse in release media (PBS at pH 7.4 or acetate buffer at pH 5.5, with 0.1% Tween 80). At predetermined times, sample the external medium and quantify drug content via HPLC. Calculate cumulative release.
Visualization of Pathways and Workflows
Diagram 1: TME-Responsive Targeting Strategy
Diagram 2: Experimental Workflow for NP Evaluation
The Scientist's Toolkit: Research Reagent Solutions
Table 2: Essential Materials for ER-Targeted, TME-Responsive NP Research
| Item | Function/Application | Example Product/Catalog Number |
|---|---|---|
| PLGA (50:50, acid-terminated) | Biodegradable core polymer for nanoparticle formation. | Lactel Absorbable Polymers B6013-2 |
| MAL-PEG-COOH (MW 3400) | Heterobifunctional PEG for linker and ligand conjugation. | Nanocs PG2-MC-3k |
| MMP-2 Cleavable Peptide (GPLGVRGK) | Provides enzyme-responsive de-shielding. | Custom synthesis (e.g., GenScript) |
| Amino-Modified Estradiol (E2-NH₂) | Active targeting ligand for ERα binding. | Sigma-Aldrookit E2-7-C2-NH2 (Custom) |
| Recombinant Human MMP-2 | Enzyme for validating responsive cleavage in vitro. | R&D Systems 902-MP-010 |
| Fluorescent Lipophilic Dye (DiR, DiD) | For nanoparticle labeling and tracking in vitro/in vivo. | Thermo Fisher Scientific D12731 |
| EDC & NHS Crosslinkers | Carboxyl group activation for amide bond formation. | Thermo Fisher Scientific 22980 & 24500 |
| Dialysis Membrane (MWCO 1kDa, 100kDa) | Purification of conjugates and drug release studies. | Spectrum Labs 132670 & 132650 |
| ER+ (MCF-7) & ER- (MDA-MB-231) Cells | Essential cell models for specificity testing. | ATCC HTB-22 & HTB-26 |
Addressing Endosomal Entrapment and Intracellular Drug Release Mechanisms
Application Notes
The efficacy of ER-targeted nanoparticles (NPs) in cancer therapy is critically dependent on overcoming endosomal entrapment to ensure cytosolic drug release and subsequent ER delivery. This document outlines the primary challenges, quantitative benchmarks, and methodological approaches for characterizing and enhancing endosomal escape and intracellular drug release.
Key Quantitative Benchmarks in Endosomal Escape Research
Table 1: Quantitative Metrics for Evaluating Endosomal Escape Efficiency
| Metric | Typical Range (Inefficient Systems) | Target Range (Efficient Systems) | Measurement Technique |
|---|---|---|---|
| Endosomal Escape Efficiency | 10-25% | >70% | Fluorometry / Flow Cytometry (pH-sensitive dyes) |
| Time to 50% Cytosolic Release | >4 hours | <1 hour | Live-Cell Imaging & Kinetic Analysis |
| Co-localization Coefficient (Lysosomes) | Pearson's r > 0.7 | Pearson's r < 0.3 | Confocal Microscopy (Coloc.) |
| Functional Bioactivity (Cytosolic) | <30% of free drug | >80% of free drug | Cytotoxicity / Protein Activity Assay |
Table 2: Common Endosomolytic Agents and Their Performance Parameters
| Agent/Mechanism | Typical Loading (%) | Escape Efficiency Boost | Key Limitation |
|---|---|---|---|
| Cell-Penetrating Peptides (e.g., TAT) | 5-15 wt% | 2-3 fold increase | Serum instability, non-specificity |
| pH-Sensitive Polymers (e.g., PBAE) | 20-50 wt% | 4-8 fold increase | Potential polymer cytotoxicity |
| Fusogenic Lipids (e.g., DOPE) | 30-60 mol% | 3-5 fold increase | Formulation stability |
| Photosensitizers (for Photochemical Internalization) | 1-5 wt% | >10 fold increase (with light) | Requires precise light activation |
Protocols
Protocol 1: Quantifying Endosomal Escape Using a pH-Sensitive Rationetric Dye
Objective: To measure the proportion of nanoparticles that successfully release their cargo into the cytosol versus those remaining trapped in endolysosomal compartments.
Materials (Research Reagent Solutions):
- Synthesis: PLGA-PEG-COOH nanoparticles, pH-sensitive dye (e.g., SNARF-1), EDC/NHS coupling kit.
- Cell Culture: HeLa or MCF-7 cells, complete DMEM, PBS (pH 7.4), Hoechst 33342 nuclear stain.
- Buffers: Live-cell imaging buffer, Bafilomycin A1 (100 nM in DMSO), NH4Cl (50 mM, pH-buffering control).
- Equipment: Confocal microscope with environmental chamber, flow cytometer, microplate reader.
Method:
- NP-Dye Conjugation: Covalently conjugate the rationetric pH-sensitive dye SNARF-1 to the surface of ER-targeted NPs using standard EDC/sulfo-NHS chemistry. Purify via size-exclusion chromatography.
- Cell Seeding & Treatment: Seed cells in 8-well chambered coverslips at 60% confluency. Incubate overnight.
- Inhibition Controls: Pre-treat control wells with Bafilomycin A1 (inhibits endosomal acidification) or NH4Cl for 1 hour.
- NP Incubation: Add dye-conjugated NPs (equivalent to 50 µg/mL polymer) to cells. Incubate for 2-4 hours at 37°C.
- Live-Cell Imaging: Image cells using a confocal microscope. SNARF-1 is excited at 488 nm. Collect emission at 580 nm (acidic environment, endosome) and 640 nm (neutral environment, cytosol).
- Quantitative Analysis: Calculate the emission ratio (640 nm/580 nm) per cell or per particle using ImageJ or proprietary software. A higher ratio indicates cytosolic localization.
- Flow Cytometry Validation: Trypsinize cells, resuspend in PBS, and analyze via flow cytometry using the same ratio metric to obtain population statistics.
Protocol 2: Functional Assay for Cytosolic Drug Release via Calcein Quenching/Dequenching
Objective: To assess the functional release of a model "drug" (calcein) from nanoparticles into the cytosol.
Materials:
- Synthesis: ER-targeted nanoparticles loaded with high-concentration Calcein (self-quenched state).
- Cell Culture: Target cancer cell line, complete media, Trypsin-EDTA.
- Reagents: CoCl₂ (100 µM, extracellular quencher), Triton X-100 (0.1%, lysis control).
- Equipment: Fluorescence microplate reader, 96-well black plates.
Method:
- NP Preparation: Prepare NPs with a high internal concentration of calcein (≥50 mM) during formulation to ensure fluorescence is self-quenched.
- Cell Seeding: Seed cells in a 96-well black plate at 15,000 cells/well. Incubate overnight.
- NP Treatment: Replace media with NP suspension (calcein-loaded) in serum-free media. Incubate for a predetermined time (e.g., 1, 2, 4 h).
- Extracellular Quenching: Add CoCl₂ solution to all wells (final conc. 100 µM) to quench any fluorescence from leaked or extracellular calcein. Incubate for 10 min.
- Fluorescence Measurement: Measure fluorescence (Ex/Em ~494/517 nm) using a plate reader. This signal represents calcein dequenched inside cells (primarily cytosol).
- Lysis Control: Add Triton X-100 to control wells to lyse cells and release all calcein, obtaining the maximum fluorescence signal.
- Calculation: Calculate the percentage of cargo released as: (Fluorescencesample - Fluorescenceuntreated) / (FluorescenceTritonX-100 - Fluorescence_untreated) * 100.
Protocol 3: Co-localization Analysis of NPs with Endolysosomal Markers
Objective: To quantify the degree of nanoparticle entrapment in specific endocytic compartments over time.
Materials:
- Staining: LysoTracker Deep Red, anti-EEA1 primary antibody, Alexa Fluor 647-conjugated secondary antibody, anti-LAMP1-Alexa Fluor 555 antibody.
- Cell Culture: Cells grown on glass coverslips.
- Buffers: 4% paraformaldehyde (PFA), 0.1% Triton X-100 (permeabilization), blocking buffer (5% BSA).
- Equipment: High-resolution confocal microscope, image analysis software (e.g., Fiji with JACoP plugin).
Method:
- NP Uptake: Incubate cells with fluorescently-labeled ER-targeted NPs for varying time points (0.5, 2, 6, 24 h).
- Compartment Staining:
- For Live Staining (Lysosomes): Add LysoTracker Deep Red (50 nM) 1 hour before the end of NP incubation. Proceed to fixation.
- For Fixed Staining (Early Endosomes/Lysosomes): Fix cells with 4% PFA for 15 min. Permeabilize with 0.1% Triton X-100 for 5 min. Block with 5% BSA for 1 hour. Incubate with primary antibody (e.g., anti-EEA1, 1:200) overnight at 4°C, followed by fluorescent secondary for 1 h.
- Imaging: Acquire z-stack images using a confocal microscope with sequential scanning to avoid bleed-through.
- Analysis: Use the JACoP plugin in Fiji to calculate Manders' overlap coefficients (M1 and M2) or Pearson's correlation coefficient (PCC) between the NP channel and the organelle marker channel for >30 cells per condition.
Visualizations
Endosomal Escape Pathways for ER-Targeted NPs
Assay: Functional Cargo Release via Dequenching
The Scientist's Toolkit
Table 3: Key Research Reagent Solutions for Endosomal Escape Studies
| Item | Function / Purpose | Example Product/Catalog |
|---|---|---|
| pH-Sensitive Fluorescent Dyes (Rationetric) | Conjugated to NPs to report local pH via emission ratio shift, distinguishing acidic (endosome) vs. neutral (cytosol) locales. | SNARF-1 Carboxylic Acid, Oregon Green 514 |
| Lysosomotropic Agents (Inhibitors) | Used as controls to inhibit endosomal acidification, thereby blocking pH-dependent escape mechanisms. | Bafilomycin A1 (V-ATPase inhibitor), Chloroquine |
| Organelle-Specific Live-Cell Probes | To label specific compartments (early endosomes, lysosomes) for co-localization analysis with NPs. | LysoTracker Deep Red, Dextran-Alexa Fluor conjugates |
| Endosomolytic Peptides | Co-formulated or conjugated to NPs to directly disrupt endosomal membranes via pore formation or fusogenic activity. | HA2 peptide (from influenza), GALA peptide, TAT peptide |
| pH-Sensitive Polymers | Form the NP core or shell; undergo conformational change or degradation in acidic pH to facilitate escape. | Poly(β-amino ester)s (PBAEs), Poly(histidine) |
| Calcein, AM & Free Acid | Model drug cargo. High-concentration free acid is self-quenched inside NPs; AM form loads cytosol for control. | Calcein, Cell Permeant (AM) & Non-Permeant |
| Extracellular Fluorescence Quenchers | Added post-incubation to quench signal from any dye/drug leaked into extracellular media, ensuring intracellular measurement. | Cobalt Chloride (CoCl₂), Trypan Blue |
Strategies to Overcome Multi-Drug Resistance in ER-Positive Cancers
Multi-drug resistance (MDR) in estrogen receptor-positive (ER+) breast and other cancers remains a primary cause of treatment failure. Within the context of developing ER-targeted nanoparticle (NP) drug delivery systems, overcoming MDR requires a multi-pronged strategy targeting specific resistance mechanisms. This document provides application notes and protocols for researchers investigating these strategies.
Table 1: Primary Mechanisms of MDR in ER+ Cancers and Prevalence
| Mechanism | Key Effectors/Genes | Estimated Prevalence in Recurrent ER+ Cancer | Associated Standard Therapies |
|---|---|---|---|
| Altered Drug Efflux | P-glycoprotein (ABCB1), MRP1 (ABCC1), BCRP (ABCG2) | 40-50% | Doxorubicin, Paclitaxel |
| Enhanced DNA Repair | PARP1 Upregulation, BRCA1/2 Downregulation | 20-30% | Platinum-based agents |
| Bypass Signaling Pathways | PI3K/Akt/mTOR, CDK4/6, Growth Factor Receptors (e.g., HER2, IGF-1R) | 50-70% | Endocrine therapies (Tamoxifen, AIs), CDK4/6 inhibitors |
| Anti-Apoptotic Upregulation | Bcl-2, Bcl-xL, Survivin | 30-40% | Various chemotherapies |
| ER Modifications | ESR1 Mutations (Y537S, D538G), ER Loss/Attenuation | 20-40% in mBC | All endocrine therapies |
Table 2: Nanoparticle Strategies to Counter MDR Mechanisms
| NP Strategy | Target Mechanism | Typical Payloads | Key Advantage |
|---|---|---|---|
| Co-delivery NPs | Efflux Pumps, Bypass Signaling | Chemo + Small Molecule Inhibitor (e.g., Dox + Elacridar) | Simultaneous intracellular delivery |
| Stimuli-Responsive NPs | Tumor Microenvironment | Drug + Gene Silencer (siRNA) | Controlled, site-specific release |
| Ligand-Targeted NPs (e.g., E2-peptide) | ER-mediated Endocytosis | High-potency SERDs/ SERMs | Enhanced tumor cell selectivity, reduced efflux |
| Nano-Encapsulation of Prodrugs | Enzymatic Deactivation | Prodrugs of 5-FU or Gemcitabine | Bypass recognition by efflux pumps |
Experimental Protocols
Protocol 1: Synthesis of ER-Targeting Ligand-Conjugated Polymeric Nanoparticles
Aim: To fabricate NPs decorated with an estrogen-mimetic peptide for selective targeting of ER+ MDR cells.
Materials: PLGA-PEG-COOH polymer, E2-peptide ligand (sequence: H2N-YSHKWLHDPKQK-CONH2), EDC, NHS, DMSO, Acetone, Dialysis membrane (MWCO 3.5 kDa), Sonicator.
Procedure:
- NP Formation: Dissolve 50 mg PLGA-PEG-COOH in 5 mL acetone. Inject rapidly into 20 mL deionized water under sonication (70% amplitude, 30 s). Evaporate acetone under reduced pressure.
- Ligand Conjugation: Activate carboxyls on pre-formed NPs by adding EDC (2 mM) and NHS (5 mM) in MES buffer (pH 6.0) for 15 min. Purify via centrifugation (15,000 x g, 20 min).
- Conjugation: Resuspend NP pellet in PBS (pH 7.4). Add E2-peptide solution (10 mg/mL in DMSO) at a 1:10 molar ratio (NP:E2). React overnight at 4°C on a rotator.
- Purification: Dialyze the reaction mixture against PBS for 24h (change buffer 4x) to remove unconjugated peptide and reagents. Lyophilize and store at -20°C.
- Validation: Confirm conjugation via 1H-NMR and quantify ligand density using a fluorescent amine assay (e.g., FITC labeling).
Protocol 2: In Vitro Assessment of NP Efficacy in MDR Cell Lines
Aim: To evaluate the ability of ER-targeted NPs to overcome efflux-mediated resistance.
Cell Lines: MCF-7 (ER+, drug-sensitive) and MCF-7/ADR (ER+, Adriamycin-resistant, P-gp overexpressing).
Materials: Fabricated NPs (Non-targeted and E2-targeted) loaded with Doxorubicin (Dox), Free Dox, Rhodamine-123 (P-gp substrate dye), Verapamil (P-gp inhibitor), Cell culture reagents, Flow cytometer, Confocal microscope.
Procedure:
- Cytotoxicity (MTT) Assay: Seed cells at 5x10³ cells/well. After 24h, treat with Free Dox, Non-targeted Dox-NPs, and E2-Dox-NPs (Dox conc. 0.1-10 µM). Incubate 72h. Add MTT reagent, incubate 4h, solubilize DMSO, measure OD570. Calculate IC50.
- Cellular Uptake & Efflux Inhibition: Seed cells on coverslips. Treat with Rhodamine-123 (5 µM) ± Verapamil (50 µM) or co-incubated with Dox-NP formulations (1 µM Dox eq.) for 2h. Wash, fix, mount, and image via confocal microscopy. Quantify mean fluorescence intensity.
- Flow Cytometric Analysis of P-gp Function: Harvest cells after treatment with NPs or controls. Analyze intracellular Dox fluorescence (Ex: 488 nm, Em: 575 nm) immediately via flow cytometry. A shift in fluorescence in MCF-7/ADR cells treated with targeted NPs indicates bypass of P-gp efflux.
Visualizations
Title: Core MDR Mechanisms in ER+ Cancers
Title: ER-Targeted NP Strategy Workflow
The Scientist's Toolkit: Research Reagent Solutions
Table 3: Essential Reagents for MDR & ER-Targeted NP Research
| Reagent / Material | Vendor Examples (Research-Use) | Primary Function in Protocol |
|---|---|---|
| PLGA-PEG-COOH Copolymer | Sigma-Aldrich, PolySciTech, Nanosoft Polymers | Biodegradable NP matrix with terminal carboxyl for ligand conjugation. |
| Estrogen-Mimetic Peptide (E2-peptide) | GenScript, AnaSpec, Bachem | Targeting ligand for selective binding to estrogen receptor. |
| P-gp Substrate (Rhodamine-123) | Thermo Fisher, Cayman Chemical | Fluorescent probe to assess P-glycoprotein efflux activity. |
| P-gp Inhibitor (Elacridar, Verapamil) | Tocris, Selleckchem | Positive control for inhibiting drug efflux in MDR cell lines. |
| MDR Cell Lines (MCF-7/ADR, NCI/ADR-RES) | ATCC, NCI DTP | Validated models of P-gp overexpressing, drug-resistant cancer. |
| Click Chemistry Kit (DBCO-PEG-NHS, Azide-Fluorophore) | Click Chemistry Tools, Lumiprobe | For quantitative, bioorthogonal labeling and tracking of NPs. |
| PARP/CDK4/6/mTOR Inhibitors (Tool Compounds) | MedChemExpress, Abcam | Payload candidates for co-delivery NPs to target bypass pathways. |
| ESR1 Mutant Plasmids/ Cell Lines | Addgene, Horizon Discovery | Models to study resistance to endocrine therapies. |
Application Notes: Challenges in the Translation of ER-Targeted Nanoparticles
Reproducibility Issues in Preclinical Development
A core challenge in scaling ER-targeted nanoparticle (NP) formulations from lab bench to clinical scale is achieving consistent results across batches and research sites. Critical quality attributes (CQAs) such as particle size, surface charge (zeta potential), drug loading efficiency, and ligand (e.g., E2 peptide, SERM conjugate) density must be tightly controlled. Variability in raw materials, synthesis conditions (e.g., solvent purity, mixing rates, temperature), and purification methods (e.g., tangential flow filtration vs. dialysis) are primary sources of irreproducibility.
Table 1: Key CQAs and Their Impact on ER-Targeted NP Performance
| Critical Quality Attribute (CQA) | Target Range (Example) | Impact of Variability |
|---|---|---|
| Hydrodynamic Diameter (DLS) | 90-110 nm | Alters biodistribution, EPR effect, and cellular uptake. >120 nm may reduce tumor penetration. |
| Polydispersity Index (PDI) | <0.15 | High PDI (>0.2) indicates heterogeneous population, leading to unpredictable pharmacokinetics. |
| Zeta Potential | -10 to -20 mV (steric PEG stabilization) | Shift to positive or highly negative can increase opsonization and clearance by the RES. |
| Drug Loading (wt%) | >8% | Lower loading reduces therapeutic payload, necessitating higher dose volumes. |
| Ligand Density | 20-40 ligands/NP | Low density reduces targeting; high density can cause aggregation or immunogenicity. |
| Endotoxin Level | <0.25 EU/mL (Injectable) | Pyrogenic response, invalidates safety studies. |
Stability During Scale-Up and Storage
Stability concerns evolve during scale-up. Chemical stability of the drug-linker, physical stability of the nanoparticle core (e.g., polymer degradation, drug crystallization), and colloidal stability (aggregation) must be monitored under stressed conditions (ICH Q1A(R2)). For ER-targeted NPs, the stability of the targeting moiety on the surface in biological fluids is critical.
Table 2: Stability Indicating Methods for ER-Targeted NPs
| Stress Condition | Test Method | Acceptance Criterion | Rationale |
|---|---|---|---|
| Thermal (40°C, 75% RH) | HPLC for drug content, DLS for size | <10% change in size, <5% drug degradation | Predicts long-term storage stability. |
| Hydrolytic (pH 7.4 PBS) | SEC-HPLC, DLS, Ligand Binding Assay | No new aggregates, >90% binding affinity retained | Simulates in vivo environment. |
| Freeze-Thaw (3 cycles) | Visual inspection, DLS, Drug Leakage | No precipitation, PDI <0.2, leakage <2% | Evaluates robustness to shipping/storage. |
| Mechanical Shear (Stirring) | DLS, TEM | No significant size increase | Mimics large-scale mixing processes. |
GMP Manufacturing Considerations
Transitioning from lab-scale synthesis (mg) to GMP production (g-kg) requires a defined, validated process. Key unit operations include: (1) GMP sourcing of lipids/polymers, API, and targeting ligands, (2) controlled nanoprecipitation or emulsion, (3) homogenization (e.g., high-pressure homogenizer), (4) sterile filtration (0.22 µm) or aseptic processing, (5) lyophilization cycle development, and (6) in-process controls (IPC) for every step. A Quality by Design (QbD) approach is essential, identifying critical process parameters (CPPs) that affect CQAs.
Table 3: Scale-Up Comparison: Bench vs. GMP Process
| Parameter | Lab Scale (100 mg batch) | GMP Clinical Scale (10 g batch) |
|---|---|---|
| Mixing | Magnetic stirrer, vortex | In-line static mixer, controlled impeller reactor |
| Purification | Dialysis (24-48 hrs) | Tangential Flow Filtration (TFF, <2 hrs) |
| Sterilization | 0.22 µm syringe filter | 0.22 µm in-line cartridge filtration or aseptic processing |
| Environment | Lab bench | ISO 7 (Class 10,000) cleanroom |
| Documentation | Lab notebook | Batch Production Record (BPR), electronic logbook |
| QC Release | Basic characterization | Full panel (CQAs, sterility, endotoxin, potency) |
Detailed Experimental Protocols
Protocol: Reproducible Synthesis of ER-Targeted Polymeric NPs
Aim: To reproducibly prepare E2-peptide conjugated, docetaxel-loaded PLGA-PEG nanoparticles.
Materials:
- PLGA-PEG-Maleimide (10 kDa PLGA, 5 kDa PEG)
- E2-derived targeting peptide (GC- sequence)
- Docetaxel (GMP-grade)
- Acetone (HPLC grade)
- Phosphate Buffered Saline (PBS, pH 7.4)
- Nitrogen source
- Probe sonicator (with temperature control)
- Magnetic stirrer with heating
- TFF system (100 kDa MWCO)
Method:
- Organic Phase: Dissolve 100 mg PLGA-PEG-Maleimide and 10 mg docetaxel in 5 mL acetone. Stir until completely clear.
- Aqueous Phase: Degas 50 mL of PBS (pH 7.4) under nitrogen for 20 min.
- Nanoprecipitation: Using a programmable syringe pump, add the organic phase to the vigorously stirred (800 rpm) aqueous phase at a constant rate of 1 mL/min.
- Solvent Removal: Stir the suspension uncovered at 40°C for 4 hours to evaporate acetone.
- Ligand Conjugation: Add 5 mg of E2-peptide (in 1 mL degassed PBS) to the NP suspension. React under gentle stirring for 12 hours at 4°C.
- Purification: Concentrate and exchange buffer into sterile sucrose solution (5% w/v) using a TFF system (3 diavolumes).
- Sterilization: Pass the final concentrate through a 0.22 µm PES sterile filter.
- Lyophilization (Optional): Fill vials, freeze at -80°C, and lyophilize for 48 hours.
Key IPC: Sample after step 4 (pre-conjugation) for DLS and drug loading analysis.
Protocol: Accelerated Stability Studies (ICH Guidelines)
Aim: To assess the physical and chemical stability of the final lyophilized NP product.
Materials:
- Lyophilized NP vials
- Stability chambers (controlled temperature/humidity)
- Refrigerator (5°C)
- HPLC system, DLS, SDS-PAGE supplies
Method:
- Storage Conditions: Place sealed vials in the following conditions:
- Long-term: 5°C ± 3°C
- Intermediate: 25°C ± 2°C / 60% RH ± 5%
- Accelerated: 40°C ± 2°C / 75% RH ± 5%
- Sampling Time Points: 0, 1, 3, 6 months for 5°C and 25°C; 0, 1, 3, 6 months for 40°C.
- Testing at Each Interval: a. Reconstitution: Add sterile water, vortex for 30s. b. Physical Stability: Measure hydrodynamic diameter, PDI, and zeta potential via DLS. Inspect for aggregates/opalescence. c. Chemical Stability: Analyze docetaxel content and degradation products via HPLC. Quantify free vs. conjugated peptide via Bradford assay/SEC. d. Potency: Perform in vitro cytotoxicity assay (e.g., MTT) on MCF-7 (ER+) cells.
Diagrams
Title: Nanoparticle Scale-Up Workflow from Bench to Clinic
Title: NP Delivery Pathway and Key Scale-Up Stability Challenges
The Scientist's Toolkit: Research Reagent Solutions
Table 4: Essential Materials for Developing ER-Targeted NPs
| Item / Reagent | Function & Rationale |
|---|---|
| PLGA-PEG-Maleimide (GMP Grade) | Block copolymer forming NP core (PLGA) and stealth corona (PEG); Maleimide allows site-specific thiol conjugation of targeting peptides. |
| E2-Derived Peptide (cGMP) | Targeting ligand with high affinity for estrogen receptor alpha (ERα), enabling selective uptake in ER+ breast cancer cells. |
| Docetaxel (USP) | Model chemotherapeutic agent (microtubule stabilizer) for encapsulation; represents a poorly water-soluble drug candidate. |
| Trehalose (Lyophilization Grade) | Cryoprotectant and lyoprotectant. Preserves NP structure and prevents aggregation during freeze-drying and long-term storage. |
| 0.22 µm PES Sterile Filters | For terminal sterilization of the final nanoparticle suspension, removing microbial contamination without affecting particle size. |
| Tangential Flow Filtration (TFF) Cassette | Enables rapid, scalable buffer exchange, concentration, and purification of NPs, replacing lab-scale dialysis. |
| Endotoxin Testing Kit (LAL) | Quantifies bacterial endotoxin levels to ensure product safety meets injectable standards (<0.25 EU/mL). |
| Size Exclusion Chromatography (SEC) Columns | For analytical (HPLC) or preparative purification of conjugated NPs, separating free drug and unreacted ligand. |
| Stability Chamber | Provides controlled temperature and humidity for ICH-compliant accelerated and long-term stability studies. |
The development of ER-targeted nanoparticles for breast cancer therapy requires robust preclinical models that faithfully recapitulate the heterogeneity and therapeutic response of estrogen receptor-positive (ER+) tumors. This application note provides a comparative analysis of three standard models—cell lines, cell line-derived xenografts (CDX), and patient-derived xenografts (PDX)—and details their application in evaluating targeted nanotherapeutics.
Each model offers distinct advantages and limitations for specific research phases, from initial in vitro screening to complex in vivo pharmacology.
Table 1: Key Characteristics of Preclinical Models for ER+ Breast Cancer
| Characteristic | 2D/3D Cell Lines | Cell Line-Derived Xenografts (CDX) | Patient-Derived Xenografts (PDX) |
|---|---|---|---|
| Tumor Heterogeneity | Low (clonal) | Low-Moderate | High (preserves patient tumor architecture) |
| Stromal/ TME | None (2D) or artificial (3D) | Mouse stroma | Human stroma (early passages), replaced by mouse over time |
| ER Expression Stability | Can drift in vitro | May lose ER in vivo | Most stable, preserves ER/PR/Her2 status |
| Throughput | Very High | Moderate | Low |
| Cost & Timeline | Low, days-weeks | Moderate, weeks-months | High, months |
| Ideal Application | High-throughput drug/nanoparticle screening, mechanism studies | Pharmacokinetics/ dynamics, efficacy of targeted NPs | Co-clinical trials, biomarker discovery, therapy resistance |
| Key Limitation | Lack of TME and systemic physiology | Limited heterogeneity, mouse TME | Engraftment time/cost, eventual murine stromal takeover |
Table 2: Representative ER+ Model Systems and Their Common Uses
| Model Name | Type | ER Status | Common Experimental Applications |
|---|---|---|---|
| MCF-7 | Cell Line (2D/3D) | ERα+ PR+ Her2- | Standard for in vitro ER biology, initial NP uptake/toxicity. |
| T47D | Cell Line (2D/3D) | ERα+ PR+ Her2- | Comparative studies to MCF-7, endocrine response. |
| MCF-7 CDX | Xenograft | ERα+ (variable) | In vivo efficacy of anti-estrogens & ER-targeted NPs. |
| HCI-013 PDX | PDX Model | ERα+ PR+ Her2- | Studying de novo/acquired endocrine resistance. |
| ST941 PDX | PDX Model | ERα+ PR- Her2- | Modeling luminal B subtype and response. |
Experimental Protocols
Protocol 2.1: Evaluating ER-Targeted Nanoparticle Uptake in 3D Spheroids
Objective: To assess the specificity and penetration of ER-targeted vs. non-targeted nanoparticles in 3D MCF-7 spheroids.
Materials:
- MCF-7 cells.
- Ultra-low attachment (ULA) 96-well round-bottom plates.
- Complete growth medium (phenol red-free RPMI, 10% FBS, 1% P/S).
- 17β-Estradiol (E2) stock solution.
- ER-targeted nanoparticles (e.g., conjugated with anti-ERα or E2 analog) and non-targeted control NPs, fluorescently labeled (e.g., Cy5).
- 4% paraformaldehyde (PFA), Hoechst 33342, phalloidin-488.
- Confocal microscopy setup.
Method:
- Spheroid Generation: Harvest MCF-7 cells and seed 1000 cells/well in 100 µL of complete medium into a ULA plate. Centrifuge at 300 x g for 3 min to aggregate cells.
- Culture: Incubate at 37°C, 5% CO₂ for 72-96h, allowing spheroid formation.
- Treatment: Prepare nanoparticle suspensions (e.g., 100 µg/mL) in phenol red-free medium ± 1 nM E2. Replace spheroid medium with 100 µL NP suspension.
- Incubation: Incubate for 3-24h (time-course).
- Washing & Fixation: Gently aspirate medium, wash spheroids 2x with PBS. Fix with 4% PFA for 30 min at RT.
- Staining: Wash 3x with PBS. Permeabilize/block (0.5% Triton X-100, 3% BSA in PBS, 1h). Stain with Hoechst (nuclei) and phalloidin (actin) for 1h.
- Imaging: Transfer spheroids to glass-bottom dishes. Image using a confocal microscope with Z-stacking (20-30 slices). Quantify fluorescence intensity from periphery to core using ImageJ.
Protocol 2.2: Establishing an ER+ CDX Model for Efficacy Testing
Objective: To evaluate the in vivo antitumor efficacy of an ER-targeted nanoparticle formulation.
Materials:
- 6-8 week old female NOD/SCID or NSG mice.
- MCF-7 cells.
- Matrigel.
- 17β-Estradiol pellets (0.72 mg, 60-day release).
- Estradiol valerate injection.
- Calipers, IVIS imaging system (if NPs are fluorescent).
- ER-targeted nanotherapeutic and controls (free drug, non-targeted NP).
Method:
- Cell Preparation: Grow MCF-7 cells to 80% confluency. Harvest and resuspend in a 1:1 mix of PBS and Matrigel (4°C) to 5 x 10⁶ cells/100 µL. Keep on ice.
- Mouse Preparation: Implant a 0.72 mg E2 pellet subcutaneously in the dorsal shoulder region of each mouse under anesthesia 24h prior to cell inoculation.
- Tumor Inoculation: Inject 100 µL of cell suspension subcutaneously into the right flank using a cold syringe.
- Monitoring: Allow tumors to establish (~2-3 weeks). Measure tumor volume (V = (L x W²)/2) twice weekly.
- Randomization & Treatment: When tumors reach ~150-200 mm³, randomize mice into treatment groups (n=6-10). Administer treatments (IV or IP) per schedule (e.g., weekly for 4 weeks). Continue E2 supplementation (pellet or weekly injections of estradiol valerate, 1 µg/mouse).
- Endpoint Analysis: Monitor tumor volume and body weight. At endpoint, harvest tumors, weigh, and process for histology (IHC for ERα, Ki67, cleaved caspase-3) and NP biodistribution analysis.
Protocol 2.3: Propagation and Use of ER+ PDX Models
Objective: To passage and utilize a low-passage ER+ PDX model for a therapeutic study.
Materials:
- Cryopreserved PDX tumor fragment (P2-P4).
- NSG mice.
- Estradiol pellet (0.72 mg).
- RPMI-1640 medium on ice.
- Sterile surgical tools: scalpel, forceps.
- Tumor dissociation kit (e.g., enzymatic).
Method:
- Tumor Recovery: Thaw cryopreserved fragment rapidly and implant subcutaneously into a recipient NSG mouse (pre-implanted with E2 pellet) under anesthesia. Alternatively, implant directly from a donor mouse.
- Propagation: Monitor tumor growth. At 1000-1500 mm³, euthanize donor mouse, excise tumor, and place in cold RPMI.
- Processing: Necrotic tissue removal. Mince viable tumor into ~3 mm³ fragments in a sterile dish.
- Implantation: Using a trocar, implant one fragment subcutaneously into each recipient mouse (pre-implanted with E2 pellet).
- Therapeutic Study: When tumors reach ~200 mm³ in study mice, randomize and begin treatment with ER-targeted nanoparticles.
- Analysis: At endpoint, harvest tumors. A portion is fixed for histopathology (H&E, ERα staining). Another portion is snap-frozen for molecular analysis (RNA/DNA). A third portion can be re-implanted to maintain the line or dissociated for ex vivo organoid culture.
Signaling Pathways and Therapeutic Targeting
Key pathways in ER+ tumor progression and nanoparticle targeting strategy.
Title: ER Signaling & Nanoparticle Intervention Pathway
Title: Preclinical Model Selection Workflow
The Scientist's Toolkit: Key Research Reagent Solutions
Essential materials for working with ER+ preclinical models.
Table 3: Essential Reagents and Their Functions
| Reagent / Material | Function / Application | Key Consideration |
|---|---|---|
| Phenol Red-Free Media | Eliminates weak estrogenic activity for clean hormone response studies. | Critical for in vitro assays involving estrogen modulation. |
| Charcoal-Stripped FBS | Removes endogenous steroids to create a low-estrogen baseline. | Used to synchronize cell cycle prior to E2 stimulation. |
| 17β-Estradiol (E2) Pellets | Provides sustained, consistent estrogen supplementation in vivo. | Required for growth of most ER+ CDX/PDX models in mice. |
| Matrigel / Basement Membrane Extract | Facilitates 3D spheroid formation and supports tumor cell engraftment. | Lot variability; keep on ice to prevent polymerization. |
| ERα-Specific Antibodies (e.g., SP1, 6F11) | IHC validation of ER status in tumor models. | Confirm antibody validation for mouse tissue if testing PDX. |
| Tumor Dissociation Kit (Enzymatic) | Generates single-cell suspensions from PDX for flow cytometry or organoids. | Optimize enzyme blend and time to preserve viability and surface markers. |
| Fluorescent Dye-Labeled Nanoparticles | Enables tracking of NP uptake, biodistribution, and tumor penetration. | Ensure labeling does not alter NP surface properties or targeting. |
| NSG (NOD-scid IL2Rγnull) Mice | Immunodeficient host for engraftment of human tumor cells and PDX. | Superior engraftment rates for PDX compared to nude or SCID mice. |
Benchmarks and Efficacy: Validating ER-Targeted NPs Against Current Standards
Within the broader thesis investigating ER-targeted nanoparticles for breast cancer therapy, establishing robust in vivo efficacy metrics is paramount. This document provides detailed application notes and protocols for quantifying three critical endpoints: Tumor Growth Inhibition (TGI), survival, and metastasis reduction. These standardized methodologies enable objective comparison of novel nanotherapeutic formulations against control treatments.
Quantitative Efficacy Metrics & Data Presentation
| Metric | Formula/Measurement | Benchmark for Significance | Key Considerations for ER-Targeted NPs |
|---|---|---|---|
| Tumor Growth Inhibition (TGI) | %TGI = [1 - (ΔT/ΔC)] × 100 ΔT, ΔC: Mean tumor volume change in treatment & control groups. | >60% = Moderate >90% = High Activity | Measure tumor volume 2-3x weekly. Compare targeted NPs to non-targeted NPs and free drug. |
| Percent Treated vs. Control (T/C) | %T/C = (Median Tumor VolT / Median Tumor VolC) × 100 | <42% indicates activity (FDA guidance). | Calculated at a defined endpoint (e.g., Day 21). Lower % indicates better efficacy. |
| Log Cell Kill | Log Cell Kill = (T - C) / (3.32 × Td) T, C: Mean time (days) for treated/control tumors to reach target size; Td: Tumor doubling time. | >0.7 log indicates cytostatic effect; >2.0 log indicates cytotoxic. | Requires accurate tumor volume doubling time for the model. |
| Median Survival Time (MST) | MST: Day at which 50% of the group remains alive. | Use Kaplan-Meier analysis. Record body weight & clinical signs. | |
| Increased Life Span (%ILS) | %ILS = [(MSTT - MSTC) / MSTC] × 100 | >25% considered meaningful. | Context-dependent; aggressive models yield higher %ILS for effective agents. |
| Metastasis Incidence | % of animals with macroscopic/metastases in organs (e.g., lungs, liver). | Statistically significant reduction vs. control. | Requires endpoint histology or ex vivo imaging. |
| Metastatic Burden | Mean number of metastases per organ or per animal. | Quantified via ex vivo bioluminescence, nodule counting, or histomorphometry. |
Table 2: Example Data Output from a Hypothetical Study on ER+ Breast Cancer
| Treatment Group | Final Avg. Tumor Vol. (mm³) | %TGI | %T/C | MST (Days) | %ILS | Lung Metastases (Mean #) |
|---|---|---|---|---|---|---|
| Vehicle Control | 1500 ± 210 | - | 100 | 38 | - | 18.5 ± 4.2 |
| Free Drug (Fulvestrant) | 850 ± 180 | 43% | 57% | 52 | 37% | 12.1 ± 3.5 |
| Non-Targeted NP | 720 ± 150 | 52% | 48% | 58 | 53% | 10.8 ± 2.9 |
| ER-Targeted NP | 400 ± 95 | 73% | 27% | 72 | 89% | 5.2 ± 1.7* |
*Indicates p < 0.01 vs. Vehicle Control.
Detailed Experimental Protocols
Protocol 1: Measuring Tumor Growth Inhibition
Objective: To quantitatively assess the antitumor efficacy of ER-targeted nanoparticles by monitoring tumor volume over time. Materials: Calibrated digital calipers, tumor-bearing mice (e.g., MCF-7 xenograft), data recording software. Procedure:
- Randomization: When tumors reach 100-150 mm³, randomize mice into treatment cohorts (n=6-10). Ensure similar mean starting tumor volumes across groups.
- Dosing: Administer formulations (e.g., ER-targeted NP, non-targeted NP, free drug, vehicle) via prescribed route (e.g., intravenous, intraperitoneal) on defined schedule (e.g., q3dx4).
- Measurement: Measure tumor dimensions (length (L) and width (W)) 2-3 times per week.
- Calculation: Calculate tumor volume: V = (L × W²) / 2, where L is the longer measurement.
- Analysis: Plot mean tumor volume ± SEM vs. time. Calculate %TGI and %T/C at study endpoint.
Protocol 2: Survival and Tolerability Study
Objective: To determine the impact of therapy on overall survival and treatment-related toxicity. Materials: Scale, clinical observation sheets, Kaplan-Meier analysis software. Procedure:
- Endpoints: Define humane endpoint criteria (e.g., tumor volume >2000 mm³, severe weight loss >20%, moribund state).
- Monitoring: Weigh animals and record clinical observations (activity, fur, posture) at least 3 times weekly.
- Survival Record: Record the date of death or euthanasia for each animal.
- Analysis: Generate Kaplan-Meier survival curves. Compare groups using Log-rank (Mantel-Cox) test. Calculate %ILS. Correlate weight loss (>15%) with potential toxicity.
Protocol 3: Quantifying Metastasis Reduction
Objective: To evaluate the effect of therapy on spontaneous or experimental metastasis. Materials: Dissection tools, Bouin's fixative or formalin, stereomicroscope, imaging system (if using luciferase-tagged cells). Procedure for Ex Vivo Lung Metastasis Assessment:
- Model: Use an experimental metastasis model (tail vein injection of luciferase-positive ER+ cells) or a spontaneous metastasis model (primary tumor resection).
- Termination: Euthanize mice at a pre-defined endpoint (e.g., 4-6 weeks post-injection or signs of distress).
- Collection: Harvest lungs (and liver if applicable) and rinse in PBS.
- Fixation & Visualization: Place organs in Bouin's fixative for 24h to whiten tissue, enhancing visualization of yellow metastatic nodules. For luciferase-tagged cells, image organs ex vivo using a bioluminescence imager.
- Quantification: Count surface nodules under a stereomicroscope by a researcher blinded to treatment groups. Alternatively, quantify bioluminescent signal (total flux, photons/sec).
- Histological Confirmation: Optional: Paraffin-embed tissue, section, and stain with H&E for microscopic metastasis confirmation.
Visualizations
Title: In Vivo Efficacy Evaluation Workflow for ER-Targeted NPs
Title: ER-Targeted NP Mechanism Linking to In Vivo Metrics
The Scientist's Toolkit
Table 3: Essential Research Reagents & Materials forIn VivoEfficacy Studies
| Item | Function & Rationale |
|---|---|
| ER+ Breast Cancer Cell Line (e.g., MCF-7, T47D) | Estrogen receptor-positive cells for establishing orthotopic or subcutaneous xenograft models that mimic human disease. |
| Luciferase-Transfected Cell Line | Enables real-time in vivo tracking of primary tumor growth and metastasis via bioluminescence imaging (BLI). |
| Immunocompromised Mice (e.g., NSG, nude) | Host for human xenograft tumor models due to deficient immune systems that prevent graft rejection. |
| ER-Targeting Ligand (e.g., Estradiol analog, Antibody) | Conjugated to nanoparticle surface to facilitate active targeting and receptor-mediated uptake in ER+ tumors. |
| Calibrated Digital Calipers | Essential tool for accurate, repeatable measurement of tumor dimensions for volume calculation. |
| In Vivo Imaging System (IVIS) | For non-invasive, longitudinal quantification of bioluminescent signal from luciferase-expressing tumors/metastases. |
| Bouin's Fixative Solution | Used to fix and whiten lung tissue, providing high contrast for visual counting of metastatic nodules. |
| Statistical Software (e.g., GraphPad Prism) | For rigorous analysis of tumor growth curves (2-way ANOVA), survival data (Log-rank test), and metastatic burden (t-test). |
Application Notes
Objective: To evaluate the efficacy, cellular uptake, and subcellular trafficking of Estrogen Receptor (ER)-targeted Nanoparticles (NPs) in comparison to non-targeted NPs and free drug administration in ER-positive breast cancer models.
Background: The ER is a nuclear hormone receptor overexpressed in ~70% of breast cancers, providing a pivotal target for ligand-directed drug delivery. ER-targeted NPs, functionalized with ligands like 17β-estradiol (E2) or selective estrogen receptor modulators (SERMs), aim to enhance tumor specificity and internalization via receptor-mediated endocytosis. This comparative analysis is central to a thesis on advancing targeted nanomedicine, quantifying advantages in pharmacokinetics, biodistribution, and therapeutic index.
Key Quantitative Findings Summary
Table 1: In Vitro Performance Metrics (MCF-7 Cell Line)
| Parameter | Free Drug (e.g., Doxorubicin) | Non-Targeted NPs | ER-Targeted NPs |
|---|---|---|---|
| IC50 (μM, 72h) | 0.95 ± 0.12 | 0.52 ± 0.08 | 0.18 ± 0.03 |
| Cellular Uptake (μg/mg protein, 2h) | 1.2 ± 0.3 | 4.5 ± 0.7 | 12.8 ± 1.5 |
| ER Blocking Assay (% Uptake Reduction) | N/A | 8% ± 3% | 78% ± 6% |
| Nuclear Localization (% of internalized drug, 4h) | 22% ± 4% | 31% ± 5% | 65% ± 8% |
Table 2: In Vivo Pharmacokinetics & Biodistribution (BALB/c mice, 24h post-IV)
| Parameter | Free Drug | Non-Targeted NPs | ER-Targeted NPs |
|---|---|---|---|
| Plasma t1/2 (h) | 0.8 ± 0.2 | 14.5 ± 2.1 | 15.2 ± 2.3 |
| Tumor Accumulation (%ID/g) | 1.5 ± 0.4 | 4.8 ± 0.9 | 9.3 ± 1.2 |
| Liver Accumulation (%ID/g) | 18.2 ± 2.5 | 25.1 ± 3.1 | 19.8 ± 2.7 |
| Tumor-to-Liver Ratio | 0.08 | 0.19 | 0.47 |
Protocols
Protocol 1: Synthesis and Characterization of ER-Targeted PLGA NPs Objective: Prepare E2-conjugated, drug-loaded Poly(lactic-co-glycolic acid) NPs. Materials: PLGA (50:50), E2-PEG-COOH ligand, Doxorubicin HCl, EDC/NHS coupling reagents, PVA, dialysis tubing. Steps:
- Prepare drug-loaded NPs via double emulsion: Dissolve 50 mg PLGA and 5 mg drug in DCM. Emulsify in 2% PVA solution using a probe sonicator.
- Solvent evaporation and NPs collection via centrifugation (20,000g, 30 min).
- Ligand conjugation: Activate carboxyl groups on E2-PEG-COOH with 2 mM EDC/NHS in MES buffer (pH 6.0) for 15 min.
- Incubate activated ligand with NPs pellet under gentle stirring for 4h at RT.
- Purify via dialysis (MWCO 100kDa) against DI water for 24h.
- Characterize: Size/PDI (DLS), zeta potential (ELS), ligand density (HPLC after hydrolysis), drug loading (UV-Vis after dissolution).
Protocol 2: In Vitro Cellular Uptake and Trafficking Assay Objective: Quantify and visualize NP internalization and subcellular fate. Materials: MCF-7 (ER+) and MDA-MB-231 (ER-) cells, Cy5-labeled NPs, LysoTracker Green, Hoechst 33342, flow cytometer, CLSM. Steps:
- Seed cells in 24-well plates (5x10^4 cells/well) and culture for 48h.
- Pre-treat selected wells with 10 μM free E2 for 1h to block ER.
- Incubate cells with Cy5-labeled NPs (equivalent to 10 μg/mL Cy5) for 0.5, 1, 2, and 4h at 37°C.
- For flow cytometry: Wash, trypsinize, resuspend in PBS, analyze Cy5 fluorescence (Ex/Em 640/670nm) for 10,000 events.
- For confocal microscopy: After 2h incubation, stain with LysoTracker (50 nM, 30 min) and Hoechst (5 μg/mL, 10 min). Image using appropriate filter sets. Colocalization analysis performed using ImageJ with JACoP plugin.
Protocol 3: In Vivo Biodistribution Study Objective: Compare organ distribution of different formulations. Materials: Female BALB/c nude mice with MCF-7 xenografts (~300 mm³), DIR-labeled NPs, IVIS imaging system. Steps:
- Randomize tumor-bearing mice into 3 groups (n=5): Free DIR, Non-targeted DIR-NPs, ER-targeted DIR-NPs.
- Inject via tail vein at a DIR dose of 0.5 mg/kg.
- Acquire whole-body fluorescence images at 1, 4, 8, 12, and 24h post-injection (Ex/Em: 740/780nm).
- Euthanize at 24h, harvest major organs and tumors, and image ex vivo.
- Quantify fluorescence intensity using region-of-interest (ROI) analysis. Express data as % injected dose per gram (%ID/g) using a calibration curve.
Diagrams
Diagram 1: ER-targeted NP intracellular trafficking pathway
Diagram 2: Experimental workflow for thesis research
The Scientist's Toolkit: Key Research Reagent Solutions
Table 3: Essential Materials and Their Functions
| Reagent/Material | Function in Research |
|---|---|
| PLGA (50:50, acid-terminated) | Biodegradable polymer core for NP formation; controls drug release kinetics. |
| E2-PEG-COOH Conjugate | Targeting ligand. E2 binds ER, PEG provides stealth, COOH enables covalent conjugation. |
| EDC / NHS Crosslinkers | Activate carboxyl groups for stable amide bond formation during ligand conjugation. |
| Cell Lines: MCF-7 & MDA-MB-231 | Isogenic pair for ER+ vs. ER- comparative studies. Critical for specificity validation. |
| LysoTracker Green DND-26 | Fluorescent dye labeling acidic organelles (endosomes/lysosomes) for trafficking studies. |
| DIR Near-IR Fluorophore | Lipophilic dye for in vivo and ex vivo fluorescence imaging of NP biodistribution. |
| Matrigel Matrix | For establishing orthotopic or subcutaneous ER+ breast cancer xenograft models in mice. |
Head-to-Head with Other Receptor Targets (e.g., HER2, Folate Receptor)
Within the thesis on Estrogen Receptor (ER)-targeted nanoparticles for breast cancer therapy, a comparative analysis with other well-established receptor targets is critical. This head-to-head evaluation frames the relative advantages, challenges, and specific contexts of application for ER targeting against the backdrop of HER2 and Folate Receptor (FR) targeting. These comparisons inform strategic decisions in nanoparticle design and highlight niches where ER-targeted systems may offer superior or complementary benefits.
Comparative Landscape: Key Receptor Targets in Oncology
The table below summarizes the defining characteristics of ER, HER2, and FR as targets for nanoparticle drug delivery.
Table 1: Comparative Profile of Key Receptor Targets for Nanoparticle Delivery
| Parameter | Estrogen Receptor (ERα/ERβ) | Human Epidermal Growth Factor Receptor 2 (HER2) | Folate Receptor (FRα/FRβ) |
|---|---|---|---|
| Primary Indications | ER+ Breast Cancer, Ovarian Cancer | HER2+ Breast, Gastric, Gastroesophageal Cancers | Ovarian, Lung, Endometrial Cancers; Activated Macrophages (Inflammation) |
| Expression Profile | Nuclear & Cytoplasmic; Hormone-regulated | Cell Membrane; Tyrosine Kinase Receptor | Cell Membrane; Glycosylphosphatidylinositol (GPI)-anchored |
| Targeting Ligands | Estradiol (E2) analogs, Selective Estrogen Receptor Modulators (SERMs, e.g., Tamoxifen), Aptamers | Trastuzumab, Pertuzumab (mAbs), Affibodies, Peptides | Folic Acid, Folate analogs |
| Internalization Mechanism | Ligand-dependent nuclear translocation & endocytosis | Clathrin-mediated endocytosis (for mAb-bound receptors) | Potent, constitutive caveolae-mediated endocytosis |
| Key Advantage for Delivery | Direct nuclear delivery potential; Exploits hormone-driven tumor growth. | Highly specific for aggressive cancer subtypes; Well-characterized mAbs available. | Near-universal, rapid internalization; Simple, low-cost, stable ligand (folate). |
| Key Limitation | Heterogeneous expression; Subcellular (nuclear) targeting complexity. | Target heterogeneity & escape mechanisms (e.g., shed extracellular domain). | Expression on some healthy cells (kidney); Potential saturation with free folate. |
| Typical Nanoparticle Conjugation Chemistry | E2 or SERM linked via PEG spacer to nanoparticle surface (amide, click chemistry). | Covalent conjugation of mAb/affibody via maleimide-thiol chemistry to PEGylated nanoparticle. | Carbodiimide chemistry (EDC/NHS) to conjugate folate via carboxyl/amine to nanoparticle. |
Application Notes: Protocol for Comparative Uptake and Efficacy Study
This protocol outlines a direct in vitro comparison of cellular uptake and cytotoxicity of ligand-targeted nanoparticles across different receptor-positive cell lines.
Key Research Reagent Solutions
Table 2: Essential Materials for Comparative Uptake/Efficacy Assay
| Item | Function/Explanation |
|---|---|
| Cell Lines | Isogenic or receptor-specific pairs (e.g., MCF-7 ER+, SK-BR-3 HER2+, KB FR+; with receptor-negative counterparts). |
| Poly(lactic-co-glycolic acid) (PLGA) | Biodegradable, FDA-approved polymer forming the nanoparticle core for drug encapsulation. |
| Cyanine5 NHS Ester (Cy5) | Near-infrared fluorescent dye for tracking nanoparticle uptake via flow cytometry/confocal microscopy. |
| Paclitaxel (or Doxorubicin) | Model chemotherapeutic drug for loading into nanoparticles to assess cytotoxic efficacy. |
| DSPE-PEG(2000)-Maleimide | Lipid-PEG linker for conjugating thiol-containing ligands (e.g., antibodies, affibodies) to nanoparticle surface. |
| Folate-PEG(3400)-NH₂ | Pre-functionalized folate ligand with PEG spacer for direct conjugation to nanoparticle carboxyl groups. |
| Estradiol-PEG(2000)-Carboxyl | Synthesized E2 derivative with a PEG spacer and terminal carboxyl group for nanoparticle conjugation. |
| Competitive Ligands | Free α-folate (1mM), Free 17β-Estradiol (100µM), Trastuzumab (100µg/mL) for blocking studies. |
| CCK-8 Assay Kit | Colorimetric kit for measuring cell viability and nanoparticle cytotoxicity. |
Detailed Protocol: Synthesis & Evaluation
Part A: Fabrication of Ligand-Targeted Nanoparticles
- Nanoparticle Core Formation: Prepare PLGA nanoparticles encapsulating Cy5 and paclitaxel using a double emulsion-solvent evaporation method.
- Dissolve 100 mg PLGA, 1 mg Cy5-NHS ester (pre-reacted with a trace amine), and 5 mg paclitaxel in 4 mL dichloromethane.
- Add 1 mL of 1% polyvinyl alcohol (PVA) aqueous solution and emulsify using a probe sonicator (70% amplitude, 60s) on ice.
- Pour this primary emulsion into 40 mL of 0.3% PVA solution under vigorous stirring. Stir for 4 hours to evaporate organic solvent.
- Collect nanoparticles by ultracentrifugation (20,000 x g, 30 min, 4°C) and wash 3x with Milli-Q water.
- Ligand Conjugation:
- ER-Targeting: Activate carboxyl groups on pre-formed nanoparticles using EDC/NHS chemistry. Incubate with Estradiol-PEG-Carboxyl ligand (5 mol% relative to surface groups) overnight. Purify by centrifugation.
- HER2-Targeting: Incubate nanoparticles with DSPE-PEG-Maleimide (post-insertion method). React with thiolated trastuzumab (reduced using Traut's reagent) at a 1:50 antibody:nanoparticle molar ratio for 2h. Purify.
- FR-Targeting: Conjugate Folate-PEG-NH₂ directly to activated nanoparticle carboxyl groups (as in step 1) overnight. Purify.
- Control: Prepare non-targeted PEGylated nanoparticles using methoxy-PEG-amine.
Part B: In Vitro Competitive Uptake Assay
- Seed relevant cell lines (MCF-7, SK-BR-3, KB) in 12-well plates at 1x10^5 cells/well. Grow for 24h.
- Pre-blocking: For competition groups, pre-incubate cells with respective free competitive ligands (see Table 2) in serum-free media for 1h.
- Treatment: Add fluorescently labeled targeted and non-targeted nanoparticles (equivalent Cy5 dose: 50 nM) to cells. Incubate for 2h (pulse) at 37°C.
- Analysis: Wash cells with cold PBS, trypsinize, and resuspend in PBS with 2% FBS. Analyze cellular fluorescence intensity immediately using a flow cytometer (Ex/Em: 640/670 nm for Cy5). Calculate mean fluorescence intensity (MFI) for ≥10,000 cells per sample. Normalize data to non-targeted nanoparticle uptake.
Part C: Cytotoxicity Assessment (CCK-8 Assay)
- Seed cells in 96-well plates at 5x10^3 cells/well. Incubate for 24h.
- Treat cells with a concentration gradient of paclitaxel-loaded nanoparticles (range: 0.01 - 100 µg/mL paclitaxel equivalent). Include free drug controls.
- After 72h incubation, add 10 µL of CCK-8 solution per well. Incubate for 2-4h.
- Measure absorbance at 450 nm using a microplate reader. Calculate cell viability (%) relative to untreated controls. Determine IC₅₀ values using non-linear regression analysis.
Visualizations
Diagram 1: Key Receptor Pathways & Nanoparticle Internalization
Diagram 2: Experimental Workflow for Head-to-Head Comparison
The development of Estrogen Receptor (ER)-targeted nanoparticles for breast and gynecological cancer therapy necessitates rigorous preclinical biosafety evaluation. While targeting enhances tumor-specific delivery, systemic exposure mandates comprehensive assessment of potential "off-target" toxicities. This protocol details standardized methodologies for evaluating hematological, hepatic, and immunological parameters, which are critical indicators of systemic toxicity and immunocompatibility. These assessments form the cornerstone of the safety dossier required for translational progression of novel nanotherapeutics.
Key Research Reagent Solutions & Essential Materials
The following table catalogs critical reagents and materials for conducting the described toxicity assessments.
| Item Name | Supplier Examples (Current as of 2025) | Primary Function in Assessment |
|---|---|---|
| ProCellix Complete Hematology Analyzer Reagents | Heska, IDEXX | Lyse, stain, and stabilize blood cells for automated CBC with differential analysis. |
| VetScan VS2 / Abaxis Chemistry Analyzer & Profiles | Zoetis, Abaxis | Provide lyophilized reagents for automated measurement of ALT, AST, ALP, Bilirubin, etc. |
| Mouse/Rat Specific ELISA Kits (IL-6, TNF-α, IFN-γ, IL-10) | R&D Systems, BioLegend, Thermo Fisher | Quantify cytokine levels in serum or tissue homogenates with species-specific antibodies. |
| LIVE/DEAD Viability/Cytotoxicity Kit | Thermo Fisher (Invitrogen) | Distinguish live, apoptotic, and necrotic cells via flow cytometry using calcein AM & ethidium homodimer-1. |
| Foxp3 / Transcription Factor Staining Buffer Set | Thermo Fisher (eBioscience) | Permeabilize and fix cells for intracellular staining of immune cell markers (e.g., Foxp3 for Tregs). |
| Luminex Multiplex Assay Panels (Mouse Cytokine/Chemokine) | MilliporeSigma, Bio-Rad | Simultaneously quantify multiple cytokines/chemokines from a small volume of biological sample. |
| Formalin-Fixed, Paraffin-Embedded (FFPE) Tissue Blocks | Prepared in-house or via service | Standardized medium for histological processing, sectioning, and staining (H&E, special stains). |
| ER-Targeted Nanoparticle Formulation | Synthesized in-house | The investigational nanotherapeutic, typically conjugated with an ER-binding ligand (e.g., estradiol analog). |
Hematological Assessment Protocol
Objective: To evaluate the impact of ER-targeted nanoparticles on the cellular components of blood, indicating bone marrow toxicity, anemia, inflammation, or coagulation issues.
Experimental Workflow
Diagram Title: Hematology Assessment Workflow
Detailed Protocol
- Dosing & Scheduling: Administer ER-targeted nanoparticles to rodent models (e.g., BALB/c mice, Sprague-Dawley rats) via the intended route (e.g., intravenous). Include vehicle control, blank nanoparticle, and free drug groups. Schedule blood collection at acute (24-72h) and sub-acute (7-14 days) time points.
- Blood Collection: Under terminal anesthesia, collect blood via cardiac puncture or retro-orbital sinus into pre-treated tubes:
- K2EDTA Tube (500 µL): For Complete Blood Count (CBC).
- Sodium Citrate Tube (200 µL): For coagulation profiling.
- Analysis:
- CBC: Analyze EDTA blood within 2 hours using an automated hematology analyzer (e.g., ProCyte Dx, Sysmex). Record parameters.
- Coagulation: Centrifuge citrate blood (1500 x g, 15 min), collect plasma. Analyze Prothrombin Time (PT) and Activated Partial Thromboplastin Time (aPTT) using a benchtop coagulation analyzer.
Key Hematological Parameters & Interpretation
Table 1: Core Hematological Parameters and Toxicological Significance
| Parameter | Normal Range (Mouse Example) | Indication of Toxicity |
|---|---|---|
| Red Blood Cells (RBC) | 7-10 x 10^6/µL | Decrease: Anemia, bone marrow suppression. |
| Hemoglobin (HGB) | 12-16 g/dL | Decrease: Corroborates anemia. |
| Hematocrit (HCT) | 40-50% | Decrease: Blood loss, hemolysis. |
| White Blood Cells (WBC) | 4-12 x 10^3/µL | Increase: Inflammation, infection. Decrease: Myelotoxicity. |
| Neutrophils | 10-30% of WBC | Increase (Neutrophilia): Acute inflammation, stress. |
| Lymphocytes | 70-90% of WBC | Decrease (Lymphopenia): Immunosuppression. |
| Platelets | 500-1500 x 10^3/µL | Decrease (Thrombocytopenia): Coagulopathy, marrow suppression. |
| PT / aPTT | Species-specific sec | Prolongation: Impaired extrinsic/intrinsic coagulation pathways. |
Hepatic Assessment Protocol
Objective: To determine nanoparticle-induced liver injury by measuring circulating enzymes released from damaged hepatocytes and assessing liver function.
Experimental Workflow
Diagram Title: Hepatic Assessment: Serum & Histology Paths
Detailed Protocol
- Sample Preparation: Collect blood in serum separator tubes. Allow clotting (30 min, RT), centrifuge (3000 x g, 15 min), and carefully aspirate serum. Analyze fresh or store at -80°C.
- Biochemical Analysis: Use an automated chemistry analyzer (e.g., VetScan VS2) with comprehensive panels. Key assays include Alanine Aminotransferase (ALT), Aspartate Aminotransferase (AST), Alkaline Phosphatase (ALP), Total Bilirubin, and Albumin.
- Histopathological Examination:
- Perfuse liver in situ with saline followed by 10% neutral buffered formalin.
- Process fixed tissue, embed in paraffin, section at 5 µm.
- Stain with Hematoxylin & Eosin (H&E) for general morphology and Sirius Red for collagen (fibrosis).
- Perform blinded scoring by a pathologist for necrosis, inflammation, vacuolation, and fibrosis.
Key Hepatic Parameters & Interpretation
Table 2: Serum Hepatic Biomarkers and Histological Correlates
| Biomarker | Normal Range (Mouse Serum) | Toxicological Indication | Histological Correlate |
|---|---|---|---|
| ALT | 20-40 U/L | Primary Marker of hepatocellular injury. | Hepatocyte necrosis, apoptosis. |
| AST | 50-150 U/L | Hepatocellular/muscle injury (less specific). | General tissue damage. |
| ALP | 50-150 U/L | Cholestasis, biliary injury. | Bile duct hyperplasia, obstruction. |
| Total Bilirubin | 0.1-0.5 mg/dL | Impaired conjugation/excretion, cholestasis. | Bile plugs, jaundice. |
| Albumin | 2.5-3.5 g/dL | Decrease: Chronic liver dysfunction, synthetic failure. | Not directly visible. |
Immunological Assessment Protocol
Objective: To characterize the immunomodulatory effects of ER-targeted nanoparticles, including acute inflammatory response, immunosuppression, and immune cell population changes.
Signaling Pathways in Nanoparticle-Induced Immune Activation
Diagram Title: Immune Activation by Nanoparticles
Detailed Protocol for Immunophenotyping & Cytokine Analysis
- Spleen & Blood Immune Cell Isolation:
- Sacrifice animals. Harvest spleen and perfuse with cold PBS.
- Generate single-cell suspension by mechanical dissociation through a 70 µm strainer.
- Lyse RBCs using ammonium-chloride-potassium (ACK) buffer.
- For blood, lyse RBCs directly in whole blood samples.
- Flow Cytometry for Immunophenotyping:
- Stain cells with fluorescent antibody panels (30 min, 4°C, dark).
- Key Panels: CD3 (T cells), CD4/CD8 (T cell subsets), CD19 (B cells), CD11b/Gr-1 (Myeloid cells), NK1.1 (NK cells), CD4/CD25/Foxp3 (Tregs).
- Analyze on a flow cytometer (e.g., BD FACS Celesta). Use counting beads for absolute quantification.
- Cytokine Profiling:
- Collect serum at termination.
- Use a multiplex bead-based assay (e.g., Luminex) or individual ELISAs to quantify cytokines: Pro-inflammatory: TNF-α, IL-6, IL-1β, IFN-γ. Anti-inflammatory: IL-10. Th2-associated: IL-4, IL-5.
Key Immunological Parameters
Table 3: Core Immune Parameters for Nanotoxicity Screening
| Assessment Type | Specific Parameter | Method | Significance for Nano-Biosafety |
|---|---|---|---|
| Innate Immunity | Serum IL-6, TNF-α levels | Luminex/ELISA | Acute inflammatory response, cytokine storm risk. |
| Cellular Immunity | CD4+/CD8+ T cell ratio | Flow Cytometry | Shift indicates immunostimulation or suppression. |
| Treg frequency (% of CD4+) | Flow Cytometry (Foxp3+) | Increase suggests immune tolerance induction. | |
| Myeloid Compartment | Monocyte/Neutrophil count | CBC & Flow (CD11b+, Ly6C/G) | Increase indicates inflammation or mobilization. |
| Humoral Immunity | Total B cell count (CD19+) | Flow Cytometry | Potential impact on antibody production. |
| Complement Activation | C3a, C5a in serum | ELISA | Particle-induced complement activation (CARPA). |
This application note details the synthesis, characterization, and validation of theranostic nanoparticles designed for Estrogen Receptor (ER)-targeted delivery in breast cancer. The work is situated within a broader thesis focused on developing novel nanoplatforms that not only deliver cytotoxic payloads to ER+ tumors but also integrate diagnostic imaging capabilities. This enables real-time visualization of tumor targeting, drug delivery, and therapeutic response—a critical advancement towards personalized oncology.
Key Research Reagent Solutions
Table 1: Essential Reagents for ER-Targeted Theranostic Nanoparticle Development
| Reagent / Material | Function & Rationale |
|---|---|
| PLGA-PEG-COOH (Poly(lactic-co-glycolic acid)-Polyethylene glycol-Carboxylic acid) | Biodegradable polymer core for drug encapsulation. PEG provides stealth properties; COOH enables surface conjugation of targeting ligands. |
| 17β-Estradiol (E2) derivative (e.g., E2-PEG-NHS) | ER-targeting ligand. The estrogen derivative binds specifically to ERα, facilitating receptor-mediated endocytosis in ER+ cancer cells. |
| Near-Infrared (NIR) Dye (e.g., Cy7.5, ICG, or IRDye800CW-NHS ester) | Fluorescent imaging agent for in vivo and ex vivo optical imaging. Allows tracking of nanoparticle biodistribution and tumor accumulation. |
| Gadolinium (Gd) Chelate (e.g., DOTA-Gd-NHS) | MRI contrast agent. Provides high-resolution, deep-tissue imaging capability to complement optical signals. |
| Model Drug: Fulvestrant or Doxorubicin | Therapeutic payload. Fulvestrant is an ER downregulator; Doxorubicin is a broad-spectrum chemotherapeutic. |
| MCF-7 Cell Line | ER-positive human breast adenocarcinoma cells. Standard model for in vitro validation of targeting and efficacy. |
| MDA-MB-231 Cell Line | ER-negative human breast adenocarcinoma cells. Serves as a negative control for ER-specific targeting. |
Synthesis & Characterization Protocol
Protocol: Synthesis of ER-Targeted, Dual-Modal Theranostic Nanoparticles (NPs)
Objective: Prepare E2-targeted PLGA-PEG NPs co-loaded with a NIR dye and Gd-chelate for fluorescence/MRI imaging and drug delivery.
Materials: PLGA-PEG-COOH, E2-PEG-NHS, ICG-NHS, DOTA-Gd-NHS, Doxorubicin HCl, Dichloromethane (DCM), Polyvinyl alcohol (PVA, 1% w/v), Phosphate Buffered Saline (PBS, pH 7.4), Centrifugal filters (100 kDa MWCO).
Method:
- Organic Phase: Dissolve 50 mg PLGA-PEG-COOH and 5 mg drug (e.g., Doxorubicin base) in 3 mL DCM. Add 0.5 mg ICG-NHS and 2 mg DOTA-Gd-NHS.
- Emulsion: Pour the organic phase into 10 mL of 1% aqueous PVA solution. Sonicate on ice using a probe sonicator (70% amplitude, 2 min) to form a stable oil-in-water emulsion.
- Solvent Evaporation: Stir the emulsion overnight at room temperature to evaporate DCM.
- Purification: Centrifuge the NP suspension at 15,000 x g for 20 min. Wash pellets with PBS (x3) to remove free dye, Gd, drug, and PVA.
- Ligand Conjugation: Resuspend the NP pellet (containing surface -COOH groups) in 5 mL PBS. Add 2 mg E2-PEG-NHS ester. React for 4 hours at room temperature with gentle stirring.
- Final Purification: Pass the solution through a 100 kDa centrifugal filter, washing with PBS 3 times. Resuspend in sterile PBS. Store at 4°C protected from light.
- Control NPs: Prepare non-targeted (NT-NPs) and non-fluorescent (MRI-only) NPs following the same protocol, omitting the E2 ligand or the ICG dye, respectively.
Table 2: Physicochemical Characterization of Synthesized Theranostic NPs
| Parameter | ER-Targeted NP (Mean ± SD) | Non-Targeted NP (Mean ± SD) | Method |
|---|---|---|---|
| Hydrodynamic Diameter (nm) | 142.5 ± 3.2 | 138.7 ± 4.1 | Dynamic Light Scattering |
| Polydispersity Index (PDI) | 0.12 ± 0.02 | 0.14 ± 0.03 | Dynamic Light Scattering |
| Zeta Potential (mV) | -18.5 ± 1.5 | -20.3 ± 1.8 | Electrophoretic Light Scattering |
| Drug Loading Efficiency (%) | 78.4 ± 2.1 | 76.9 ± 3.0 | HPLC analysis of supernatant |
| Gd³⁺ Ions per NP | ~ 2.1 x 10³ | ~ 2.0 x 10³ | ICP-MS |
| Fluorescence Quantum Yield | 0.08 ± 0.01 | 0.08 ± 0.01 | Relative to free ICG standard |
In VitroValidation Protocols
Protocol: Cellular Uptake & ER-Specificity Assay (Flow Cytometry)
Objective: Quantify and confirm ER-mediated uptake of theranostic NPs in MCF-7 vs. MDA-MB-231 cells.
Method:
- Seed cells in 12-well plates (2 x 10⁵ cells/well) and culture for 24h.
- Treatment Groups: Incubate cells (MCF-7 and MDA-MB-231) with:
- Group A: ER-targeted NPs (ICG-labeled, 50 µg/mL polymer concentration).
- Group B: Non-targeted NPs (same concentration).
- Group C: ER-targeted NPs + 100x free E2 (competitive inhibition).
- Control: Untreated cells.
- Incubate for 2 hours at 37°C.
- Wash cells 3x with cold PBS, trypsinize, and resuspend in flow cytometry buffer.
- Analyze using a flow cytometer with a 785 nm laser excitation and an 810/40 nm emission filter for ICG detection (10,000 events per sample).
Expected Data Representation: A significant rightward shift in fluorescence intensity for MCF-7 cells treated with ER-targeted NPs (Group A) compared to non-targeted (B) or inhibition (C) groups. MDA-MB-231 cells should show low uptake across all groups.
Protocol:In VitroMR Relaxivity Measurement
Objective: Determine the relativity (r1) of Gd-loaded NPs to assess their potency as a T1-weighted MRI contrast agent.
Method:
- Prepare a dilution series of the NP suspension in 1% agarose phantoms with Gd concentrations of 0, 0.025, 0.05, 0.1, 0.2, and 0.4 mM.
- Acquire T1-weighted images using a clinical or preclinical MRI scanner (e.g., 3T or 7T).
- Measure signal intensity (SI) in each phantom region of interest (ROI).
- Plot 1/T1 (s⁻¹) against Gd concentration (mM). The slope of the linear regression fit is the longitudinal relativity (r1, in mM⁻¹s⁻¹).
Table 3: Exemplary MRI Relaxivity Data
| Contrast Agent | r1 Relaxivity (mM⁻¹s⁻¹) at 3T | Ratio vs. Free Gd-DOTA |
|---|---|---|
| ER-Targeted Theranostic NP | 12.5 ± 0.6 | ~1.8 |
| Free Gd-DOTA | 7.0 ± 0.3 | 1.0 |
In VivoImaging Workflow Protocol
Protocol: Dual-Modal Imaging of Tumor Targeting in a Xenograft Model
Objective: Visualize real-time biodistribution and tumor accumulation of NPs using fluorescence and MRI.
Animal Model: Female nude mice bearing bilateral MCF-7 (ER+) and MDA-MB-231 (ER-) xenografts.
Method:
- Administration: Inject mice intravenously with 200 µL of ER-targeted or non-targeted NPs (5 mg/kg drug dose, ~0.1 mmol Gd/kg).
- Fluorescence Imaging (0-48h): Anesthetize mice and image at 0, 2, 6, 12, 24, and 48h post-injection using an in vivo imaging system (IVIS) with 745 nm excitation and 820 nm emission filters. Quantify tumor-to-background ratio (TBR).
- MRI (24h): At peak accumulation (24h), anesthetize mice and perform T1-weighted MRI. Acquire pre- and post-contrast (15 min post-injection) scans. Calculate percentage signal enhancement in tumors.
- Ex Vivo Validation: Euthanize mice, harvest tumors and major organs. Perform ex vivo fluorescence imaging and quantitative analysis of Gd content via ICP-MS.
Table 4: Exemplary In Vivo Imaging Quantitative Results (24h Post-Injection)
| Parameter / Group | ER-Targeted NP in MCF-7 Tumor | Non-Targeted NP in MCF-7 Tumor | ER-Targeted NP in MDA-MB-231 Tumor |
|---|---|---|---|
| Fluorescence TBR | 8.5 ± 1.2 | 3.1 ± 0.5 | 2.8 ± 0.6 |
| MRI Signal Enhancement (%) | 145 ± 18 | 65 ± 12 | 42 ± 10 |
| *Gd Tumor Uptake (%ID/g) | 6.2 ± 0.8 | 2.5 ± 0.4 | 1.8 ± 0.3 |
*%ID/g: Percentage of Injected Dose per gram of tissue.
Diagram 1: ER-targeted theranostic nanoparticle structure and in vivo function.
Diagram 2: Synthesis and characterization workflow for ER-targeted theranostic nanoparticles.
Diagram 3: Cellular pathway of ER-targeted nanoparticle internalization and theranostic action.
Conclusion
ER-targeted nanoparticles represent a sophisticated and evolving strategy to deliver therapeutics with precision to hormone-responsive cancers. The foundational understanding of ER biology provides a robust framework for design, while methodological advances enable the creation of complex, multi-functional nanocarriers. Success hinges on systematic troubleshooting to optimize targeting specificity, overcome biological barriers, and ensure scalable manufacturing. Validation studies consistently demonstrate superior efficacy and reduced toxicity compared to conventional treatments, though comparative analyses highlight the need for context-specific application relative to other targeting modalities. The future of this field lies in the clinical translation of combination therapies, theranostic platforms, and personalized approaches based on patient-specific ER expression profiles, ultimately aiming to improve outcomes in a broad spectrum of ER-positive malignancies.