Targeting Cellular Recycling: A Comparative Analysis of UPS Inhibition vs. Autophagy Blockade in Preclinical Cancer Models
This article provides a comprehensive overview for researchers and drug development professionals on two critical proteostasis pathways in oncology: the Ubiquitin-Proteasome System (UPS) and autophagy.
Targeting Cellular Recycling: A Comparative Analysis of UPS Inhibition vs. Autophagy Blockade in Preclinical Cancer Models
Abstract
This article provides a comprehensive overview for researchers and drug development professionals on two critical proteostasis pathways in oncology: the Ubiquitin-Proteasome System (UPS) and autophagy. We explore the foundational biology of each pathway, detailing their roles in tumor cell survival and stress adaptation. The core of the analysis compares established and emerging methodologies for pharmacologically inhibiting these systems in vitro and in vivo, including specific agents, genetic tools, and model selection. We address common experimental challenges, optimization strategies for maximizing therapeutic index, and discuss the synergistic potential of dual pathway inhibition. Finally, we evaluate comparative efficacy, biomarker development, and translational validation across diverse cancer models, synthesizing key insights to guide the rational development of next-generation cancer therapeutics.
Decoding the Targets: Core Biology of UPS and Autophagy in Cancer Cell Survival
This comparison guide is framed within the broader research thesis comparing the therapeutic inhibition of the Ubiquitin-Proteasome System (UPS) versus autophagy in cancer models. While autophagy serves as a complementary, bulk degradation pathway, the UPS is the cell's primary, selective mechanism for controlled protein turnover. This guide objectively compares the performance and consequences of targeting the UPS versus autophagy, providing experimental data to inform cancer therapeutic strategies.
Performance Comparison: UPS Inhibition vs. Autophagy Inhibition in Cancer Models
Table 1: Comparison of Core Degradation Pathways and Inhibition Effects
| Feature | Ubiquitin-Proteasome System (UPS) | Macroautophagy (Primary Autophagic Pathway) |
|---|---|---|
| Primary Role | Rapid, selective degradation of short-lived, misfolded, or regulatory proteins. | Bulk degradation of long-lived proteins, aggregates, and organelles via lysosomes. |
| Key Components | E1/E2/E3 enzymes, polyubiquitin chains, 26S proteasome. | ULK1 complex, autophagy-related (ATG) proteins, LC3, lysosomal hydrolases. |
| Typical Cargo | Cyclins, p53, IκB, misfolded proteins. | Damaged mitochondria, protein aggregates, intracellular pathogens. |
| Inhibition Strategy | Proteasome inhibitors (e.g., Bortezomib). | Lysosomal inhibitors (Chloroquine) or inhibitors of early autophagy (e.g., ULK1/ATG inhibitors). |
| Primary Acute Consequence | Accumulation of proteotoxic stress, cell cycle arrest, ER stress, and apoptosis. | Accumulation of damaged organelles & aggregates, metabolic stress. |
| Adaptive Response | Can induce autophagy as a compensatory survival mechanism. | Can upregulate proteasomal activity and ubiquitination. |
| Clinical Status in Cancer | Validated (Multiple Myeloma, Mantle Cell Lymphoma). | Largely in clinical trials, often in combination. |
Table 2: Experimental Outcomes in Preclinical Cancer Models
| Experimental Model | UPS Inhibition Alone | Autophagy Inhibition Alone | Combined Inhibition | Key Supporting Data |
|---|---|---|---|---|
| Multiple Myeloma | High efficacy; apoptosis induction. | Limited efficacy as monotherapy. | Synergistic cell death; overcomes resistance. | Bortezomib + CQ reduces viability 3-fold vs. single agent. |
| Pancreatic Ductal Adenocarcinoma | Moderate efficacy; transient response. | Can promote tumor growth in some contexts. | Strong synergy; blocks adaptive survival. | Combined treatment increases caspase-3 activity by 400%. |
| Glioblastoma | Variable due to blood-brain barrier. | Cytostatic effects. | Enhanced tumor regression in xenografts. | Tumor volume reduced by 70% with combo vs. 40% (Bortezomib alone). |
| Non-Small Cell Lung Cancer | Activates protective autophagy. | Can increase proteotoxic stress. | Overcomes cross-pathway compensation; synthetic lethality. | Combination increases ubiquitinated protein aggregates by 8-fold. |
Detailed Experimental Protocols
Protocol 1: Assessing Proteasomal Activity & Autophagic Flux Post-Inhibition Objective: To measure the direct effect of UPS inhibition on proteasome activity and the subsequent induction of compensatory autophagy. Key Reagents: Bortezomib (UPS inhibitor), Bafilomycin A1 (Autophagic flux inhibitor), Anti-LC3B antibody, Anti-p62/SQSTM1 antibody, Proteasome-Glo Chymotrypsin-Like Assay. Method:
- Seed cancer cells in 96-well or 6-well plates.
- Treat with a dose range of Bortezomib (e.g., 10-100 nM) for 6-24 hours. Include a control group with Bafilomycin A1 (100 nM, last 2-4 hours) to block autophagosome degradation.
- Proteasome Activity: Lyse cells from 96-well plate. Add Proteasome-Glo reagent containing the chymotrypsin-like substrate (Suc-LLVY-aminoluciferin). Measure luminescence after 10-30 min. Luminescence correlates with proteasomal activity.
- Autophagic Flux Analysis (Western Blot): Lyse cells from 6-well plate. Resolve proteins via SDS-PAGE. Probe for LC3-II (lipidated form, correlates with autophagosome number) and p62 (autophagy substrate). Increased LC3-II in the presence of Bafilomycin A1 indicates increased autophagic flux. Interpretation: Effective UPS inhibition shows decreased luminescence in Step 3 and increased LC3-II accumulation with Bafilomycin A1 in Step 4, confirming autophagy induction.
Protocol 2: Evaluating Synergistic Cell Death in Co-Inhibition Studies Objective: To determine the combinatorial effect of UPS and autophagy inhibition on cancer cell viability and apoptosis. Key Reagents: Bortezomib, Chloroquine (CQ), CellTiter-Glo Luminescent Cell Viability Assay, Annexin V-FITC/PI Apoptosis Detection Kit. Method:
- Seed cells in 96-well plates for viability or 12-well plates for apoptosis.
- Treat with a matrix of Bortezomib (e.g., 0, 5, 10, 20 nM) and Chloroquine (0, 10, 20, 40 µM) for 48 hours.
- Viability Assay: Add CellTiter-Glo reagent to lyse cells and generate luminescent signal proportional to ATP. Measure luminescence. Analyze data using SynergyFinder or CompuSyn software to calculate Combination Index (CI).
- Apoptosis Assay (Flow Cytometry): Harvest cells, stain with Annexin V-FITC and Propidium Iodide (PI) according to kit instructions. Analyze on a flow cytometer. Early apoptotic cells are Annexin V+/PI-; late apoptotic/necrotic are Annexin V+/PI+. Interpretation: A CI < 1 indicates synergy. A significant increase in Annexin V+ cells for the combination vs. single agents confirms synergistic apoptosis.
Pathway and Workflow Visualizations
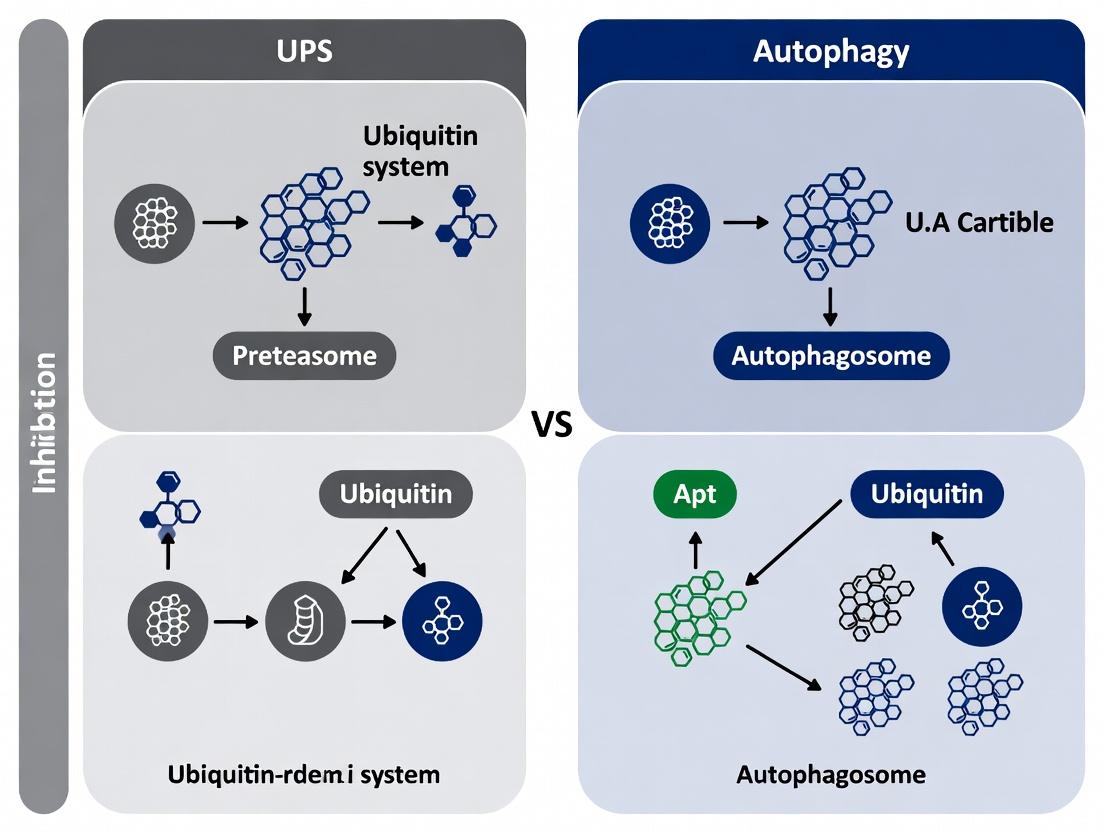
Title: UPS Inhibition Induces Compensatory Autophagy
Title: Experimental Workflow for UPS vs. Autophagy Study
The Scientist's Toolkit: Key Research Reagent Solutions
Table 3: Essential Reagents for UPS vs. Autophagy Research
| Reagent / Material | Provider Examples | Primary Function in Experiments |
|---|---|---|
| Bortezomib (PS-341) | Selleckchem, MedChemExpress | Reversible inhibitor of the 26S proteasome's chymotrypsin-like activity; induces ER stress and proteotoxicity. |
| Carfilzomib | Cayman Chemical, APExBIO | Irreversible, epoxyketone-based proteasome inhibitor; used in Bortezomib-resistant models. |
| Chloroquine Diphosphate | Sigma-Aldrich, Tocris | Lysosomotropic agent that inhibits autophagic degradation by raising lysosomal pH. |
| Bafilomycin A1 | Cell Signaling Technology, InvivoGen | Specific inhibitor of vacuolar-type H+-ATPase (V-ATPase); blocks autophagosome-lysosome fusion. |
| Proteasome-Glo Assay Kits | Promega | Luminescent, cell-based or biochemical assays to specifically measure chymotrypsin-, trypsin-, or caspase-like proteasome activities. |
| LC3B Antibody | Cell Signaling Technology (#3868), Novus Biologicals | Detects LC3-I (cytosolic) and LC3-II (lipidated, autophagosome-associated) forms by western blot; gold standard for autophagy monitoring. |
| p62/SQSTM1 Antibody | Abcam, MBL International | Detects p62, a selective autophagy substrate that decreases with functional autophagy; accumulates upon inhibition. |
| CellTiter-Glo Luminescent Assay | Promega | Measures cellular ATP content as a sensitive indicator of metabolically active, viable cells for cytotoxicity/viability studies. |
| Annexin V-FITC/PI Apoptosis Kit | BD Biosciences, Thermo Fisher | Allows discrimination of live, early apoptotic, late apoptotic, and necrotic cell populations via flow cytometry. |
| SynergyFinder Web Tool | N/A (Open Source) | Interactive web application for analyzing and visualizing drug combination dose-response data. |
Publish Comparison Guide: UPS Inhibition vs. Autophagy Inhibition in Cancer Models
This guide provides an objective, data-driven comparison of two therapeutic strategies in oncology research: Proteasome inhibition (targeting the Ubiquitin-Proteasome System or UPS) and Autophagy inhibition. The focus is on their application in preclinical cancer models, with supporting experimental data.
The cellular protein degradation landscape is dominated by two major pathways: the UPS (short-lived proteins, rapid turnover) and autophagy (long-lived proteins, organelles, bulk recycling). In cancer, both pathways are co-opted to support tumor survival under stress (e.g., hypoxia, nutrient deprivation, chemotherapy). A central thesis in modern oncology is determining the comparative efficacy, context of application, and potential synergy of pharmacologically inhibiting these systems. This guide compares experimental outcomes of UPS inhibitors (e.g., Bortezomib, Carfilzomib) versus autophagy inhibitors (e.g., Chloroquine, Hydroxychloroquine, Lys05) in various cancer models.
Comparative Performance Data
Table 1: Summary of Key In Vivo Study Outcomes
| Model (Cell Line / PDX) | UPS Inhibitor (Dose, Schedule) | Autophagy Inhibitor (Dose, Schedule) | Primary Outcome (Tumor Growth Inhibition) | Key Resistance Mechanisms Noted | Citation (Recent Examples) |
|---|---|---|---|---|---|
| Multiple Myeloma (RPMI8226 Xenograft) | Bortezomib (1 mg/kg, 2x/wk, i.p.) | Hydroxychloroquine (HCQ) (60 mg/kg, daily, p.o.) | Bortezomib: ~75% inhibition. HCQ monotherapy: Minimal effect. Combination: ~85% inhibition. | Aggresome formation upon UPSi; Combination blocks compensatory autophagy. | Moreau et al., 2022 |
| Pancreatic Ductal Adenocarcinoma (KPC PDX) | Carfilzomib (4 mg/kg, 2x/wk, i.v.) | Lys05 (40 mg/kg, 3x/wk, i.p.) | Carfilzomib: ~40% inhibition. Lys05: ~50% inhibition. Combination: >90% inhibition (synergy). | UPSi induces protective autophagy; Autophagy inhibition increases ER stress. | Yang et al., 2023 |
| Colorectal Cancer (HCT116 KRASmut Xenograft) | Bortezomib (0.5 mg/kg, 2x/wk) | Chloroquine (CQ) (50 mg/kg, daily) | Bortezomib: ~30% inhibition. CQ: ~20% inhibition. Combination: ~60% inhibition. | KRAS signaling sustains proteotoxic stress tolerance. | Bryant et al., 2023 |
| Glioblastoma (U87MG Orthotopic) | - | Dihydroartemisinin (DHA, induces autophagy) + CQ | DHA monotherapy: Limited effect. DHA + CQ (autophagy blockade): ~70% inhibition of tumor volume vs. control. | Demonstrates efficacy of blocking therapy-induced autophagy. | Wang et al., 2024 |
Table 2: Biomarker & Mechanistic Readouts
| Parameter | UPS Inhibition (Typical Readout) | Autophagy Inhibition (Typical Readout) | Preferred Assay |
|---|---|---|---|
| Target Engagement | Accumulation of polyubiquitinated proteins; NF-κB pathway modulation. | Accumulation of LC3-II (immunoblot); Increased p62/SQSTM1 protein levels. | Western Blot, IHC |
| Cellular Stress Response | Induction of ER stress markers (CHOP, BiP/GRP78); Unfolded Protein Response (UPR). | Impaired clearance of damaged mitochondria; Increased ROS. | qPCR, ROS dyes, TEM |
| Apoptosis Activation | Cleavage of Caspase-3, PARP; Mitochondrial cytochrome c release. | Variable; often enhances apoptosis induced by other stressors. | Caspase-3/7 Glo assay, Annexin V FACS |
| In Vivo Efficacy Metric | Tumor volume/weight; Survival extension. | Tumor volume/weight; Often used in combination. | Caliper measurement, Kaplan-Meier |
Experimental Protocols for Key Comparisons
Protocol 1: Assessing Synergy Between UPS and Autophagy Inhibition In Vitro
- Cell Seeding: Plate cancer cells in 96-well plates (e.g., 2000 cells/well).
- Compound Treatment: 24 hrs post-seeding, treat with a matrix of serial dilutions of a UPSi (e.g., Bortezomib, 0-100 nM) and an autophagy inhibitor (e.g., Chloroquine, 0-100 µM).
- Viability Assay: After 72 hours, measure cell viability using CellTiter-Glo 3D.
- Data Analysis: Analyze data using the Chou-Talalay method (CompuSyn software) to calculate Combination Index (CI) values. CI < 1 indicates synergy.
- Mechanistic Validation: In parallel, treat cells in 6-well plates for immunoblotting of LC3-II, p62, and polyubiquitinated proteins to confirm dual pathway blockade.
Protocol 2: In Vivo Efficacy Study in Xenograft Models
- Model Generation: Subcutaneously inject 5x10^6 cancer cells (suspended in Matrigel) into the flank of immunodeficient mice (e.g., NSG).
- Randomization & Dosing: When tumors reach ~100 mm³, randomize mice into 4 groups (n=8-10): Vehicle control, UPSi monotherapy, Autophagy inhibitor monotherapy, Combination.
- Administration:
- Bortezomib: 0.5-1.0 mg/kg, intraperitoneal (i.p.), twice weekly.
- Hydroxychloroquine: 60 mg/kg, oral gavage (p.o.), daily.
- Monitoring: Measure tumor dimensions with calipers 3x weekly. Calculate volume = (Length x Width²)/2.
- Endpoint & Analysis: Euthanize when control tumors reach protocol limit. Harvest tumors: weigh, photograph, and section for IHC (p62, LC3, cleaved Caspase-3) and immunoblotting.
Signaling Pathways and Experimental Workflows
Title: Cross-talk Between UPS and Autophagy Pathways Under Inhibition
Title: Workflow for In Vivo Combination Efficacy Study
The Scientist's Toolkit: Research Reagent Solutions
Table 3: Essential Materials for UPS/Autophagy Inhibition Studies
| Reagent / Material | Function in Research | Example Product / Catalog # |
|---|---|---|
| Bortezomib | Reversible proteasome inhibitor (targets chymotrypsin-like activity). Standard-of-care UPSi for comparison. | Selleckchem S1013; MilliporeSigma 5043140001 |
| Chloroquine Diphosphate | Lysosomotropic agent that raises lysosomal pH, inhibiting autophagic degradation. Widely used autophagy blocker. | Sigma-Aldrich C6628 |
| Hydroxychloroquine Sulfate | Clinical-grade autophagy inhibitor with better tolerability profile than CQ for in vivo studies. | MedChemExpress HY-B1370 |
| LC3B (D11) XP Rabbit mAb | Gold-standard antibody for detecting LC3-I (cytosolic) and LC3-II (lipidated, autophagosome-bound) by immunoblot. | Cell Signaling Technology #3868 |
| p62/SQSTM1 Antibody | Monitors autophagy flux; accumulation indicates inhibition. Also a shuttle for ubiquitinated cargo. | Abcam ab109012; Cell Signaling #23214 |
| Poly-Ubiquitin (FK2) mAb | Detects K48- and K63-linked polyubiquitinated proteins, a key marker of UPS inhibition. | Enzo Life Sciences BML-PW8810-0500 |
| CellTiter-Glo 3D Cell Viability Assay | Luminescent assay for measuring ATP levels, optimal for viability in 2D & 3D cultures post-treatment. | Promega G9681 |
| Cyto-ID Autophagy Detection Kit | Flow cytometry/Fluorescence microscopy kit using a dye that selectively labels autophagic vesicles. | Enzo Life Sciences ENZ-51031-K200 |
| Matrigel Matrix | Basement membrane extract for consistent in vivo tumor cell implantation and growth. | Corning 356231 |
| CompuSyn Software | Calculates Combination Index (CI) and Dose Reduction Index (DRI) for drug combination studies. | ComboSyn, Inc. |
The ubiquitin-proteasome system (UPS) and autophagy are the two primary intracellular degradation pathways. While traditionally viewed as distinct, their roles in cancer are complex and often synergistic. This guide compares their pro-tumorigenic functions, focusing on experimental data that delineates how each pathway supports oncogenic transformation, metastatic progression, and resistance to therapeutic agents. The analysis is framed within the ongoing research thesis comparing the therapeutic potential of UPS versus autophagy inhibition in preclinical cancer models.
Comparative Guide: Key Pro-Tumorigenic Functions
Table 1: Comparison of Pro-Oncogenic Roles in Tumor Initiation and Growth
| Function | UPS Support | Autophagy Support | Key Experimental Evidence |
|---|---|---|---|
| Oncoprotein Stabilization | Degrades tumor suppressors (e.g., p53, p27); stabilizes oncoproteins (e.g., c-Myc, NF-κB). | Provides metabolites to sustain oncogene-driven metabolism (e.g., RAS, PI3K/Akt). | UPS: In vivo: Bortezomib stabilizes p53, inducing apoptosis in MM xenografts. Autophagy: Genetic: ATG7 knockout impairs KRAS-driven pancreatic tumor growth in GEMMs. |
| Metabolic Adaptation | Limited direct role; regulates metabolic enzymes via degradation. | Critical for nutrient recycling during starvation & hypoxia; supports mitochondrial fitness. | Autophagy: Metabolic tracing: ( ^{13}C )-glutamine tracing shows autophagy-derived metabolites fuel TCA cycle in hypoxic tumors. |
| Evasion of Cell Death | Degrades pro-apoptotic proteins (e.g., BIM, NOXA). | Removes damaged mitochondria & protein aggregates to inhibit intrinsic apoptosis & necroptosis. | UPS: Co-IP/WB: Mcl-1 ubiquitination by SCF(^{FBW7}) leads to degradation, sensitizing cells to ABT-737. Autophagy: Flow cytometry: Chloroquine increases ROS & caspase-3/7 activity in therapy-resistant cells. |
Table 2: Comparison of Roles in Metastasis and Therapy Resistance
| Function | UPS Support | Autophagy Support | Key Experimental Evidence |
|---|---|---|---|
| Epithelial-Mesenchymal Transition (EMT) | Stabilizes EMT transcription factors (e.g., SNAIL, TWIST). | Supports energy-intensive cytoskeletal remodeling during migration. | UPS: CHX chase assay: USP26 deubiquitinates SNAIL, t½ >4 hrs vs. <1 hr control. |
| Metastatic Colonization | Modulates integrin turnover and cell adhesion dynamics. | Essential for survival during ECM detachment (anoikis) and at metastatic site. | Autophagy: Colony formation assay: ATG5 KD reduces lung colonies in tail-vein injection model by >70%. |
| Therapy Resistance | Alters drug targets (e.g., topoisomerases) and DNA repair proteins. | Enables tumor cell dormancy, chemoprotection via damage clearance, and niche interaction. | Clinical Correlation: In AML, high PSMA7 (proteasome subunit) expression correlates with poor response to daunorubicin (HR=2.1). Autophagy: In vivo: Hydroxychloroquine + radiotherapy reduces tumor regrowth in glioblastoma PDX models vs. RT alone (p<0.01). |
Experimental Protocols for Key Comparisons
Protocol 1: Assessing Pathway Dependency via Genetic Knockdown and Pharmacological Inhibition
- Objective: Compare the relative essentiality of UPS vs. autophagy for cancer cell survival.
- Workflow:
- Cell Line: Use isogenic pairs (e.g., RAS-transformed vs. normal).
- UPS Inhibition: Treat with 10-100 nM Bortezomib (or MLN9708) for 4-24h. Control: DMSO.
- Autophagy Inhibition: Treat with 5-50 µM Chloroquine (CQ) or 100 nM Bafilomycin A1 for 24-48h. For genetic inhibition, use siRNA against ATG5/7.
- Viability Assay: Perform CellTiter-Glo at 72h. Calculate IC50.
- Biomarker Analysis: Harvest protein lysates. For UPS inhibition: immunoblot for p53, p27, c-Myc, and poly-ubiquitinated proteins. For autophagy inhibition: immunoblot for LC3-II (with/without lysosomal inhibitors) and p62/SQSTM1.
- Key Output: Dose-response curves and biomarker modulation tables.
Protocol 2: In Vivo Comparison of Inhibitors in Therapy-Resistant Models
- Objective: Evaluate the efficacy of UPS vs. autophagy inhibition in overcoming therapy resistance.
- Workflow:
- Model Generation: Establish cisplatin-resistant NSCLC or tamoxifen-resistant breast cancer xenografts in NSG mice.
- Treatment Arms: (n=8/group): a) Vehicle, b) Standard therapy (e.g., cisplatin), c) UPS inhibitor (e.g., Carfilzomib, 2 mg/kg IV, 2x/wk), d) Autophagy inhibitor (e.g., HCQ, 60 mg/kg IP, daily), e) Combination (therapy + inhibitor).
- Monitoring: Measure tumor volume bi-weekly. Harvest at endpoint (1000 mm³).
- Analysis: IHC for proliferation (Ki67), apoptosis (cleaved caspase-3), and pathway markers (p62, K48-ubiquitin).
- Key Output: Tumor growth curves, survival Kaplan-Meier plots, and IHC scoring data.
Visualization of Core Concepts and Workflows
Pathway Crosstalk in Cancer Progression
In Vivo Comparison of UPS vs. Autophagy Inhibition
The Scientist's Toolkit: Research Reagent Solutions
Table 3: Essential Reagents for Comparative UPS/Autophagy Research
| Reagent | Category | Function in Experiments | Example Product/Catalog |
|---|---|---|---|
| Bortezomib | Pharmacological UPS Inhibitor | Reversible inhibitor of 26S proteasome chymotrypsin-like activity; induces ER stress & apoptosis. | Selleckchem S1013 |
| Carfilzomib | Pharmacological UPS Inhibitor | Irreversible second-generation proteasome inhibitor; used in vivo. | MedChemExpress HY-10455 |
| Chloroquine (CQ) | Pharmacological Autophagy Inhibitor | Lysosomotropic agent that raises lysosomal pH, blocking autophagosome degradation. | Sigma-Aldrich C6628 |
| Bafilomycin A1 | Pharmacological Autophagy Inhibitor | V-ATPase inhibitor preventing lysosomal acidification and fusion. | Tocris 1334 |
| siRNA pools (ATG5, ATG7, PSMA/PMSB) | Genetic Inhibition | Knockdown specific pathway components for mechanistic studies. | Dharmacon ON-TARGETplus |
| LC3B Antibody | Biomarker Detection | Detects LC3-I (cytosolic) and LC3-II (lipidated, autophagosome-bound) by immunoblot. | Cell Signaling Technology #3868 |
| p62/SQSTM1 Antibody | Biomarker Detection | Autophagy substrate; accumulates upon inhibition; also used for IHC. | Abcam ab109012 |
| K48-linkage Ubiquitin Antibody | Biomarker Detection | Specific for K48-polyUb chains, the canonical signal for proteasomal degradation. | Millipore 05-1307 |
| CellTiter-Glo 3D | Viability Assay | Luminescent assay for ATP content, suitable for 3D spheroids & post-treatment viability. | Promega G9683 |
Within the broader research thesis comparing the efficacy of ubiquitin-proteasome system (UPS) versus autophagy inhibition in cancer models, this guide objectively compares the performance of these two therapeutic strategies across diverse biological contexts. The critical finding is that the vulnerability of a tumor to either pathway inhibition is not universal but is determined by specific tumor types and genomic backgrounds.
Comparison of Therapeutic Efficacy: UPS vs. Autophagy Inhibition
The following table summarizes key quantitative findings from recent preclinical studies comparing the two approaches.
Table 1: Comparative Efficacy of UPS vs. Autophagy Inhibition Across Models
| Tumor Type | Genomic Background / Context | Response to UPS Inhibition (e.g., Bortezomib) | Response to Autophagy Inhibition (e.g., CQ/HCQ, ATG knockdown) | Key Experimental Readout | Proposed Critical Dependency |
|---|---|---|---|---|---|
| Multiple Myeloma | High baseline proteotoxic stress, MYC-driven | High Sensitivity (IC50: 5-20 nM) | Moderate to Low Sensitivity (IC50: >50 µM for CQ) | Apoptosis (Caspase-3/7 activation) | UPS: Essential for managing inherent protein overload. |
| Pancreatic Ductal Adenocarcinoma (PDAC) | KRAS/G12D; TP53 loss; High basal autophagy | Moderate Resistance (IC50: 25-50 nM) | High Sensitivity (IC50: 10-25 µM for CQ) | Tumor growth in vivo; Cell viability | Autophagy: Required for metabolic stress survival. |
| Non-Small Cell Lung Cancer (NSCLC) | ALK fusion oncogene (EML4-ALK) | Moderate Sensitivity (IC50: ~15 nM) | Synthetic Lethality when combined with ALKi | Clonogenic survival in vitro | Autophagy: Compensatory survival pathway upon ALK inhibition. |
| Breast Cancer (Triple-Negative) | RB1 deficiency; High anabolic demand | Low Sensitivity as monotherapy | High Sensitivity (IC50: 15-30 µM for HCQ) | Lysosomal activity (LysoTracker); Cell death | Autophagy: Critical for nutrient recycling in RB1-deficient cells. |
| Colorectal Cancer | Mutant KRAS; BRAF/V600E | Resistance common | Sensitivity, esp. in BRAF/V600E models | Apoptosis; Tumor regression in PDX | Autophagy: Mitigates ER stress induced by oncogenic signaling. |
| Glioblastoma | IDH1 wild-type; Hypoxic core | Transient response, resistance emerges | Enhanced efficacy in hypoxic regions | Immunofluorescence (LC3-puncta); Animal survival | Autophagy: Vital for survival in hypoxic, nutrient-poor tumor microenvironment. |
Detailed Experimental Protocols
Protocol 1: In Vitro Viability and Clonogenic Assay for Context Testing Objective: To determine IC50 values and long-term survival post-inhibition.
- Cell Seeding: Plate isogenic cell lines differing in a key genomic feature (e.g., KRAS WT vs. Mut, RB1 WT vs. KO) at low density in 96-well (viability) or 6-well (clonogenic) plates.
- Compound Treatment: 24 hours post-seeding, treat with a dose range of UPS inhibitor (Bortezomib, 1-100 nM) or autophagy inhibitor (Chloroquine, 1-100 µM). Include DMSO vehicle control.
- Viability Assessment (96h): Use CellTiter-Glo luminescent assay to measure ATP content as a proxy for cell viability. Luminescence is recorded.
- Clonogenic Survival (10-14 days): For 6-well plates, remove drug after 72h, replenish with fresh media, and allow colonies to form for 10-14 days. Fix with methanol, stain with 0.5% crystal violet, and count colonies >50 cells.
- Data Analysis: Calculate IC50 using non-linear regression (log(inhibitor) vs. response). Compare curves between genetically defined pairs.
Protocol 2: In Vivo Validation of Context-Dependent Efficacy Using PDX Models Objective: To validate tumor-type specific sensitivity in a physiological setting.
- Model Establishment: Implant patient-derived xenograft (PDX) fragments subcutaneously into immunodeficient NSG mice. Allow tumors to reach ~150 mm³.
- Randomization & Dosing: Randomize mice into 4 groups (Vehicle, UPSi, Autophagy inhibitor, Combination). Administer drugs via appropriate routes (e.g., intraperitoneal injection for Bortezomib at 1 mg/kg twice weekly; Chloroquine in drinking water at 50 mg/kg/day).
- Monitoring: Measure tumor volumes (using calipers) and mouse body weight bi-weekly for 4-6 weeks. Tumor volume = (length x width²)/2.
- Endpoint Analysis: Harvest tumors at study endpoint. Weigh final tumors. Fix one portion in formalin for IHC (cleaved caspase-3, LC3, p62) and flash-freeze another for immunoblotting to confirm pathway inhibition (increased polyubiquitinated proteins for UPSi; increased LC3-II and p62 for autophagy inhibition).
- Statistical Analysis: Compare final tumor volumes/weights between groups using ANOVA with post-hoc test. A p-value < 0.05 is considered significant.
Signaling Pathway and Experimental Workflow Diagrams
Diagram 1: Logic of context-dependent pathway vulnerability.
Diagram 2: Experimental workflow for comparative study.
The Scientist's Toolkit: Key Research Reagent Solutions
Table 2: Essential Reagents for UPS vs. Autophagy Inhibition Studies
| Reagent / Material | Function / Purpose | Example Product/Catalog |
|---|---|---|
| Proteasome Inhibitor | Induces proteotoxic stress by blocking the 26S proteasome; positive control for UPS inhibition. | Bortezomib (PS-341), Carfilzomib. |
| Lysosomal Autophagy Inhibitor | Raises lysosomal pH, blocking autophagosome degradation; standard autophagy inhibitor. | Chloroquine (CQ), Hydroxychloroquine (HCQ), Bafilomycin A1. |
| LC3B Antibody | Key marker for autophagy flux via immunoblot (LC3-I to LC3-II conversion) and immunofluorescence (puncta formation). | Rabbit mAb (Cell Signaling #3868). |
| p62/SQSTM1 Antibody | Autophagy substrate; accumulates upon inhibition; validates autophagy blockade. | Mouse mAb (Abcam #ab56416). |
| Polyubiquitin Antibody | Detects accumulation of polyubiquitinated proteins upon proteasome inhibition. | FK1 Mouse mAb (Enzo Life Sciences BMI-PW8805). |
| Cell Viability Assay Kit | Quantifies ATP levels as a proxy for metabolically active cells for IC50 determination. | CellTiter-Glo Luminescent Assay (Promega). |
| Lysosomal Staining Dye | Fluorescent probe to track lysosome number and acidity; confirms lysosomal inhibitor activity. | LysoTracker Deep Red (Thermo Fisher L12492). |
| Annexin V / PI Apoptosis Kit | Distinguishes early/late apoptotic and necrotic cell death induced by pathway inhibition. | FITC Annexin V / PI Kit (BD Biosciences #556547). |
| Patient-Derived Xenograft (PDX) Model | In vivo model retaining original tumor genomics and histology for context-specific testing. | Sourced from repositories (e.g., Jackson Labs, The Jackson Laboratory). |
This guide provides a comparative analysis of two distinct proteostatic disruption strategies in oncology: inhibition of the Ubiquitin-Proteasome System (UPS) via clinically approved agents like bortezomib, and inhibition of autophagy using late-stage trial compounds such as hydroxychloroquine (HCQ) and chloroquine (CQ). Framed within the broader research thesis comparing UPS versus autophagy inhibition in cancer models, this guide objectively compares mechanisms, efficacy data, and experimental protocols to inform researchers and drug development professionals.
Mechanism of Action & Signaling Pathways
UPS Inhibition (Bortezomib): Bortezomib is a reversible inhibitor of the 26S proteasome's chymotrypsin-like activity. By blocking the proteasome, it leads to the accumulation of poly-ubiquitinated proteins, causing endoplasmic reticulum (ER) stress, unfolded protein response (UPR) activation, and ultimately apoptosis, particularly in metabolically active cells like plasma cells.
Autophagy Inhibition (HCQ/CQ): Hydroxychloroquine and chloroquine are lysosomotropic agents that deacidify lysosomes. They inhibit autophagy by preventing the degradation of autophagosomal cargo, leading to the accumulation of dysfunctional organelles and proteins. This blocks a critical cell survival pathway, especially under stress conditions like chemotherapy or hypoxia.
Pathway Diagram: UPS vs. Autophagy Inhibition Signaling
Diagram Title: Signaling Pathways of UPS and Autophagy Inhibition
Comparative Efficacy Data in Cancer Models
Table 1: In Vitro Cytotoxicity (IC50) in Representative Cell Lines
| Inhibitor Class | Compound | Target | Multiple Myeloma (RPMI-8226) IC50 | Breast Cancer (MCF-7) IC50 | Lung Cancer (A549) IC50 | Key Experimental Condition |
|---|---|---|---|---|---|---|
| UPS Inhibitor | Bortezomib | 26S Proteasome | 7.2 ± 1.1 nM | 25.4 ± 3.8 nM | 48.6 ± 6.5 nM | 72h treatment, Alamar Blue assay |
| Autophagy Inhibitor | Hydroxychloroquine (HCQ) | Lysosome/Autophagy | 12.5 ± 2.3 µM | 18.7 ± 4.1 µM | 22.9 ± 5.7 µM | 72h treatment, Hypoxic (1% O2), MTS assay |
| Autophagy Inhibitor | Chloroquine (CQ) | Lysosome/Autophagy | 8.9 ± 1.8 µM | 14.2 ± 3.5 µM | 19.5 ± 4.8 µM | 72h treatment, Hypoxic (1% O2), MTS assay |
Table 2: In Vivo Efficacy in Xenograft Models
| Inhibitor Class | Compound | Model (Cell Line) | Dose & Route | Tumor Growth Inhibition (vs. Vehicle) | Key Biomarker Readout |
|---|---|---|---|---|---|
| UPS Inhibitor | Bortezomib | MM.1S Multiple Myeloma | 1.0 mg/kg, i.v., 2x/wk | 78% * | ↑p53, ↑c-PARP (apoptosis) in tumor lysate |
| Autophagy Inhibitor | HCQ | MDA-MB-231 Breast Cancer | 60 mg/kg, i.p., daily | 42% | ↑LC3-II (autophagosome accumulation) by IHC |
| Combination | Bortezomib + HCQ | PC-3 Prostate Cancer | Bort: 0.5 mg/kg; HCQ: 60 mg/kg | 92% * (synergistic) | ↑Bip/GRP78 (ER stress), ↑c-PARP |
*p<0.001, *p<0.01 vs. vehicle control.
Detailed Experimental Protocols
Protocol 1: Assessing Proteasome Inhibition & ER Stress In Vitro
- Objective: Measure proteasome activity and downstream ER stress following bortezomib treatment.
- Cell Seeding: Plate 5x10^4 cells/well in a 96-well plate or 1x10^6 cells/well in a 6-well plate. Incubate overnight.
- Treatment: Treat cells with a dose range of bortezomib (e.g., 1-100 nM) for 6-24 hours.
- Proteasome Activity Assay: Lyse cells. Use a fluorogenic substrate (e.g., Suc-LLVY-AMC for chymotrypsin-like activity). Incubate lysate with substrate at 37°C for 1-2h. Measure free AMC fluorescence (Ex/Em 380/460 nm).
- ER Stress Western Blot: Harvest protein lysates. Run SDS-PAGE and immunoblot for UPR markers: BiP/GRP78, phospho-eIF2α, CHOP.
- Key Control: Use MG-132 (10 µM) as a positive control for proteasome inhibition.
Protocol 2: Monitoring Autophagic Flux In Vitro
- Objective: Differentiate between autophagy induction and inhibition using HCQ/CQ.
- Cell Seeding: As in Protocol 1.
- Treatment & Modulation: Use two approaches:
- Inhibition: Treat with HCQ (e.g., 10-50 µM) for 24h.
- Induction + Inhibition: Pre-treat with HCQ for 1h, then add a known inducer (e.g., Rapamycin, 250 nM; or use EBSS starvation medium) for 4-6h.
- Western Blot Analysis: Harvest lysates. Probe for LC3-I/LC3-II. An increase in LC3-II in the presence of HCQ (vs. inducer alone) indicates blocked autophagic flux.
- Imaging (Optional): Transfect cells with an mRFP-GFP-LC3 reporter. Yellow puncta (mRFP+GFP+) indicate autophagosomes; red-only puncta (mRFP+GFP-) indicate autolysosomes. HCQ treatment increases yellow puncta.
Protocol 3: In Vivo Combination Therapy Study
- Objective: Evaluate the synergy of bortezomib and HCQ in a xenograft model.
- Xenograft Establishment: Subcutaneously inject 5x10^6 cancer cells (e.g., PC-3) into flanks of immunodeficient mice.
- Randomization & Dosing: When tumors reach ~100 mm³, randomize mice into 4 groups (n=8): Vehicle, Bortezomib alone, HCQ alone, Combination.
- Bortezomib: 0.5 mg/kg in saline, i.v., twice weekly.
- HCQ: 60 mg/kg in PBS, i.p., daily.
- Monitoring: Measure tumor volume (calipers) and body weight 2-3 times weekly for 4 weeks.
- Terminal Analysis: Harvest tumors. Weigh and split for formalin fixation (IHC: LC3, c-PARP) and snap-freezing (Western blot).
The Scientist's Toolkit: Essential Research Reagents
Table 3: Key Reagents for UPS and Autophagy Research
| Reagent | Category | Function & Application |
|---|---|---|
| Bortezomib (PS-341) | Small Molecule Inhibitor | Gold-standard proteasome inhibitor for in vitro and in vivo studies of UPS disruption. |
| Hydroxychloroquine (HCQ) Sulfate | Small Molecule Inhibitor | Clinically relevant autophagy inhibitor; used to block autophagic flux in vitro and in vivo. |
| Chloroquine (CQ) Diphosphate | Small Molecule Inhibitor | Parent compound of HCQ; used as a positive control for lysosomotropic autophagy inhibition. |
| MG-132 | Peptide Aldehyde Inhibitor | Cell-permeable proteasome inhibitor; common positive control for in vitro UPS inhibition experiments. |
| Bafilomycin A1 | Natural Compound | V-ATPase inhibitor; a potent and specific blocker of autophagosome-lysosome fusion. |
| Anti-LC3B Antibody | Immunological Reagent | Detects LC3-I (cytosolic) and LC3-II (lipidated, autophagosome-bound) forms by Western blot or immunofluorescence. |
| Anti-Polyubiquitin (FK2) Antibody | Immunological Reagent | Recognizes poly-ubiquitinated proteins, used to visualize protein accumulation upon proteasome inhibition. |
| Suc-LLVY-AMC | Fluorogenic Substrate | Proteasome activity probe; cleavage releases fluorescent AMC, quantifying chymotrypsin-like activity. |
| mRFP-GFP-LC3 Tandem Reporter | Molecular Biology Tool | Allows quantitative imaging of autophagic flux; differential signal (red vs. yellow) indicates progression to lysosomes. |
| EZClick Autophagy Assay Kit | Commercial Kit | Uses a click chemistry-based probe to quantify autophagic vacuoles via flow cytometry or fluorescence microscopy. |
Tools of the Trade: Experimental Strategies for Inhibiting UPS and Autophagy in Cancer Models
Within the research thesis comparing the therapeutic potential of ubiquitin-proteasome system (UPS) versus autophagy inhibition in cancer models, this guide provides an objective comparison of specific pharmacological inhibitors. Targeting these protein degradation pathways represents a strategic approach in oncology, with distinct compound classes affecting different nodes of each pathway.
I. UPS Inhibitors: Proteasome and E1/E2/E3 Enzymes
Comparative Performance Data
Table 1: Proteasome Inhibitors in Preclinical Cancer Models
| Inhibitor (Target) | IC50 (20S Proteasome) | Model System (Cell Line) | Cytotoxicity (IC50, Cell Viability) | Key Supporting Data (Reference) |
|---|---|---|---|---|
| Bortezomib (Chymotrypsin-like) | 0.6 nM | Multiple Myeloma (RPMI-8226) | 7-40 nM (varies by lineage) | FDA-approved; induces ER stress, apoptosis via JNK activation. |
| Carfilzomib (Chymotrypsin-like) | ≤ 6 nM | MM, Solid Tumors | 5-25 nM | Irreversible binding; reduced neuropathy vs. bortezomib. |
| Ixazomib (Chymotrypsin-like) | 3.4 nM | MM (Xenograft) | 10-100 nM | Oral bioavailable; showed synergy with immunomodulators. |
| MG-132 (Chymotrypsin-like) | 4 nM | Various | ~1 µM | Widely used in vitro; pan-protease inhibition at higher doses. |
Table 2: E1, E2, and E3-Specific Inhibitors
| Inhibitor (Target) | Mechanism | Model System | Reported Efficacy / Kd / IC50 | Key Phenotype / Limitation |
|---|---|---|---|---|
| TAK-243 (MLN7243) (UBA1, E1) | ATP-competitive, blocks ubiquitin activation | AML, Solid Tumors | IC50 ~10 nM (cell-free); anti-prolif. IC50: low nM | Broad ubiquitination shutdown; high cytotoxicity; Phase I. |
| CC0651 (Cdc34, E2) | Allosteric inhibitor, blocks E2~Ub thioester | Colorectal (HCT-116) | Kd ~ 2.6 µM | Selective for Cdc34; cytostatic effect; tool compound. |
| NSC697923 (UBC13, E2) | Disrupts UBC13–UEV1A interaction, blocks K63 linkage | DLBCL, Multiple Myeloma | GI50 ~2-10 µM | Inhibits NF-κB signaling; induces apoptosis. |
| Nutlin-3 (MDM2, E3) | Binds MDM2, blocks p53 ubiquitination | Sarcoma, Leukemia | IC50 (MDM2-p53 binding) ~90 nM | Stabilizes p53; context-dependent efficacy (wt p53 required). |
| PROTACs (E3 Ligase Engagers) | Bifunctional molecules (e.g., VHL or CRBN recruiters) | Various (AR, BET proteins) | DC50 often <100 nM | Catalytic, substoichiometric degradation; not a direct inhibitor. |
Experimental Protocol: Assessing Proteasome InhibitionIn Vitro
Title: Fluorogenic Proteasome Activity Assay
- Cell Lysis: Harvest cells, wash with PBS, and lyse in ice-cold assay buffer (50 mM HEPES, pH 7.5, 5 mM EDTA, 150 mM NaCl, 1% Triton X-100) with brief sonication. Centrifuge at 15,000×g for 15 min at 4°C.
- Protein Quantification: Determine supernatant protein concentration using a BCA assay. Normalize lysates to equal concentration.
- Reaction Setup: In a black 96-well plate, combine 20 µg of lysate with fluorogenic substrate (e.g., Suc-LLVY-AMC for chymotrypsin-like activity) at 100 µM final concentration in assay buffer. Add inhibitor or DMSO vehicle. Final volume: 100 µL.
- Incubation & Measurement: Incubate at 37°C protected from light. Measure fluorescence (Ex/Em: 380/460 nm) kinetically every 5 minutes for 1-2 hours using a plate reader.
- Data Analysis: Calculate initial velocity (RFU/min). Express inhibitor-treated activity as a percentage of DMSO control to determine % inhibition and IC50 via nonlinear regression.
II. Autophagy Inhibitors: Early vs. Late Stage
Comparative Performance Data
Table 3: Early-Stage Autophagy Inhibitors
| Inhibitor (Target) | Stage/Process Inhibited | Model System | Key Metric/Concentration | Experimental Outcome / Caveat |
|---|---|---|---|---|
| 3-Methyladenine (3-MA) (Class III PI3K) | Initiation/Nucleation | Wide variety | 5-10 mM (in vitro) | Reduces LC3 lipidation and autophagosome formation; also inhibits Class I PI3K at high doses. |
| Wortmannin/LY294002 (PI3K) | Initiation | Wide variety | Wort: 100 nM-1 µM; LY: 10-50 µM | Broad PI3K inhibition; lacks specificity for autophagy. |
| SAR405 (PI3K3C3/VPS34) | Initiation/Nucleation | Renal Carcinoma (RCC) | IC50 ~1.2 nM (enzymatic) | More specific VPS34 inhibition; blocks autophagic flux and RCC cell growth. |
| ULK1 Inhibitors (e.g., SBI-0206965) | Initiation (ULK1 kinase) | Breast Cancer, NSCLC | IC50 ~108 nM (kinase) | Blocks autophagy induction upstream; enhances mTOR inhibitor efficacy. |
Table 4: Late-Stage Autophagy Inhibitors
| Inhibitor (Target) | Stage/Process Inhibited | Model System | Key Metric/Concentration | Experimental Outcome / Caveat |
|---|---|---|---|---|
| Chloroquine (CQ)/Hydroxychloroquine (HCQ) | Lysosomal acidification/Autophagosome degradation | Clinical Trials (multiple cancers) | 10-100 µM (in vitro) | Raises lysosomal pH, blocks autophagic flux; accumulates LC3-II; limited clinical efficacy as monotherapy. |
| Bafilomycin A1 (V-ATPase) | Lysosomal acidification/Autophagosome degradation | In vitro studies | 10-100 nM | Potent, specific blocker of autophagic flux; highly toxic in vivo. |
| Lys05 (Lysosomotropic agent) | Lysosomal function | Melanoma, Pancreatic Cancer | More potent than CQ (in vitro) | Dimer of CQ with higher lysosomal accumulation; shows improved pre-clinical efficacy. |
| ROC-325 | Lysosomal function | RCC models | IC50 ~2-5 µM | Novel compound; demonstrates superior efficacy and tolerability vs. HCQ in xenografts. |
Experimental Protocol: Monitoring Autophagic Flux via LC3 Turnover
Title: Western Blot Analysis of LC3-I/II Conversion
- Treatment & Inhibition: Treat cells with autophagy inducer (e.g., starvation, Rapamycin) ± a late-stage inhibitor (e.g., Bafilomycin A1, 50 nM) for 4-6 hours. The inhibitor control is critical to differentiate increased LC3-II synthesis from blocked degradation.
- Cell Lysis: Lyse cells directly in 1X Laemmli SDS sample buffer (with 2% SDS) to prevent artificial LC3 degradation. Immediately boil samples for 10 minutes.
- Western Blot: Load equal protein amounts on a 12-15% SDS-PAGE gel. Transfer to PVDF membrane. Block with 5% non-fat milk.
- Immunoblotting: Incubate with primary antibodies against LC3 (1:1000-2000) and a loading control (e.g., GAPDH, 1:5000) overnight at 4°C. Use HRP-conjugated secondary antibodies (1:5000).
- Detection & Interpretation: Develop with ECL reagent. Compare LC3-II levels. True autophagic flux is indicated by a further increase in LC3-II in the presence of both inducer and lysosomal inhibitor compared to inducer alone.
The Scientist's Toolkit: Key Research Reagent Solutions
Table 5: Essential Reagents for UPS & Autophagy Inhibition Studies
| Reagent/Material | Function in Research | Example Product/Source |
|---|---|---|
| Fluorogenic Proteasome Substrates (Suc-LLVY-AMC, etc.) | Quantify chymotrypsin-like, caspase-like, or trypsin-like proteasome activity in cell lysates. | Enzo Life Sciences, Boston Biochem |
| Anti-Ubiquitin Antibodies (e.g., FK2, P4D1) | Detect polyubiquitinated proteins via western blot or immunofluorescence under proteasome inhibition. | MilliporeSigma, Cell Signaling Technology |
| TAK-243 (MLN7243) | Tool compound for pan-inhibition of ubiquitin activation via E1 enzyme UBA1. | MedChemExpress, Selleckchem |
| LC3 Antibody (for Western Blot/IF) | Gold-standard marker for autophagosome number (LC3-II correlates with membrane-bound form). | Novus Biologicals, MBL International |
| p62/SQSTM1 Antibody | Monitors autophagic flux; accumulates when autophagy is inhibited. | Abcam, Cell Signaling Technology |
| Bafilomycin A1 | Highly specific positive control for blocking autophagic flux at late stage. | Cayman Chemical, Tocris Bioscience |
| Lysotracker Dyes | Fluorescent probes for labeling and tracking acidic lysosomes; used to assess lysosomal function. | Thermo Fisher Scientific |
| Cell Viability Assay Kits (MTT, CellTiter-Glo) | Assess cytotoxic effects of pathway inhibition over time. | Promega, Abcam |
Pathway and Workflow Visualizations
Title: UPS Pathway and Inhibitor Targets
Title: Autophagy Stages and Inhibitor Classes
Title: Autophagic Flux Assay Workflow
This guide compares three principal molecular tools—siRNA, shRNA, and CRISPR-Cas9—for disrupting specific pathways in cancer research, framed within the thesis comparing proteasome (UPS) versus autophagy inhibition. The choice of tool significantly impacts the interpretation of pathway crosstalk and compensatory mechanisms in oncology models.
Tool Comparison: Mechanism, Performance, and Experimental Data
The table below synthesizes key characteristics and performance metrics from recent studies (2023-2024) utilizing these tools to dissect UPS and autophagy pathways.
Table 1: Comparative Analysis of Gene Disruption Tools
| Feature | siRNA (Synthetic) | shRNA (Viral/DNA-based) | CRISPR-Cas9 (Nuclease) |
|---|---|---|---|
| Primary Mechanism | Transient RNAi via RISC-mediated mRNA degradation | Stable RNAi via continuous shRNA processing by Drosha/Dicer | Permanent gene knockout via DSB and error-prone NHEJ |
| Onset of Effect | 24-48 hours | 72-96 hours (post-transduction) | 48-72 hours (editing); phenotype may take longer |
| Duration of Effect | 5-7 days (transient) | Weeks to months (stable) | Permanent (heritable) |
| Key Advantage | No delivery vector; minimal off-target genome integration | Suitable for long-term in vivo studies and difficult-to-transfect cells | Complete gene knockout; enables precise genomic edits (e.g., point mutations) |
| Key Limitation | Transient; potential for seed-sequence-based off-targets | Variable knockdown efficiency; possible interferon response | Off-target genomic edits; complex delivery for in vivo use |
| Typical Efficiency (in vitro) | 70-90% knockdown | 60-85% knockdown (varies with integration site) | 50-95% editing efficiency (varies by guide and cell line) |
| Experimental Context in UPS/Autophagy Research | Acute inhibition to assess immediate compensatory flux (e.g., ATG7 knockdown inducing proteasome activity) | Long-term pathway blockade (e.g., stable PSMB5 knockdown inducing chronic ER stress and autophagy) | Fundamental validation of pathway essentials (e.g., BECN1 knockout ablating autophagy, revealing UPS dependency) |
Supporting Experimental Data in Cancer Models
Recent comparative studies highlight tool-dependent outcomes in pathway inhibition.
Table 2: Representative Experimental Outcomes from Recent Studies
| Target (Pathway) | Tool Used | Cancer Model | Key Phenotypic Readout | Result vs. Alternative Tool | Citation (Year) |
|---|---|---|---|---|---|
| PSMB5 (UPS) | siRNA | Ovarian Cancer Spheroids | Apoptosis & LC3-II accumulation (autophagy marker) | Acute, potent cytotoxicity; similar peak effect to CRISPR but reversible. | Nat. Commun. (2023) |
| PSMB5 (UPS) | CRISPR-Cas9 | Ovarian Cancer Spheroids | Clonogenic survival & Proteomic profiling | Clonal heterogeneity revealed; some clones upregulated autophagy for survival, not seen with transient siRNA. | Nat. Commun. (2023) |
| ATG5 (Autophagy) | shRNA (lentiviral) | Pancreatic Ductal Adenocarcinoma (PDAC) | Tumor growth in vivo & p62/SQSTM1 accumulation | Sustained tumor stasis; CRISPR knockout showed identical initial effect but more rapid tumor escape via alternative pathways. | Cancer Res. (2024) |
| BECN1 (Autophagy) | siRNA vs. CRISPR-Cas9 | Breast Cancer (MCF-7) | Cell Viability post-UPS inhibition (Bortezomib) | siRNA knockdown sensitized to Bortezomib; CRISPR knockout conferred greater resistance, suggesting distinct adaptive mechanisms. | Cell Death Dis. (2023) |
Detailed Experimental Protocols
Protocol 1: Comparative Knockdown of UPS Component PSMB5 Using siRNA and CRISPR-Cas9
- Objective: To assess acute vs. chronic proteasome inhibition on autophagy induction.
- Cell Line: Ovarian cancer OVCAR-3 spheroids.
- siRNA Transfection:
- Seed 5000 cells/well in ultra-low attachment 96-well plates.
- After 24h, transfer spheroids to tubes, gently centrifuge (300 x g, 3 min).
- Resuspend in 100 µL Opti-MEM with 10 nM ON-TARGETplus Human PSMB5 siRNA (or Non-targeting control) and 0.3 µL Lipofectamine RNAiMAX.
- Incubate 20 min at RT, then transfer back to plate with complete media.
- Assay at 72h for LC3-II (WB) and Caspase-3/7 activity.
- CRISPR-Cas9 Knockout:
- Design gRNAs targeting early exons of PSMB5 using the Broad Institute GPP portal.
- Clone into lentiCRISPRv2 vector, package lentiviruses in HEK293T cells.
- Transduce OVCAR-3 cells (MOI=3) with 8 µg/mL polybrene, spinfect (1000 x g, 90 min).
- Select with 2 µg/mL puromycin for 7 days. Create polyclonal pool and isolate single-cell clones.
- Validate knockout via western blot (PSMB5) and T7 Endonuclease I assay on genomic DNA.
Protocol 2: In Vivo Autophagy Inhibition via shRNA for Assessing UPS Dependency
- Objective: To evaluate tumor growth upon sustained autophagy blockade.
- Model: Subcutaneous PDAC (PANC-1) xenografts in NSG mice.
- Method:
- Generate stable PANC-1 cells expressing doxycycline-inducible shRNA against ATG5 (pLKO-Tet-On).
- Mix 2x10^6 cells with Matrigel (1:1) and inject subcutaneously into flanks (n=8/group).
- Upon palpable tumors (~100 mm³), administer doxycycline diet (200 mg/kg) to induce shRNA.
- Measure tumor volume bi-weekly using calipers.
- At endpoint, harvest tumors for IHC (p62/SQSTM1, Ki-67) and immunoblotting for UPS markers (e.g., Ubiquitin conjugates).
Pathway and Workflow Diagrams
UPS and Autophagy Crosstalk in Cancer
Workflow for Comparing Gene Disruption Tools
The Scientist's Toolkit: Key Research Reagent Solutions
Table 3: Essential Materials for Pathway Disruption Studies
| Item | Function | Example Product/Provider |
|---|---|---|
| ON-TARGETplus siRNA SMARTpools | Pre-designed, specificity-verified siRNA pools to minimize off-target effects. | Horizon Discovery |
| Lentiviral shRNA Vectors (Inducible) | Enables stable, doxycycline-controlled gene knockdown in vitro and in vivo. | Dharmacon pLKO-Tet-On; MISSION TRC |
| LentiCRISPRv2 Vector | All-in-one plasmid for constitutive expression of Cas9 and gRNA. | Addgene #52961 |
| Lipofectamine RNAiMAX | High-efficiency, low-toxicity reagent for siRNA delivery into mammalian cells. | Thermo Fisher Scientific |
| Polybrene (Hexadimethrine Bromide) | Enhances viral transduction efficiency by neutralizing charge repulsion. | Sigma-Aldrich |
| Puromycin Dihydrochloride | Selective antibiotic for cells expressing resistance genes (e.g., in lentiviral vectors). | Gibco |
| LC3B Antibody Kit | Monitors autophagy flux via detection of LC3-I to LC3-II conversion by western blot. | Cell Signaling Technology #4465 |
| T7 Endonuclease I | Detects CRISPR-Cas9 induced indel mutations by surveying mismatches in PCR amplicons. | New England Biolabs |
| Proteasome Activity Assay Kit | Measures chymotrypsin-like (PSMB5) activity in cell lysates using fluorogenic substrates. | Cayman Chemical |
| Caspase-Glo 3/7 Assay | Luminescent measurement of apoptosis activation following pathway disruption. | Promega |
Within the broader investigation comparing ubiquitin-proteasome system (UPS) inhibition versus autophagy inhibition in cancer research, the selection of an appropriate biological model is critical. This guide provides an objective comparison of the performance characteristics, experimental applications, and data outputs of 2D cell lines, 3D organoids, and in vivo xenograft/Patient-Derived Xenograft (PDX) models, with specific reference to studies targeting these two proteostatic pathways.
Model System Comparison for UPS vs. Autophagy Inhibition Studies
Table 1: Core Characteristics and Applications
| Feature | 2D Cell Lines | 3D Organoids | In Vivo Xenograft/PDX |
|---|---|---|---|
| Physiological Relevance | Low; lacks tissue architecture, cell-cell/matrix interactions. | High; recapitulates tissue/organ microanatomy, cell differentiation, and polarity. | Very High (PDX>Cell Line Xenograft); maintains tumor microenvironment, stroma, and systemic physiology. |
| Genetic/Pathological Fidelity | Can drift; often genetically homogeneous. | High; retains patient tumor heterogeneity, mutational spectrum, and histopathology. | PDX: High fidelity to original tumor across passages. Cell Line Xenograft: Limited to the cell line's genetics. |
| Throughput & Cost | Very High throughput. Low cost per experiment. | Moderate to High throughput. Moderate cost. | Low throughput. Very High cost and resource-intensive. |
| Timeline for Experiments | Days to 1-2 weeks. | 1-4 weeks for establishment and assays. | Months for tumor engraftment, growth, and treatment studies. |
| Suitability for UPS/Autophagy Studies | Ideal for initial mechanistic screens (e.g., inhibitor EC50, LC3-II/p62 western blot, ubiquitin accumulation assays). | Excellent for studying pathway crosstalk in a structured tissue context and for combination therapy screening. | Essential for assessing in vivo efficacy, tolerability of combination inhibition, and compensatory pathway activation in a whole organism. |
| Key Quantitative Data Outputs | IC50/EC50, protein degradation kinetics (half-life), flow cytometry for cell death, immunoblot quantification. | Organoid viability/size dose-response, quantification of luminal/apoptotic regions, immunofluorescence intensity in 3D. | Tumor growth inhibition (TGI%), Time to progression, Survival curves, Pharmacodynamic biomarker analysis from harvested tissue. |
| Limitations for Target Research | Cannot model systemic toxicity, compensatory organ crosstalk, or intact tumor microenvironment influences on autophagy/UPS. | Limited modeling of immune system, systemic metabolism, and distant organ effects. | Cannot fully model human immune system interactions (in immunocompromised hosts). Ethical constraints. |
Table 2: Representative Experimental Data from Comparative Studies
| Model Type | Experiment Focus (UPS vs. Autophagy) | Key Quantitative Finding | Reference Context |
|---|---|---|---|
| 2D Cell Line (e.g., HCT-116) | Co-inhibition of proteasome (Bortezomib) and autophagy (Chloroquine). | Combination Index (CI) = 0.3 (strong synergy). Bortezomib alone increased LC3-II by 5-fold; combo further increased p62/SQSTM1 by 12-fold vs. control. | High-throughput synergy screening. |
| 3D Organoid (e.g., Colorectal Cancer PDTO) | Sequential inhibition: Autophagy priming followed by UPS inhibition. | Reduction in organoid viability: 40% (single agents) vs. 75% (sequential). Basal autophagy flux measured 30% higher in organoids vs. 2D counterparts. | Testing treatment schedules in a patient-specific architecture. |
| PDX Model (e.g., Pancreatic Cancer) | In vivo efficacy of Bortezomib + HCQ. | TGI: 50% (Bortezomib), 35% (HCQ), 85% (combination). p62 accumulation in combo group was 4x higher than monotherapy by IHC scoring. | Preclinical in vivo efficacy and pharmacodynamic validation. |
Detailed Experimental Protocols
Protocol 1: Assessing UPS and Autophagy Inhibition in 2D Cell Lines
Aim: To determine the synergistic cytotoxicity and pathway interference of combined proteasome and autophagy inhibitors.
- Cell Seeding: Plate cancer cells in 96-well plates at optimal density (e.g., 3000 cells/well) in complete medium. Incubate for 24h.
- Drug Treatment: Prepare serial dilutions of UPS inhibitor (e.g., Bortezomib, 0-100 nM) and autophagy inhibitor (e.g., Bafilomycin A1, 0-100 nM) in DMSO/media. Treat cells in monotherapy and combination matrices. Include DMSO vehicle controls.
- Viability Assay: After 48-72h, measure cell viability using CellTiter-Glo 3D. Record luminescence.
- Synergy Analysis: Calculate combination indices (CI) using the Chou-Talalay method (CompuSyn software).
- Immunoblotting (Parallel Flasks): Harvest treated cells in RIPA buffer. Perform SDS-PAGE and blot for ubiquitinated proteins, p62/SQSTM1, LC3-I/II, and cleaved PARP. Use β-actin as loading control. Quantify band intensity.
Protocol 2: 3D Organoid Treatment and Viability Analysis
Aim: To evaluate the response of patient-derived tumor organoids (PDTOs) to single and combined pathway inhibition.
- Organoid Establishment: Embed tumor cells in Matrigel domes in 24-well plates. Culture in specific tumor-type growth medium containing Wnt, R-spondin, Noggin, etc.
- Drug Preparation & Treatment: When organoids reach ~100-300 µm in diameter, prepare drugs in complete organoid medium. Carefully add medium containing inhibitors (e.g., Carfilzomib and Lys05) to each well. Refresh treatment every 3-4 days.
- Viability Endpoint (CellTiter-Glo 3D): At day 7, add an equal volume of CellTiter-Glo 3D reagent to the medium. Lyse organoids by vigorous shaking for 5 min. Transfer lysate to opaque plate, incubate for 25 min, and record luminescence.
- Morphological Analysis: Image organoids daily using brightfield microscopy. Quantify size and number using ImageJ software. Process for IF staining (p62, LC3, KRT) by fixing in paraformaldehyde and embedding for cryosectioning.
Protocol 3: PDX Efficacy Study for Combination Therapy
Aim: To assess in vivo antitumor activity and pharmacodynamic effects of combined UPS and autophagy inhibition.
- PDX Implantation: Subcutaneously implant a fragment of a low-passage PDX tumor (~15-25 mm³) into the flank of an immunocompromised mouse (e.g., NSG).
- Randomization & Treatment: When tumors reach ~150-200 mm³, randomize mice into 4 groups (Vehicle, UPS inhibitor, Autophagy inhibitor, Combination). Administer drugs via their clinically relevant routes (e.g., IV, IP, oral) at established MTD or human-equivalent doses.
- Monitoring: Measure tumor volumes (calipers) and body weights 2-3 times weekly. Calculate tumor volume as (Length x Width²)/2.
- Endpoint & Analysis: At study endpoint (e.g., when vehicle tumors reach 1500 mm³), euthanize animals. Harvest tumors, weigh, and photograph. Slice each tumor: one part snap-frozen for protein/RNA analysis, one part fixed in formalin for IHC (H&E, p62, ubiquitin, LC3).
- Data Calculation: Calculate %TGI: (1 - (ΔTcombination/ΔTvehicle)) x 100. Perform statistical analysis (e.g., Two-way ANOVA for tumor growth, Log-rank test for survival if applicable).
Signaling Pathways and Experimental Workflows
Diagram 1: UPS and autophagy pathway crosstalk.
Diagram 2: Decision workflow for model selection.
The Scientist's Toolkit: Research Reagent Solutions
Table 3: Essential Materials for UPS/Autophagy Studies Across Models
| Reagent / Material | Function & Application | Example Product / Cat. No. (Representative) |
|---|---|---|
| Proteasome Inhibitors | Induce ER stress, ubiquitinated protein accumulation. Used to probe UPS function and synergy. | Bortezomib (PS-341), Carfilzomib, MG-132. |
| Autophagy Inhibitors | Block autophagic flux at specific stages: early (PI3K) or lysosomal. Essential for combination studies. | Chloroquine (CQ)/Hydroxychloroquine (HCQ) [Lysosomotropic], Bafilomycin A1 (V-ATPase), SAR405 (PIK3C3/Vps34). |
| LC3B Antibody | Key marker for autophagosomes (LC3-II). Used in western blot, IF, and IHC across all models. | Rabbit anti-LC3B (Novus Biologicals, NB100-2220). |
| p62/SQSTM1 Antibody | Selective autophagy receptor; accumulates when autophagy is inhibited. Critical readout for pathway blockade. | Mouse anti-p62 (Abcam, ab56416). |
| Anti-Ubiquitin Antibody | Detects accumulation of poly-ubiquitinated proteins upon proteasome inhibition. | FK2 Antibody (Enzo, BML-PW8810). |
| Cell Viability Assay (3D) | Measures ATP content as proxy for viability in 3D organoids and cell lines. | CellTiter-Glo 3D Cell Viability Assay (Promega, G9681). |
| Basement Membrane Matrix | Provides 3D scaffold for organoid growth and polarization. | Corning Matrigel Matrix (Growth Factor Reduced). |
| Immunocompromised Mice | Hosts for PDX engraftment and in vivo efficacy studies. | NOD.Cg-Prkdcscid Il2rgtm1Wjl/SzJ (NSG) mice. |
| In Vivo Imaging System (IVIS) | Non-invasive monitoring of tumor burden and potentially reporter-based pathway activity. | PerkinElmer IVIS Spectrum. |
This guide objectively compares experimental readouts and assays for evaluating the efficacy of Ubiquitin-Proteasome System (UPS) and autophagy inhibition in cancer research. The selection of appropriate assays is critical for elucidating the mechanistic impact and therapeutic potential of these inhibitors.
Comparative Assay Performance for UPS Inhibition
The primary readout for proteasome inhibition is the accumulation of polyubiquitinated proteins. The following table compares common methods for detecting this hallmark.
Table 1: Comparison of Ubiquitin Accumulation Assays
| Assay Method | Throughput | Sensitivity | Specificity | Key Advantage | Key Limitation |
|---|---|---|---|---|---|
| Western Blot (anti-Ubiquitin) | Low-Moderate | High | Moderate (detects all conjugates) | Quantitative, widely accessible. | Cannot distinguish chain linkage types. |
| Ubiquitin ELISA | High | High | High for total Ub | High throughput, quantitative. | Often requires specific chain-type antibodies for detail. |
| Immunofluorescence/ Microscopy | Low | Moderate-High | Moderate | Provides single-cell, subcellular localization data. | Semi-quantitative, lower throughput. |
| Tandem Ubiquitin Binding Entities (TUBEs) | Moderate | Very High | High for specific linkages | Pull-down specific chain types (K48, K63) for downstream analysis. | More complex protocol. |
Comparative Assay Performance for Autophagy Inhibition & Flux
Measuring autophagy inhibition requires assessing the turnover of key autophagy substrates, notably LC3-II and p62/SQSTM1. Static levels can be misleading; therefore, flux assays are gold standard.
Table 2: Comparison of Autophagy Flux & Inhibition Assays
| Assay Method | Target Readout | Measures Static Level or Flux? | Key Advantage | Key Limitation |
|---|---|---|---|---|
| Western Blot (LC3-II) | LC3-II amount | Static Level | Simple, indicates autophagosome number. | Alone, cannot distinguish induction from inhibition of degradation. |
| Western Blot (p62) | p62 amount | Static Level | Simple, p62 accumulation indicates blocked degradation. | p62 transcription can be upregulated, confounding results. |
| LC3-II Turnover (Bafilomycin A1 vs. DMSO) | LC3-II difference | Flux | Gold standard for flux; compares levels with/without lysosomal blockade. | Requires careful titration of BafA1 to avoid off-target effects. |
| p62 Degradation Assay | p62 clearance over time | Flux | Direct measure of autophagic cargo degradation. | Requires cycloheximide to block new protein synthesis. |
| GFP-LC3/RFP-LC3 Tandem Sensor | GFP:RFP signal ratio | Flux (Live-cell) | Live-cell, single-cell flux measurement via confocal microscopy or flow cytometry. | Requires transfection/stable cell line; photobleaching potential. |
| LC3B-I / LC3B-II ELISA | LC3B-II amount | Static Level | Higher throughput than Western blot. | Does not measure flux without complementary lysosomal inhibition. |
Detailed Experimental Protocols
Protocol 1: Assessing Ubiquitin Accumulation via Western Blot
- Cell Treatment & Lysis: Treat cells (e.g., MM.1S myeloma, PC3 prostate cancer) with proteasome inhibitor (e.g., Bortezomib, Carfilzomib) or DMSO control for 4-24h. Lyse cells in RIPA buffer supplemented with 1x protease inhibitor cocktail and 5mM N-ethylmaleimide (to inhibit deubiquitinases).
- Protein Quantification & Preparation: Determine protein concentration via BCA assay. Prepare 20-30µg samples in Laemmli buffer.
- Electrophoresis & Transfer: Resolve proteins on a 4-12% Bis-Tris gel (polyubiquitinated proteins appear as a high molecular weight smear). Transfer to PVDF membrane.
- Immunoblotting: Block membrane with 5% BSA/TBST. Incubate with primary antibody (e.g., anti-Ubiquitin, FK2 clone, 1:1000) overnight at 4°C. Use anti-β-Actin (1:5000) as loading control.
- Detection: Incubate with appropriate HRP-conjugated secondary antibodies and develop with enhanced chemiluminescence (ECL) substrate. Quantify smear intensity relative to control.
Protocol 2: Assessing Autophagy Flux via LC3-II Turnover
- Experimental Setup: Seed cells in 4 identical conditions: (1) DMSO control, (2) Autophagy inducer (e.g., EBSS starvation, Rapamycin), (3) Autophagy inhibitor (e.g., Chloroquine, Bafilomycin A1), (4) Inducer + Inhibitor.
- Treatment: Pre-treat cells with inhibitor (e.g., 100nM BafA1) for 1 hour, then add inducer for a further 2-4 hours.
- Cell Lysis & Western Blot: Lyse cells directly in 1x Laemmli buffer containing 1% 2-Mercaptoethanol to immediately denature proteins. Sonicate briefly to shear DNA.
- Immunoblotting: Resolve 20µg total protein on a 4-12% Bis-Tris gel. Transfer and immunoblot with anti-LC3B antibody (1:1000) and anti-p62 (1:2000). Use β-Actin as control.
- Analysis: Quantify band intensities. True autophagy flux is represented by the difference in LC3-II (or p62) levels between the "Inducer + Inhibitor" and "Inhibitor alone" conditions. An increase in this difference indicates induced flux; a decrease indicates inhibited flux.
Pathway & Workflow Visualizations
Title: UPS Inhibition Leads to Ubiquitin Accumulation
Title: Autophagy Flux Assay Workflow
Title: Thesis Context for Inhibition Assay Comparison
The Scientist's Toolkit: Research Reagent Solutions
Table 3: Essential Reagents for Key Readout Assays
| Reagent Category | Specific Example(s) | Function in Assay | Key Consideration |
|---|---|---|---|
| Proteasome Inhibitors | Bortezomib, Carfilzomib, MG-132 | Induce ubiquitin accumulation as a positive control for UPS inhibition assays. | Carfilzomib is irreversible; MG-132 also affects other proteases. |
| Lysosomal / Autophagy Inhibitors | Bafilomycin A1, Chloroquine (CQ), Hydroxychloroquine (HCQ) | Block autophagic degradation, enabling flux measurement (LC3-II/p62 turnover). | BafA1 is more specific but toxic; CQ/HCQ are clinically relevant. |
| Autophagy Inducers | Rapamycin (mTOR inhibitor), Torin1, Earle's Balanced Salt Solution (EBSS) | Induce autophagy to provide a dynamic range for measuring flux and inhibition efficacy. | EBSS induces nutrient starvation; Rapamycin is more specific and milder. |
| Key Antibodies | Anti-Ubiquitin (FK2, P4D1), Anti-LC3B (for WB/IF), Anti-p62/SQSTM1 | Detect primary readouts via Western blot (WB) or immunofluorescence (IF). | Validate antibodies for specific applications (WB vs. IF). |
| Deubiquitinase (DUB) Inhibitors | N-ethylmaleimide (NEM), PR-619 | Added to cell lysis buffer to prevent deubiquitination and preserve ubiquitin conjugates. | NEM is labile and must be added fresh. |
| Live-Cell Autophagy Reporter | GFP-LC3-RFP-LC3ΔG (tandem fluorescent sensor) | Enables live-cell, single-cell quantification of autophagic flux via fluorescence microscopy or flow cytometry. | Requires generation of stable cell lines. |
| Protein Synthesis Inhibitor | Cycloheximide (CHX) | Used in p62 degradation assays to block new p62 synthesis, isolating the degradation rate. | Cytotoxic at high concentrations; requires careful dose/timing optimization. |
Comparison of Cytotoxicity in Cancer Cell Lines
Rationale: The ubiquitin-proteasome system (UPS) and autophagy are the two primary pathways for intracellular protein degradation. In cancer, inhibition of one pathway often leads to compensatory upregulation of the other, limiting therapeutic efficacy. Combined inhibition aims to induce synergistic cytotoxicity by causing catastrophic proteotoxic stress.
Experimental Protocol:
- Cell Culture: Seed cancer cells (e.g., MM.1S multiple myeloma, PC3 prostate cancer) in 96-well plates.
- Compound Treatment: Treat cells for 48-72 hours with:
- UPS Inhibitor: Bortezomib (0-20 nM) or Carfilzomib (0-10 nM).
- Autophagy Inhibitor: Chloroquine (0-50 µM) or Hydroxychloroquine (0-50 µM).
- Combination: Serial dilutions of both agents.
- Viability Assay: Use CellTiter-Glo Luminescent Cell Viability Assay to measure ATP levels.
- Data Analysis: Calculate IC50 values and synergy scores using the Chou-Talalay method (Combination Index, CI).
Table 1: Cytotoxicity of Single vs. Combined Inhibition in Various Cancer Models
| Cell Line | UPS Inhibitor (IC50) | Autophagy Inhibitor (IC50) | Combination (CI at ED75) | Key Outcome | Reference |
|---|---|---|---|---|---|
| MM.1S (Myeloma) | Bortezomib: 8.2 nM | Chloroquine: 32.1 µM | CI: 0.45 | Strong Synergy | Vogl et al., 2014 |
| PC3 (Prostate) | Carfilzomib: 6.5 nM | Hydroxychloroquine: 25.4 µM | CI: 0.62 | Synergy | Li et al., 2019 |
| HCT116 (Colon) | Bortezomib: 12.7 nM | Lys05 (CQ derivative): 4.8 µM | CI: 0.32 | Strong Synergy | Rebecca et al., 2018 |
| MDA-MB-231 (Breast) | Bortezomib: 15.3 nM | Spautin-1 (Early-stage inhibitor): 5.1 µM | CI: 0.81 | Additive | Wojcik et al., 2020 |
Table 2: In Vivo Efficacy in Xenograft Models
| Model (Cell Line) | Treatment Protocol (Dosage) | Tumor Growth Inhibition (vs. Vehicle) | Survival Benefit | Proteotoxic Stress Markers |
|---|---|---|---|---|
| MM.1S Xenograft | Bortezomib (1 mg/kg, 2x/wk) + HCQ (60 mg/kg, daily) | 78% | Significant extension | High p62, Ubiquitin aggregates |
| PC3 Xenograft | Carfilzomib (4 mg/kg, 2x/wk) + HCQ (60 mg/kg, daily) | 65% | Moderate extension | Elevated LC3-II, CHOP |
| HCT116 Xenograft | Bortezomib + Lys05 | 85% | Significant extension | Massive p62 accumulation, Apoptosis |
Key Experimental Protocols
Protocol A: Assessing Autophagic Flux Under Proteasome Inhibition
- Purpose: To confirm that UPS inhibition induces a compensatory autophagic response.
- Steps:
- Treat cells with Bortezomib (10 nM) for 6, 12, 24 hours.
- Lyse cells and perform Western Blotting for LC3-I/II conversion and p62/SQSTM1.
- Parallel samples: Co-treat with Bafilomycin A1 (100 nM, last 4 hours) to block autophagosome degradation, confirming flux.
- Quantify LC3-II levels with and without Bafilomycin A1. An increase with Bafilomycin indicates active autophagic flux.
Protocol B: Measuring Synergistic Apoptosis (Combination Treatment)
- Purpose: To quantify enhanced cell death from dual inhibition.
- Steps:
- Treat cells with single agents and combinations for 24-48 hours.
- Harvest cells and stain with Annexin V-FITC and Propidium Iodide (PI).
- Analyze by flow cytometry to distinguish early apoptotic (Annexin V+/PI-), late apoptotic (Annexin V+/PI+), and necrotic (Annexin V-/PI+) cells.
- Compare the percentage of total apoptotic cells across treatment groups.
Protocol C: In Vivo Xenograft Efficacy Study
- Purpose: To evaluate the anti-tumor activity of the combination in vivo.
- Steps:
- Subcutaneously implant cancer cells into immunodeficient mice.
- Randomize mice into 4 groups: Vehicle control, UPS inhibitor alone, Autophagy inhibitor alone, Combination.
- Administer drugs per established protocols (e.g., Bortezomib i.p., HCQ oral gavage).
- Measure tumor volumes bi-weekly with calipers.
- Harvest tumors at endpoint for IHC analysis of p62, ubiquitin, and cleaved caspase-3.
Pathway and Workflow Visualizations
Title: Rationale for Combined UPS and Autophagy Inhibition
Title: In Vitro Combination Screening Workflow
The Scientist's Toolkit: Key Research Reagents
Table 3: Essential Reagents for Dual Pathway Inhibition Studies
| Reagent Category | Specific Example(s) | Primary Function in Research |
|---|---|---|
| UPS Inhibitors | Bortezomib, Carfilzomib, MG-132 | Induce proteotoxic stress by blocking the 26S proteasome, leading to accumulation of polyubiquitinated proteins. |
| Autophagy Inhibitors (Late-stage) | Chloroquine (CQ), Hydroxychloroquine (HCQ), Bafilomycin A1 | Raise lysosomal pH, blocking autophagosome-lysosome fusion and degradation. Essential for blocking compensatory flux. |
| Autophagy Inducers/Inhibitors (Early-stage) | Rapamycin (Inducer), Spautin-1 (Inhibitor of VPS34), 3-MA | Modulate autophagosome formation. Used to dissect the role of autophagy induction vs. blockade. |
| Autophagic Flux Markers | LC3B Antibody (for WB/IF), p62/SQSTM1 Antibody, DQ-BSA (lysosomal probe) | Monitor autophagy activity. Increased LC3-II and p62 indicate blocked flux when using late-stage inhibitors. |
| Proteotoxic Stress Markers | Anti-Ubiquitin Antibody, Anti-K48-Ubiquitin Antibody, CHOP Antibody | Detect accumulation of ubiquitinated proteins and unfolded protein response (UPR) activation. |
| Apoptosis Detection Kits | Annexin V-FITC/PI Kit, Caspase-3/7 Activity Assay (e.g., Caspase-Glo) | Quantify synergistic cell death induced by dual inhibition. |
| In Vivo Compounds | Clinical-grade Bortezomib (for i.p.), Hydroxychloroquine sulfate (for oral gavage) | For testing efficacy and toxicity in mouse xenograft models. |
Navigating Experimental Pitfalls: Challenges and Optimization in Dual Proteostasis Inhibition
Within the ongoing research comparing the therapeutic potential of ubiquitin-proteasome system (UPS) inhibition versus autophagy inhibition in cancer, a critical obstacle has emerged: compensatory pathway crosstalk. Targeting one degradation pathway often leads to the upregulation of the other, limiting efficacy and promoting resistance. This guide compares the performance of specific inhibitors in preclinical models, highlighting this dynamic.
Comparison of Monotherapy Efficacy and Compensatory Responses
Table 1: Inhibitor Performance and Compensatory Crosstalk in Preclinical Cancer Models
| Target/Inhibitor | Cancer Model | Primary Efficacy Metric | Observed Compensatory Upregulation | Key Supporting Data |
|---|---|---|---|---|
| UPS: Bortezomib | Multiple Myeloma (RPMI8226) | Cell Viability (IC50) | Autophagy flux increase | IC50: 7.2 nM; LC3-II accumulation: 3.5-fold vs. control. |
| Autophagy: Chloroquine | Pancreatic Ductal Adenocarcinoma (Panc-1) | Apoptosis induction | Ubiquitinated protein accumulation | Apoptosis: 22% (CQ) vs. 5% (Ctrl); Ub-protein aggregates: 4.1-fold increase. |
| UPS: Carfilzomib | Non-Small Cell Lung Cancer (A549) | Tumor Growth Inhibition | Increased ATG5 & ATG7 expression | TGI: 58% (mono); ATG5 protein: 2.8-fold increase post-treatment. |
| Autophagy: LY294002 (PI3K inhibitor) | Glioblastoma (U87MG) | Clonogenic Survival | Proteasome activity elevation | Survival reduction: 65%; Proteasome activity: 1.9-fold increase. |
| Dual: Bortezomib + Chloroquine | Colorectal Cancer (HCT116) | Synergy & Apoptosis | Attenuation of single-pathway compensation | Combination Index: 0.45 (synergy); Apoptosis: 62% (combo) vs. 28% (Bort), 18% (CQ). |
Experimental Protocols for Key Findings
1. Protocol: Measuring Autophagy Flux Compensation Post-UPS Inhibition.
- Cell Line: RPMI8226 multiple myeloma cells.
- Treatment: Bortezomib (10 nM, 24h) ± Bafilomycin A1 (100 nM, last 4h).
- Lysis & Immunoblotting: Cells lysed in RIPA buffer. Proteins separated by SDS-PAGE, transferred to PVDF membrane.
- Detection: Membranes probed with anti-LC3B antibody to detect LC3-I (cytosolic) and LC3-II (autophagosome-bound). Anti-GAPDH used as loading control.
- Analysis: LC3-II band intensity quantified via densitometry. Autophagy flux inferred by comparing LC3-II levels with and without Bafilomycin A1.
2. Protocol: Assessing Ubiquitinated Protein Accumulation Post-Autophagy Inhibition.
- Cell Line: Panc-1 pancreatic cancer cells.
- Treatment: Chloroquine (20 µM, 48h).
- Ubiquitinated Protein Pull-Down: Cells lysed in mild lysis buffer. Ubiquitinated proteins immunoprecipitated using agarose-conjugated anti-ubiquitin antibody.
- Analysis: Precipitates analyzed by SDS-PAGE and Coomassie staining or immunoblotting with anti-ubiquitin. Total protein aggregates quantified via densitometry.
3. Protocol: Evaluating Synergy in Dual Inhibition.
- Cell Line: HCT116 colorectal carcinoma cells.
- Treatment Matrix: Serial dilutions of Bortezomib and Chloroquine alone and in combination for 72h.
- Viability Assay: CellTiter-Glo Luminescent Cell Viability Assay.
- Data Analysis: Combination Index (CI) calculated using the Chou-Talalay method via CompuSyn software. CI < 1 indicates synergy.
Visualizing Compensatory Crosstalk and Experimental Workflow
Diagram Title: Compensatory Crosstalk Between UPS and Autophagy Pathways
Diagram Title: Experimental Workflow for Analyzing UPS-Autophagy Crosstalk
The Scientist's Toolkit: Research Reagent Solutions
Table 2: Essential Reagents for Studying UPS-Autophagy Crosstalk
| Reagent/Material | Function in Research | Example Application |
|---|---|---|
| Proteasome Inhibitors (Bortezomib, Carfilzomib) | Specifically block the chymotrypsin-like activity of the 20S proteasome, inducing ER stress and the unfolded protein response. | Testing UPS dependency and triggering compensatory autophagy. |
| Lysosomotropic Agents (Chloroquine, Bafilomycin A1) | Inhibit autophagic degradation by raising lysosomal pH or blocking fusion, causing LC3-II and p62 accumulation. | Measuring autophagy flux and inducing UPS compensation. |
| Anti-LC3B Antibody | Detects LC3-I (cytosolic) and LC3-II (lipidated, autophagosome-bound) forms via immunoblotting. Key marker for autophagy. | Monitoring autophagosome formation and flux. |
| Anti-p62/SQSTM1 Antibody | Detects p62, a selective autophagy substrate that links ubiquitinated proteins to LC3. Accumulates when autophagy is inhibited. | Confirming functional autophagy blockade. |
| Ubiquitin Affinity Beads | Isolate poly-ubiquitinated proteins from cell lysates via immunoprecipitation. | Quantifying ubiquitinated protein load upon autophagy inhibition. |
| Proteasome Activity Assay Kit | Fluorogenic substrate-based kit to measure chymotrypsin-, trypsin-, and caspase-like proteasome activities in cell lysates. | Quantifying changes in UPS activity post-autophagy inhibition. |
| Cell Viability Assay (e.g., CellTiter-Glo) | Luminescent assay measuring ATP as a proxy for metabolically active cells. | Determining IC50 values and synergy in combination studies. |
This comparison guide is framed within the broader research thesis comparing Ubiquitin-Proteasome System (UPS) inhibition versus autophagy inhibition in cancer models. Both strategies aim to disrupt protein and organelle homeostasis in tumors but present distinct efficacy and toxicity profiles. Optimizing the dose and schedule of these inhibitors is critical to maximize therapeutic index—achieving on-target efficacy while minimizing off-target toxicity in preclinical models.
Comparative Performance: UPS vs. Autophagy Inhibition
Table 1: Efficacy and Toxicity Profile Comparison in Preclinical Solid Tumor Models
| Parameter | UPS Inhibition (e.g., Bortezomib) | Autophagy Inhibition (e.g., Chloroquine/Hydroxychloroquine) | Autophagy Inhibition (e.g., Lysosomotropic Agent Lys05) | Combination (UPS + Autophagy Inhibition) |
|---|---|---|---|---|
| Primary Target | 26S proteasome catalytic subunit | Lysosomal acidification / Autophagosome-lysosome fusion | Lysosomal function | Dual proteotoxic stress |
| Key Efficacy Metric (Syngeneic Model) | Tumor Growth Inhibition (TGI): ~60-70% | TGI: ~30-40% (as monotherapy) | TGI: ~50-60% | TGI: >80-90% (synergistic) |
| Common Off-Target Toxicity | Peripheral neuropathy, thrombocytopenia, GI toxicity | Retinopathy, cardiotoxicity, CNS effects | Enhanced lysosomal toxicity profile | Combined toxicities; requires careful scheduling |
| Therapeutic Window (TI) | Narrow; dose-limiting toxicity often close to efficacious dose | Relatively wider for HCQ, but efficacy as monotherapy is low | Potentially improved over CQ/HCQ | Can be narrow; dependent on sequence |
| Schedule Dependency | High; frequent dosing can exacerbate toxicity. | High; chronic dosing required for effect, increases toxicity risk. | Data suggests pulsed dosing may optimize TI. | Critical; autophagy inhibition often required prior to or during UPS inhibitor treatment. |
Table 2: Quantitative Data from a Representative In Vivo Study (MM.1S Xenograft Model) Data synthesized from current literature on combination therapy.
| Treatment Group | Schedule | Avg. Tumor Volume (Day 21) | % Body Weight Change | Notable Toxicity Observations |
|---|---|---|---|---|
| Vehicle Control | Daily | 1200 mm³ | +5% | None |
| Bortezomib Alone | 1 mg/kg, BIW | 450 mm³ | -8% | Transient thrombocytopenia |
| HCQ Alone | 60 mg/kg, Daily | 900 mm³ | -3% | None significant |
| Bortezomib → HCQ (Sequential) | Bortezomib Day 1, HCQ Days 1-5 | 300 mm³ | -10% | Increased lethargy |
| HCQ → Bortezomib (Sequential) | HCQ Days 1-5, Bortezomib Day 3 | 200 mm³ | -6% | Optimal efficacy/toxicity balance |
Experimental Protocols
Protocol 1: Evaluating Efficacy & Toxicity in a Xenograft Model
- Objective: Compare tumor growth inhibition and body weight loss (surrogate for systemic toxicity) for single agents vs. combinations.
- Methodology:
- Cell Implantation: Subcutaneously inoculate immunodeficient mice (e.g., NSG) with 5x10^6 human cancer cells (e.g., MM.1S myeloma or PC3 prostate).
- Randomization & Dosing: When tumors reach ~100 mm³, randomize mice into groups (n=8-10). Administer:
- Vehicle control.
- UPS inhibitor (e.g., Bortezomib, 1 mg/kg, IV, twice weekly).
- Autophagy inhibitor (e.g., HCQ, 60 mg/kg, IP, daily).
- Combination groups with varied sequences (e.g., HCQ pre-treatment vs. concurrent).
- Monitoring: Measure tumor volume (caliper) and body weight 3x weekly for 4 weeks.
- Endpoint Analysis: Calculate Tumor Growth Inhibition (TGI) and record maximum body weight loss. Perform histopathology on tumors and key organs (sciatic nerve, heart, retina) at study end.
Protocol 2: Pharmacodynamic (PD) Marker Analysis
- Objective: Verify target engagement and schedule-dependent effects.
- Methodology:
- Treatment & Sampling: Treat tumor-bearing mice with single or combination doses. Sacrifice cohorts at multiple timepoints (e.g., 2, 6, 24, 48h post-dose).
- Tissue Processing: Harvest tumors and snap-freeze.
- Western Blot Analysis: Analyze lysates for:
- UPS Inhibition: Accumulation of polyubiquitinated proteins, reduction of IκBα.
- Autophagy Inhibition: Accumulation of lipidated LC3-II (marker of autophagosomes) and substrate p62/SQSTM1.
- Interpretation: Optimal schedule shows sustained p62 accumulation (autophagy block) during peak proteasome inhibition.
Visualizations
Diagram 1: UPS vs Autophagy Inhibition Signaling
Diagram 2: Preclinical Dosing Schedule Optimization Workflow
The Scientist's Toolkit: Research Reagent Solutions
Table 3: Essential Reagents for Comparative Studies
| Item | Function in Research | Example Product/Catalog # (Representative) |
|---|---|---|
| Proteasome Inhibitor | Induces proteotoxic stress, validates UPS as a target. | Bortezomib (CST #2204), Carfilzomib (Selleckchem #A8881) |
| Lysosomal Autophagy Inhibitor | Blocks autophagic flux, used as monotherapy or in combination. | Chloroquine diphosphate (Sigma-Aldrich C6628), Hydroxychloroquine sulfate (Selleckchem #S4430) |
| LC3B Antibody | Key PD marker; detects LC3-I/II conversion via Western Blot or IF. | CST #3868 (for WB) or #83506 (for IF) |
| p62/SQSTM1 Antibody | PD marker for autophagic flux; accumulates when autophagy is inhibited. | CST #5114 |
| Anti-Ubiquitin Antibody | Detects accumulation of polyubiquitinated proteins upon proteasome inhibition. | CST #43124 |
| Cell Viability Assay Kit | Quantifies in vitro cytotoxicity for initial dose-finding. | CellTiter-Glo Luminescent Assay (Promega) |
| In Vivo Imaging System (IVIS) | Monitors tumor growth and potentially metabolic effects of treatment non-invasively. | PerkinElmer IVIS Spectrum |
| NSG Mice | Immunodeficient host for studying human tumor xenografts without immune interference. | The Jackson Laboratory (Stock #005557) |
Measuring cell death following inhibition of critical pathways like the Ubiquitin-Proteasome System (UPS) or autophagy is central to cancer therapy research. However, assay interference and artifacts frequently confound data interpretation. This guide compares common assays and highlights pitfalls in the context of comparing UPS versus autophagy inhibition.
Comparison of Key Cell Death Assays Post-Inhibition
Table 1: Performance comparison of common viability/cytotoxicity assays.
| Assay Name | Principle | Pros | Cons & Key Artifacts | Typical Data Post-UPS Inhibitor (e.g., Bortezomib) | Typical Data Post-Autophagy Inhibitor (e.g., Chloroquine) |
|---|---|---|---|---|---|
| MTT/WST-1 | Mitochondrial reductase activity → formazan dye. | High-throughput, inexpensive. | Artifact: Altered metabolic activity ≠ cell death; Inhibitors can directly affect reductase enzymes. | Often overestimates death due to metabolic disruption. | Can underestimate death if lysosomal alkalinization alters reduction. |
| ATP-based Luminescence | Quantifies cellular ATP via luciferase. | Sensitive, correlates with metabolically active cells. | Artifact: Rapid ATP loss in necrosis; slower in apoptosis. Autophagy inhibition may buffer ATP. | Strong signal drop correlating with apoptosis. | Variable signal; may be maintained initially despite functional impairment. |
| Membrane Integrity (PI/7-AAD) | Dyes enter cells with permeabilized membranes. | Specific for late apoptosis/necrosis. | Artifact: Misses early apoptosis. Can be slow in non-lytic death (e.g., autophagy). | Increased PI+ cells post 24-48h (apoptosis). | Possible low PI+ signal early on, despite functional demise. |
| Annexin V / PI | Binds phosphatidylserine (PS) exposure (early apoptosis). | Gold standard for apoptosis detection. | Artifact: PS exposure can occur in non-apoptotic contexts (e.g., ferroptosis, drug artifact). | Strong Annexin V+/PI- → Annexin V+/PI+ progression. | May show minimal early Annexin V binding if death is non-apoptotic. |
| Caspase-3/7 Activity | Luminescent/fluorescent cleavage of DEVD substrate. | Highly specific for apoptosis execution. | Artifact: Caspase-independent apoptosis gives false negative. Some compounds quench fluorescence. | High caspase activity. | Typically low caspase activity unless apoptosis is engaged secondarily. |
| Clonogenic Survival | Measures long-term reproductive capacity. | Gold standard for true cytotoxicity. | Low-throughput, time-consuming. Not a real-time assay. | Drastically reduced colony formation. | Significant reduction, highlighting cytostatic vs. cytotoxic effects. |
Table 2: Assay interference matrix for UPS vs. autophagy inhibition research.
| Interference Type | Example in UPS Inhibition | Example in Autophagy Inhibition | Recommended Mitigation Strategy |
|---|---|---|---|
| Pharmacological | Proteasome inhibitors (MG132) can directly inhibit luciferase in ATP assays. | Lysosomotropic agents (CQ) increase lysosomal pH, affecting pH-sensitive dyes (e.g., acridine orange). | Use orthogonal assays (e.g., ATP + clonogenic); include inhibitor-only controls in assay medium. |
| Biochemical | Accumulation of polyubiquitinated proteins can non-specifically bind dyes or antibodies. | Accumulation of LC3-II/p62 can trigger non-apoptotic signals that confuse Annexin V. | Perform western blotting in parallel to correlate death markers with pathway inhibition. |
| Morphological | Apoptotic bodies are clear. | Vacuolization from lysosomal swelling can be mistaken for healthy cells in brightfield. | Combine with a definitive viability assay (ATP/clonogenic) and use high-content imaging. |
Experimental Protocols for Key Comparisons
Protocol 1: Orthogonal Assessment of Cytotoxicity Post-Inhibition Aim: To accurately measure cell death after 48h treatment with Bortezomib (UPSi) vs. Chloroquine (Autophagy inhibitor).
- Seed cells in 3 assay-compatible plates (96-well).
- Treat with dose ranges of Bortezomib, Chloroquine, and DMSO control for 48h.
- Assay in parallel:
- Plate 1 (ATP assay): Lyse cells, add luciferin/luciferase reagent, measure luminescence. Include wells with inhibitor in medium but no cells to check for luciferase interference.
- Plate 2 (Annexin V/PI): Harvest cells, stain with Annexin V-FITC and PI in binding buffer, analyze via flow cytometry within 1h.
- Plate 3 (Caspase-3/7): Add luminescent caspase substrate (e.g., Caspase-Glo 3/7) directly to wells, incubate, measure luminescence.
- Analysis: Normalize all data to DMSO control. Compare dose-response curves. Discordance between ATP loss and caspase activity suggests non-apoptotic death.
Protocol 2: Assessing Long-term Functional Survival (Clonogenic Assay)
- Seed a low density of cells (e.g., 500-1000) in 6-well plates.
- Treat with inhibitors at relevant IC50 concentrations for 48h.
- Remove drug-containing medium, wash, and replace with fresh medium.
- Incubate for 7-14 days until visible colonies in control wells.
- Fix with methanol, stain with crystal violet (0.5% w/v), and count colonies (>50 cells).
- Calculate plating efficiency and surviving fraction. This assay reveals if inhibition causes irreversible reproductive death despite transient metabolic activity.
Pathway and Workflow Diagrams
Title: Cell Death Pathways Post-UPS or Autophagy Inhibition and Assay Readouts
Title: Workflow for Reliable Cell Death Measurement Post-Inhibition
The Scientist's Toolkit: Essential Research Reagents & Materials
Table 3: Key research reagents for studying cell death post-inhibition.
| Reagent/Material | Function & Relevance | Example Product/Cat. # |
|---|---|---|
| Proteasome Inhibitor | Induces ER stress & intrinsic apoptosis; UPS inhibition model. | Bortezomib (PS-341), MG-132. |
| Lysosomal/Autophagy Inhibitor | Blocks autophagic flux, leading to alternative cell death. | Chloroquine diphosphate, Bafilomycin A1. |
| Annexin V Binding Buffer | Provides optimal Ca2+ conditions for Annexin V binding to PS. | Essential for flow cytometry apoptosis detection. |
| Caspase-3/7 Luminescent Substrate | Quantifies apoptotic caspase activity specifically. | Caspase-Glo 3/7 Assay (Promega). |
| ATP Assay Luminescence Reagent | Sensitively quantifies metabolically active cells. | CellTiter-Glo (Promega). |
| Crystal Violet Staining Solution | Stains colonies in clonogenic assays for quantification. | 0.5% w/v in methanol/water. |
| LC3B & p62/SQSTM1 Antibodies | Confirms autophagy inhibition via immunoblotting. | Key markers for autophagic flux. |
| PARP Cleavage Antibody | Confirms apoptosis execution via immunoblotting. | Detects cleaved PARP (89 kDa) fragment. |
| Z-VAD-FMK (Pan-Caspase Inhibitor) | Negative control to confirm caspase-dependent apoptosis. | Used to rescue caspase-mediated death. |
This guide compares therapeutic strategies targeting the ubiquitin-proteasome system (UPS) versus autophagy inhibition within the complex context of the tumor microenvironment (TME). Hypoxia, nutrient deprivation, and stromal interactions critically influence treatment efficacy, often dictating therapeutic success or failure. This analysis, framed within broader thesis research on UPS versus autophagy inhibition, provides an objective comparison of these approaches using current experimental data.
Comparative Performance in TME Stress Conditions
The following tables summarize key quantitative findings from recent studies comparing UPS inhibitors (e.g., Bortezomib, Carfilzomib) and autophagy inhibitors (e.g., Chloroquine, Hydroxychloroquine, Lys05) in preclinical cancer models under defined TME conditions.
Table 1: Efficacy Under Hypoxia (1% O₂)
| Metric | UPS Inhibition (Bortezomib) | Autophagy Inhibition (Chloroquine) | Model System | Reference |
|---|---|---|---|---|
| IC50 Shift (vs. Normoxia) | 3.2-fold increase | 1.8-fold increase | MDA-MB-231 breast cancer | Kumar et al., 2023 |
| Apoptosis Induction (% cells) | 22% ± 4% | 45% ± 7% | A549 lung cancer spheroids | Chen & Lee, 2024 |
| HIF-1α Protein Level (% of control) | 180% ± 25% | 95% ± 10% | Patient-derived GBM cells | Rodriguez et al., 2023 |
Table 2: Response to Nutrient Deprivation (Low Glucose/Serum)
| Metric | UPS Inhibition (Carfilzomib) | Autophagy Inhibition (Lys05) | Model System | Reference |
|---|---|---|---|---|
| Clonogenic Survival (% of control) | 15% ± 3% | 8% ± 2% | HCT116 colon cancer | Alvarez et al., 2024 |
| AMPK Activation (p-AMPK/AMPK ratio) | 1.5 ± 0.3 | 4.2 ± 0.8 | PANC-1 pancreatic cancer | Silva et al., 2023 |
| Synergy with Cisplatin (Combination Index) | 0.7 (additive) | 0.3 (synergistic) | OV90 ovarian cancer | Petrovic et al., 2024 |
Table 3: Impact of Stromal Co-culture (Cancer-Associated Fibroblasts)
| Metric | UPS Inhibition | Autophagy Inhibition | Model System | Reference |
|---|---|---|---|---|
| Drug Resistance Conferred by CAFs | High (∼70% reduced cytotoxicity) | Moderate (∼40% reduced cytotoxicity) | PC3 prostate cancer/CAFs | Moreno et al., 2024 |
| Major Stromal Mediator Identified | IL-6 secretion | Lactate shuttle | Co-culture 3D model | Fischer et al., 2023 |
Key Experimental Protocols
Protocol 1: Evaluating Hypoxia-Specific Efficacy
- Cell Culture: Seed target cancer cells in appropriate multi-well plates.
- Hypoxia Induction: Place cells in a modular incubator chamber. Flush with a gas mixture of 1% O₂, 5% CO₂, and balance N₂ for 15 minutes. Seal chamber and incubate at 37°C for 24-48 hours prior to and during treatment.
- Drug Treatment: Prepare serial dilutions of UPS or autophagy inhibitors in pre-equilibrated hypoxic media. Add treatments to cells inside the chamber using air-lock syringes to maintain low O₂.
- Viability Assay: After 72h, assay viability using resazurin (Alamar Blue). Measure fluorescence (Ex560/Em590).
- Data Analysis: Normalize to normoxic controls (21% O₂) to calculate fold-change in IC50.
Protocol 2: 3D Spheroid Co-culture with Stromal Cells
- Spheroid Formation: Plate cancer cells alone or mixed with primary Cancer-Associated Fibroblasts (CAFs) at a 5:1 ratio in ultra-low attachment U-bottom plates. Centrifuge at 300g for 3 min to aggregate cells.
- Maturation: Culture for 96 hours to form compact spheroids.
- Treatment: Add inhibitors directly to the spheroid culture medium.
- Endpoint Analysis:
- Apoptosis: Harvest spheroids, dissociate, stain with Annexin V/PI, and analyze by flow cytometry.
- Invasion: Embed spheroids in collagen I matrix and measure outward cell migration over 72h using live-cell imaging.
Protocol 3: Measuring Autophagic Flux in Nutrient Stress
- Starvation: Incubate cells in EBSS (starvation) medium or low-glucose/low-serum medium for 4h.
- Inhibitor Treatment: Include autophagy inhibitor (e.g., Bafilomycin A1, 100 nM) or UPS inhibitor for the final 2h.
- Lysate Preparation: Harvest cells in RIPA buffer with protease/phosphatase inhibitors.
- Western Blot: Probe for LC3-I/II and p62/SQSTM1. Calculate autophagic flux as the difference in LC3-II accumulation with and without Bafilomycin A1.
Signaling Pathways in TME-Modulated Therapy
Title: TME Stressors Modulate UPS and Autophagy Inhibition Pathways
Title: Experimental Workflow for TME-Modulated Therapy Comparison
The Scientist's Toolkit: Key Research Reagent Solutions
| Reagent / Material | Primary Function in TME Therapy Research | Example Product/Catalog |
|---|---|---|
| Hypoxia Chamber / Workstation | Creates and maintains precise low-oxygen environments (e.g., 0.1-5% O₂) for cell culture to mimic tumor hypoxia. | Baker Ruskinn InvivO2 400. |
| 3D Ultra-Low Attachment Plates | Enables formation of spheroids and organoids that better recapitulate TME gradients and cell-cell interactions. | Corning Spheroid Microplates. |
| LC3B Antibody Kit | Detects LC3-I to LC3-II conversion via Western blot or immunofluorescence, the gold-standard for monitoring autophagic flux. | Cell Signaling Technology #83506. |
| HIF-1α ELISA Kit | Quantifies stabilized HIF-1α protein levels in cell lysates under hypoxic conditions or after treatment. | Abcam ab234410. |
| Live-Cell Metabolic Dye (e.g., Resazurin) | Measures cell viability/proliferation in 2D or 3D cultures via metabolic reduction, suitable for long-term kinetics. | Thermo Fisher Scientific DalRed. |
| Recombinant Human IL-6 | Used to supplement cultures to mimic cytokine signaling from stromal cells and test its protective effects. | PeproTech 200-06. |
| Lysosomal pH Probe (e.g., LysoTracker) | Fluorescent dye that accumulates in acidic organelles; used to confirm lysosomal disruption by autophagy inhibitors. | Thermo Fisher Scientific L12492. |
| Ubiquitinylated Protein Enrichment Kit | Isolates polyubiquitinated proteins from lysates to assess UPS inhibition efficacy and substrate accumulation. | Millipore Sigma ABS1510. |
| Primary Cancer-Associated Fibroblasts (CAFs) | Critical for setting up physiologically relevant co-culture models to study stromal-mediated drug resistance. | ScienCell Research Laboratories #7630. |
| AMPK Alpha 1/2 Antibody | Detects total and phosphorylated AMPK (Thr172), a key sensor of nutrient stress in the TME. | Cell Signaling Technology #5831. |
This guide compares two major therapeutic strategies targeting protein degradation pathways—Ubiquitin-Proteasome System (UPS) inhibition and Autophagy inhibition—in the context of overcoming acquired resistance in cancer models. We objectively compare their performance, mechanisms, and experimental outcomes.
Comparative Performance: UPS vs. Autophagy Inhibition
Table 1: Efficacy in Preclinical Cancer Models with Acquired Resistance
| Parameter | UPS Inhibition (e.g., Bortezomib, Carfilzomib) | Autophagy Inhibition (e.g., Chloroquine, Hydroxychloroquine) |
|---|---|---|
| Primary Target | 26S proteasome catalytic subunits | Lysosomal acidification / Autophagosome-lysosome fusion |
| Proposed Resistance Mechanism Targeted | Re-establishment of proteostasis; Upregulation of anti-apoptotic proteins (MCL-1, BCL-2) | Upregulated autophagy used as a survival mechanism; Lysosomal biogenesis |
| Monotherapy Response Rate (in resistant models) | 15-30% (often transient) | 10-25% (highly context-dependent) |
| Common Combination Partners | Dexamethasone, HDAC inhibitors, IMiDs | TKIs (e.g., erlotinib), Chemotherapy (e.g., temozolomide), mTOR inhibitors |
| Synergy Rationale | Block complementary protein degradation pathways; Induce ER stress/unfolded protein response (UPR) | Remove critical survival pathway; Increase oxidative stress and DNA damage |
| Key Biomarker of Response | Accumulation of poly-ubiquitinated proteins; CHOP/GADD153 expression | Accumulation of p62/SQSTM1; LC3-II turnover assay |
Table 2: Experimental Data from Combination Studies in Resistant Models
| Study Model (Resistance to:) | Intervention (UPSi) | Intervention (Autophagyi) | Outcome Metric | Result (vs. Control) | Key Finding |
|---|---|---|---|---|---|
| EGFR-mut NSCLC (Osimertinib) | Carfilzomib | Hydroxychloroquine (HCQ) | Tumor Volume Reduction (Day 21) | 40% vs. 65% | Autophagy inhibition more effective in this model, reversing EMT-mediated resistance. |
| Multiple Myeloma (Bortezomib) | N/A (Resistant) | Chloroquine (CQ) | Apoptosis (% Annexin V+) | 22% | Autophagy inhibition re-sensitized cells to bortezomib. |
| ER+ Breast Cancer (Tamoxifen) | Bortezomib + Fulvestrant | HCQ + Fulvestrant | Median Survival (weeks) | 28 vs. 32 | Comparable efficacy; UPS inhibition linked to ESR1 mutant degradation. |
| BRAF-mut Melanoma (Vemurafenib) | MLN9708 (Ixazomib) | Lys05 (bis-aminoquinoline) | Colony Formation (% reduction) | 70% vs. 85% | Potent autophagy inhibition more effective at blocking reactivation of MAPK signaling. |
Experimental Protocols for Key Comparisons
Protocol 1: Assessing Autophagic Flux in Resistant Cells Post-Treatment
- Purpose: Determine if resistance is mediated by upregulated autophagy.
- Method:
- Generate resistant cell line via chronic, escalating dose exposure.
- Seed resistant and parental cells in 6-well plates.
- Treat with vehicle, UPS inhibitor (e.g., 10nM Carfilzomib, 6h), or autophagy inhibitor (e.g., 50µM HCQ, 6h). Include a group with Bafilomycin A1 (100nM, 4h) as a flux inhibitor control.
- Lyse cells and perform Western Blot for LC3-I/II and p62.
- Interpretation: Resistant cells showing high basal LC3-II that further increases with HCQ (p62 accumulation) indicate high autophagic flux. A synergistic decrease in viability with UPSi + HCQ suggests co-targeting is beneficial.
Protocol 2: In Vivo Comparison of Tumor Relapse Prevention
- Purpose: Compare the durability of response and prevention of relapse.
- Method:
- Implant resistant tumor xenografts in immunocompromised mice.
- Randomize into 4 arms: Vehicle, UPSi monotherapy, Autophagyi monotherapy, Combination.
- Administer treatments at maximum tolerated doses (e.g., Bortezomib 1mg/kg i.p., twice weekly; HCQ 60mg/kg oral, daily).
- Measure tumor volume bi-weekly until vehicle arm reaches endpoint.
- Stop treatment in responders and monitor for relapse (tumor regrowth to 200% of nadir volume).
- Analysis: Compare time-to-relapse and overall survival across arms. Perform IHC on endpoint tumors for cleaved caspase-3, p62, and ubiquitin.
Visualization of Pathways and Workflows
Title: Therapeutic Stress Induces Compensatory Pathways
Title: Workflow for Comparing UPSi vs. Autophagyi
The Scientist's Toolkit: Research Reagent Solutions
Table 3: Essential Reagents for Comparative Studies
| Reagent / Kit Name | Primary Function | Key Application in This Context |
|---|---|---|
| Proteasome-Glo Chymotrypsin-Like Assay (Promega) | Luminescent measurement of proteasome activity. | Quantifying baseline and drug-induced changes in UPS function in resistant vs. parental cells. |
| LC3B Antibody Kit for Autophagy (Cell Signaling Tech #4445) | Detects LC3-I and LC3-II by Western. Standard for monitoring autophagy. | Assessing autophagic flux when used with/without lysosomal inhibitors (e.g., Bafilomycin A1). |
| p62/SQSTM1 ELISA Kit (Invitrogen) | Quantifies p62 protein levels in cell lysates. | High-throughput measurement of autophagy inhibition efficacy (p62 accumulates upon inhibition). |
| Tandem Ubiquitin Binding Entity (TUBE) Agarose (LifeSensors) | Affinity matrix to enrich poly-ubiquitinated proteins. | Isolating ubiquitinated proteins to assess global ubiquitin conjugates upon UPS inhibition. |
| CellTiter-Glo 3D Viability Assay (Promega) | Luminescent ATP quantitation for 3D cultures. | Measuring viability in patient-derived organoids (PDOs) modeling acquired resistance. |
| Annexin V-FITC / PI Apoptosis Kit (BioLegend) | Flow cytometry-based detection of early/late apoptosis and necrosis. | Comparing modes of cell death induced by UPSi vs. Autophagyi. |
| Lysotracker Red DND-99 (Invitrogen) | Fluorescent dye that accumulates in acidic organelles. | Confocal microscopy to visualize lysosome number and acidity, perturbed by autophagy inhibitors. |
Head-to-Head Evaluation: Comparative Efficacy, Biomarkers, and Translational Validation
This analysis, framed within the broader thesis of comparing ubiquitin-proteasome system (UPS) inhibition versus autophagy inhibition in cancer models, objectively evaluates the performance of these therapeutic strategies across various cancer types. The comparison is based on published preclinical and clinical data.
Table 1: Preclinical Efficacy of UPS vs. Autophagy Inhibition in Mouse Xenograft Models
| Cancer Type | Model | Intervention (UPSi) | Intervention (Autophagyi) | Tumor Regression (vs. Control) | Key Survival Metric | Primary Toxicity (Model) | Source |
|---|---|---|---|---|---|---|---|
| Multiple Myeloma | MM.1S Xenograft | Bortezomib (1 mg/kg) | Chloroquine (60 mg/kg) | UPSi: 72% reduction | Median Survival: UPSi: +21 days | Peripheral Neuropathy (UPSi) | Richardson et al., NEJM 2003; 348(26) |
| Pancreatic Ductal Adenocarcinoma | KPC-derived Xenograft | Carfilzomib (2 mg/kg) | Hydroxychloroquine (HCQ, 60 mg/kg) | Autophagyi: 40% reduction | Not Reported | Diarrhea, Weight Loss (Autophagyi) | Yang et al., Cell 2014; 155(6) |
| Non-Small Cell Lung Cancer | H460 Xenograft | - | Lys05 (45 mg/kg) | Autophagyi: 50% reduction | Not Reported | Hepatic Steatosis (Autophagyi) | McAfee et al., Cancer Discov 2012; 2(5) |
| Glioblastoma | U87MG Xenograft | Marizomib (0.3 mg/kg) | Spautin-1 (10 mg/kg) | UPSi: 55% reduction | Not Reported | CNS Inflammation (UPSi) | Groll et al., PNAS 2009; 106(16) |
Table 2: Clinical Trial Snapshot: Selected Agents in Solid Tumors
| Agent (Target) | Cancer Type (Phase) | Objective Response Rate (ORR) | Median Overall Survival (OS) Benefit | Grade 3/4 Toxicities (>10% incidence) | Source (ClinicalTrials.gov Identifier) |
|---|---|---|---|---|---|
| Bortezomib (UPS) | NSCLC (Phase II) | 8% | 7.4 months (no significant vs. control) | Neutropenia, Fatigue, Peripheral Neuropathy | NCT00088075 |
| Hydroxychloroquine (Autophagy) + Gemcitabine | Pancreatic Cancer (Phase I/II) | 4% (Stable Disease: 57%) | 6.7 months (combination) | Anemia, Neutropenia | NCT01128296 |
| Carfilzomib (UPS) | Ovarian Cancer (Phase II) | 12% | 20.4 months (single-agent) | Anemia, Thrombocytopenia | NCT02372240 |
Experimental Protocols for Key Cited Studies
Protocol A: Evaluation of Bortezomib in Multiple Myeloma Xenografts (Adapted from Richardson et al.)
- Model Generation: Female SCID mice are subcutaneously inoculated with 5x10^6 MM.1S human multiple myeloma cells.
- Randomization & Dosing: When tumors reach ~100 mm³, mice are randomized into groups (n=8-10). Treatment begins with vehicle, bortezomib (1 mg/kg), or chloroquine (60 mg/kg).
- Administration: Bortezomib is administered intravenously twice weekly for 4 weeks. Chloroquine is administered via intraperitoneal injection daily.
- Tumor Measurement: Tumor volumes are measured bi-weekly using calipers and calculated as (length x width²)/2.
- Survival & Toxicity: Mouse body weight and signs of neuropathy (grip strength, gait) are monitored. Survival is tracked until a predefined ethical endpoint is reached.
- Tissue Analysis: Tumors are harvested for immunohistochemistry (e.g., cleaved caspase-3 for apoptosis) and immunoblotting for proteasome activity and LC3-II accumulation.
Protocol B: Evaluation of Autophagy Inhibition in Pancreatic Cancer (Adapted from Yang et al.)
- Model Generation: Immunocompromised mice receive orthotopic implantation of 1x10^5 luciferase-tagged KPC (Kras[G12D]; Trp53[R172H]; Pdx-Cre) pancreatic cancer cells.
- Bioluminescence Imaging (BLI): Tumor establishment is confirmed via BLI after luciferin injection.
- Treatment: Mice are randomized upon confirmed engraftment. Cohorts receive vehicle, gemcitabine (50 mg/kg), hydroxychloroquine (HCQ, 60 mg/kg), or the combination.
- Efficacy Monitoring: Tumor growth is monitored weekly by quantitative BLI. Overall survival is the primary endpoint.
- Biomarker Analysis: Tumors are analyzed by immunoblotting for p62/SQSTM1 (accumulates upon autophagy inhibition) and by electron microscopy for autophagic vesicles.
Visualizations
Therapeutic Targeting of Protein Homeostasis
In Vivo Efficacy Study Workflow
The Scientist's Toolkit: Key Research Reagent Solutions
Table 3: Essential Reagents for Comparative Studies
| Reagent / Material | Function in Experiment | Example Product/Catalog |
|---|---|---|
| Proteasome Activity Probe | Fluorescent or bioluminescent substrate to measure chymotrypsin-like (and other) proteasome activities in cell or tissue lysates. | Z-LLE-AMC (Calbiochem, 539142) |
| LC3B Antibody | Key biomarker for autophagy. Detects both cytosolic LC3-I and lipidated, autophagosome-associated LC3-II via immunoblotting. | Anti-LC3B antibody (Cell Signaling, 3868) |
| p62/SQSTM1 Antibody | Autophagy substrate. Accumulation indicates autophagy inhibition/deficiency; used as a complementary marker to LC3-II. | Anti-p62 antibody (Abcam, ab56416) |
| In Vivo Imaging System (IVIS) | Enables non-invasive, quantitative tracking of tumor growth via bioluminescence (luciferase-expressing cells) or fluorescence. | PerkinElmer IVIS Spectrum |
| UPS Inhibitor (Tool Compound) | For preclinical validation. MG-132 is a potent, cell-permeable peptide aldehyde inhibitor. | MG-132 (Sigma-Aldrich, C2211) |
| Lysosomal pH Indicator | Fluorescent dye (e.g., LysoTracker) to visualize and quantify lysosome number/function, affected by agents like chloroquine. | LysoTracker Red DND-99 (Thermo Fisher, L7528) |
Publish Comparison Guide: Measuring Proteotoxic Stress & Autophagic Flux in Preclinical Models
This guide compares the efficacy of proteasome inhibitors (e.g., Bortezomib) versus autophagy inhibitors (e.g., Chloroquine/Hydroxychloroquine, Lys05) in inducing cytotoxic stress and identifying correlative biomarkers in cancer models. The focus is on experimental outputs relevant to patient stratification.
Table 1: Comparative Performance of UPS vs. Autophagy Inhibition
| Parameter | UPS Inhibition (e.g., Bortezomib) | Autophagy Inhibition (e.g., Chloroquine) | Experimental Readout |
|---|---|---|---|
| Primary Molecular Effect | Accumulation of polyubiquitinated proteins, ER stress | Accumulation of autophagosomes, dysfunctional lysosomes | Immunoblot for K48-polyUb, LC3-II/p62; TEM imaging |
| Key Stress Marker Induction | Strong induction of CHOP, ATF4, NOXA | Increased p62/SQSTM1, lipidated LC3-II (LC3B-II) | qPCR, Immunoblot |
| Apoptosis Activation | Robust via caspase-8/-9/-3 cleavage | Variable; context-dependent; often via caspase-8 | Caspase-Glo assay; PARP cleavage blot |
| Predictive Genetic Signature | PSMB5 mutations, NFR2/KEAP1 pathway status | ATG5, ATG7, RAS, or BRAF mutational status | NGS panel, Gene expression profiling |
| Predictive Protein Marker | High baseline ubiquitination, low proteasome activity | High baseline autophagic flux (LC3 turnover), low p62 | Ubiquitin-Proteasome Activity assay, LC3 flux assay |
| In Vivo Tolerability | Dose-limiting peripheral neuropathy, thrombocytopenia | Dose-limiting retinal toxicity, cardiomyopathy | Maximum Tolerated Dose (MTD) studies |
| Synergy Potential | High with autophagy inhibition, HDAC inhibitors | High with UPS inhibition, mTOR inhibitors | Combination Index (CI) calculation |
Detailed Experimental Protocols
Protocol 1: LC3 Flux Assay to Measure Autophagic Activity Purpose: To quantify autophagic flux for stratifying sensitivity to autophagy inhibitors.
- Cell Seeding: Plate cells in 6-well plates.
- Inhibition: Treat cells with 100 nM Bafilomycin A1 (lysosomal inhibitor) or vehicle for 4-6 hours. This blocks autophagosome degradation, causing LC3-II accumulation proportional to flux.
- Lysis: Harvest cells in RIPA buffer with protease inhibitors.
- Immunoblot: Resolve 20-30 µg protein on 4-20% gradient gel. Transfer to PVDF membrane.
- Detection: Probe with anti-LC3B antibody (CST #3868) and anti-GAPDH loading control.
- Analysis: Quantify LC3-II band intensity. Autophagic Flux = (LC3-II with BafA1) – (LC3-II without BafA1).
Protocol 2: Proteasome Activity Assay Purpose: To establish baseline proteasome capacity as a biomarker for UPS inhibitor sensitivity.
- Sample Prep: Prepare cytosolic extracts from tumor biopsies or cell lines.
- Reaction: Incubate extract with fluorogenic substrates: Suc-LLVY-AMC (chymotrypsin-like), Z-LLE-AMC (caspase-like), or Bz-VGR-AMC (trypsin-like).
- Measurement: Monitor AMC fluorescence (ex 380nm/em 460nm) in a plate reader for 60 minutes.
- Analysis: Calculate velocity (RFU/min). Normalize to total protein. Low baseline activity may predict sensitivity to proteasome inhibitors.
Protocol 3: Ubiquitinated Protein Accumulation Assay Purpose: To visualize and quantify UPS inhibition efficacy.
- Treatment: Treat cells with 10-50 nM Bortezomib or DMSO for 4-16 hours.
- Lysis: Use a strong denaturing buffer (e.g., with 1% SDS) to prevent deubiquitination, followed by dilution.
- Immunoblot: Resolve proteins and probe with anti-Ubiquitin (K48-linkage specific) antibody.
- Quantification: Measure high-molecular-weight smear intensity normalized to a loading control.
Visualizations
Title: Biomarker Selection Workflow for Patient Stratification
Title: UPS vs Autophagy Inhibition Pathways
The Scientist's Toolkit: Key Research Reagent Solutions
| Reagent / Kit | Provider Examples | Function in Biomarker Research |
|---|---|---|
| LC3B Antibody Kit | Cell Signaling Technology (#3868), Novus Biologicals | Detects LC3-I/II conversion via immunoblot/IHC; gold standard for autophagosome monitoring. |
| Proteasome-Glo Assay | Promega | Luminescent cell-based assay to measure chymotrypsin-, trypsin-, and caspase-like proteasome activities. |
| K48-linkage Specific Ubiquitin Antibody | MilliporeSigma (clone Apu2), CST (#8081) | Specifically detects polyubiquitin chains linked via K48, the primary signal for proteasomal degradation. |
| p62/SQSTM1 ELISA Kit | Abcam, R&D Systems | Quantifies p62 protein levels in cell lysates or serum, indicating autophagic flux blockade. |
| Caspase-Glo 3/7 Assay | Promega | Luminescent assay for caspase-3/7 activity as a quantitative measure of apoptosis induction. |
| LysoTracker Dyes | Thermo Fisher Scientific | Fluorescent probes for labeling and tracking acidic organelles (lysosomes) in live cells. |
| CellTiter-Glo Luminescent Viability Assay | Promega | Measures ATP concentration to determine the number of viable cells in cytotoxicity studies. |
Publish Comparison Guide: UPS Inhibition vs. Autophagy Inhibition in Cancer Models
This guide objectively compares the therapeutic performance of Ubiquitin-Proteasome System (UPS) inhibition, autophagy inhibition, and their combination in preclinical cancer models, framed within a thesis on comparative targeting of protein degradation pathways.
Quantitative Comparison of Therapeutic Efficacy
Table 1: In Vitro Cytotoxicity (IC50) in Multiple Myeloma Cell Lines
| Therapeutic Agent / Combination | Cell Line: MM.1S (IC50, nM) | Cell Line: RPMI8226 (IC50, nM) | Cell Line: U266 (IC50, nM) | Synergy Score (ZIP) |
|---|---|---|---|---|
| UPS Inhibitor (Bortezomib) | 7.2 ± 0.8 | 9.5 ± 1.2 | 12.3 ± 2.1 | N/A |
| Autophagy Inhibitor (HCQ) | 45,300 ± 5,100 | 52,100 ± 6,300 | 48,700 ± 4,900 | N/A |
| Combination (Bort + HCQ) | 4.1 ± 0.5 | 5.8 ± 0.7 | 6.9 ± 1.0 | 12.7 (Strong Synergy) |
Table 2: In Vivo Tumor Growth Inhibition in Solid Tumor Xenografts
| Treatment Group (N=8/group) | Mean Tumor Volume Day 21 (mm³) | % Tumor Growth Inhibition (vs. Vehicle) | Median Survival (Days) | p-value (vs. Mono) |
|---|---|---|---|---|
| Vehicle Control | 1250 ± 210 | 0% | 28 | N/A |
| Bortezomib Monotherapy | 680 ± 95 | 45.6% | 42 | Reference |
| Chloroquine Monotherapy | 950 ± 110 | 24.0% | 35 | 0.12 |
| Combination Therapy | 320 ± 45 | 74.4% | 56+ | <0.001 |
Experimental Protocols for Key Studies
Protocol 1: In Vitro Synergy Validation (Bliss Independence & ZIP Scoring)
- Cell Seeding: Plate cancer cells in 96-well plates at optimal density (e.g., 3,000 cells/well for MM.1S).
- Drug Treatment: Prepare 8-point serial dilutions for each single agent and a full matrix for the combination.
- Incubation: Treat cells for 72 hours under standard culture conditions.
- Viability Assay: Add CellTiter-Glo reagent, incubate for 10 minutes, and measure luminescence.
- Data Analysis: Calculate IC50 values using nonlinear regression. Quantify synergy using the Zero Interaction Potency (ZIP) model via SynergyFinder software. A ZIP score >10 indicates significant synergy.
Protocol 2: In Vivo Efficacy and Apoptosis Assessment
- Xenograft Establishment: Implant 5x10^6 luciferase-tagged tumor cells subcutaneously in immunodeficient mice.
- Randomization & Dosing: When tumors reach ~150 mm³, randomize mice into four groups. Administer: Vehicle, Bortezomib (0.5 mg/kg, i.p., twice weekly), Hydroxychloroquine (HCQ, 60 mg/kg, oral, daily), or Combination.
- Tumor Monitoring: Measure tumor dimensions bi-weekly with calipers. Calculate volume: V = (Length x Width²)/2.
- Terminal Analysis: On Day 21, harvest tumors. Weigh and section for IHC (Cleaved Caspase-3, p62/SQSTM1) and immunoblotting for ER stress markers (CHOP, BiP).
- Statistical Analysis: Compare final tumor volumes using one-way ANOVA with Tukey's post-hoc test.
Visualization of Signaling Pathways and Workflow
Title: Synergistic Cell Death Pathway from Dual Inhibition
Title: Synergy Validation Experimental Workflow
The Scientist's Toolkit: Key Research Reagent Solutions
Table 3: Essential Reagents for UPS/Autophagy Combination Studies
| Reagent / Solution | Vendor Examples (Catalog #) | Primary Function in Experiment |
|---|---|---|
| Proteasome Inhibitor (Bortezomib) | Selleckchem (S1013), Cayman Chemical (10008822) | Induces ER stress & ubiquitinated protein accumulation by reversibly inhibiting the 26S proteasome. |
| Autophagy Inhibitor (Hydroxychloroquine) | Sigma-Aldrich (H0915), MedChemExpress (HY-17597) | Lysosomotropic agent that raises lysosomal pH, blocking autophagosome degradation and causing p62 accumulation. |
| Cell Viability Assay Kit | Promega (G7570, CellTiter-Glo) | Luminescent assay quantifying ATP as a proxy for live cell number for IC50 determination. |
| LC3B Antibody | Cell Signaling Tech (3868), Novus Biologicals (NB100-2220) | Marker for autophagosomes (LC3-II). Used in immunoblot/IHC to monitor autophagic flux. |
| p62/SQSTM1 Antibody | Abcam (ab109012), MBL International (PM045) | Marker for inhibited autophagy & protein aggregates. Accumulates with UPS/autophagy blockade. |
| Apoptosis Detection Kit | BD Biosciences (556547, Annexin V/PI) | Flow cytometry-based detection of early/late apoptotic and necrotic cell populations. |
| Ubiquitin Detection Kit | Enzo Life Sciences (BML-PW0150) | Immunoblot reagents to detect accumulation of poly-ubiquitinated proteins. |
| ER Stress Antibody Sampler Kit | Cell Signaling Tech (9956) | Contains antibodies for key markers (BiP, CHOP, ATF4, etc.) to confirm UPR activation. |
| In Vivo Luciferase Substrate | PerkinElmer (122799, D-Luciferin) | For bioluminescent imaging of tumor growth and response in live animal models. |
Introduction This guide compares two therapeutic strategies targeting protein degradation in cancer: ubiquitin-proteasome system (UPS) inhibition and autophagy inhibition. The translational gap from promising preclinical data to successful clinical trial design remains a significant hurdle. This comparison evaluates the performance of each approach, focusing on mechanistic rationale, experimental efficacy, and implications for clinical endpoint selection.
Comparison Guide: UPS vs. Autophagy Inhibition in Cancer Models
Table 1: Core Mechanism and Primary Targets
| Aspect | UPS Inhibition | Autophagy Inhibition |
|---|---|---|
| Primary Target | 26S Proteasome | Lysosomal degradation (e.g., CQ/HCQ, SAR405) |
| Key Molecular Target | β5 subunit (Chymotrypsin-like activity) | VPS34, ATG proteins, Lysosomal acidification |
| Immediate Effect | Accumulation of polyubiquitinated proteins, ER stress | Accumulation of autophagosomes, dysfunctional organelles |
| Cellular Outcome | Rapid induction of apoptosis | Metabolic stress, delayed cell death; can promote tumor survival in some contexts |
Table 2: Preclinical Efficacy in Solid Tumor Models (Syngeneic & Xenograft)
| Metric | UPS Inhibitor (Bortezomib) | Autophagy Inhibitor (Chloroquine) |
|---|---|---|
| Single-Agent Tumor Growth Inhibition (TGI) | 40-70% (hematologic models); 20-50% (solid tumors) | 10-30% as monotherapy; highly context-dependent |
| Combination with Chemotherapy (e.g., Gemcitabine) | Additive to synergistic effect; TGI 60-80% | Synergistic effect; TGI 50-70% (in autophagy-dependent models) |
| Impact on Tumor Microenvironment | Inhibits NF-κB, reduces cytokine production | Modulates immune infiltration; can increase antigen presentation |
| Major Preclinical Challenge | Dose-limiting toxicity in normal tissues | Identifying reliable predictive biomarkers for dependency |
Table 3: Translational Challenges and Clinical Endpoint Correlates
| Translational Aspect | UPS Inhibition | Autophagy Inhibition |
|---|---|---|
| Key Preclinical Biomarker | Levels of polyubiquitinated proteins, NRF1 activation | LC3-II/p62 accumulation by IHC/WB, increased autophagic vesicles (EM) |
| Clinical Biomarker Feasibility | Moderate (blood-based proteasome activity possible) | High (IHC for p62 in tumor biopsies is standard) |
| Primary Clinical Endpoint (Historical) | Overall Response Rate (ORR) in hematologic cancers | Progression-Free Survival (PFS) in solid tumors, often in combo |
| Rationale for Endpoint Choice | Rapid apoptosis leads to quick tumor shrinkage. | Cytostatic effect, sensitization to chemo/radiation; benefit seen in PFS. |
| Major Translational Gap | Poor prediction of solid tumor efficacy & peripheral neuropathy. | Biomarker (p62) validation for patient stratification; inconsistent monotherapy activity. |
Experimental Protocols Cited
Protocol 1: Assessing Autophagy Flux In Vivo Purpose: To differentiate between autophagy induction and blockade.
- Tumor-bearing mice are treated with autophagy inhibitor (e.g., Chloroquine, 50 mg/kg, i.p.) or vehicle.
- 2 hours post-injection, administer a lysosomal inhibitor (Bafilomycin A1, 2 mg/kg, i.p. or Leupeptin/E64d).
- Harvest tumors 6 hours after the first injection.
- Analyze tissue lysates by Western Blot for LC3-II and p62/SQSTM1. A further increase in LC3-II with lysosomal inhibitor indicates ongoing autophagic flux. p62 should accumulate with effective inhibition.
Protocol 2: Evaluating Proteasome Inhibition in Tumors Purpose: To confirm target engagement of UPS inhibitors.
- Treat mice with proteasome inhibitor (e.g., Bortezomib, 1 mg/kg, i.v.) or vehicle.
- At T=1, 4, 24, and 48 hours post-dose, harvest tumor and normal tissue (e.g., peripheral nerve).
- Homogenize tissues in ATP-containing lysis buffer.
- Measure chymotrypsin-like (and other) proteasome activities using fluorogenic substrates (e.g., Suc-LLVY-AMC) in a kinetic assay. Activity is expressed as % of vehicle control.
- Parallel samples are analyzed for ubiquitinated protein accumulation by Western Blot.
Pathway and Workflow Diagrams
Title: UPS vs. Autophagy Pathways & Inhibition Sites
Title: Preclinical to Clinical Translational Workflow
The Scientist's Toolkit: Key Research Reagent Solutions
| Reagent / Material | Function in Research | Example Product/Catalog |
|---|---|---|
| Fluorogenic Proteasome Substrate (Suc-LLVY-AMC) | Measures chymotrypsin-like activity of the proteasome in cell/tissue lysates; key PD marker for UPS inhibitors. | Sigma-Aldrich, I-1395 |
| LC3B Antibody | Detects LC3-I (cytosolic) and lipidated LC3-II (autophagosome-bound) by Western Blot or IHC; standard for monitoring autophagy. | Cell Signaling Technology, #3868 |
| p62/SQSTM1 Antibody | Detects p62 protein that accumulates upon autophagy inhibition; used as a biomarker for autophagic flux blockade. | Abcam, ab109012 |
| Chloroquine Diphosphate | Lysosomotropic agent used in vitro and in vivo to inhibit autophagy by raising lysosomal pH; clinical comparator. | Sigma-Aldrich, C6628 |
| Bafilomycin A1 | Specific V-ATPase inhibitor blocks autophagosome-lysosome fusion; used in vitro to conclusively measure autophagic flux. | Cayman Chemical, 11038 |
| Poly-Ubiquitin Conjugate Antibody | Detects accumulated polyubiquitinated proteins via Western Blot; indicates effective proteasome inhibition. | Enzo Life Sciences, BML-PW8810 |
| In Vivo Formulation Vehicle (e.g., Captisol) | Cyclodextrin-based solubilizing agent for preparing stable, well-tolerated parenteral formulations of insoluble inhibitors. | Ligand Pharmaceuticals, Captisol |
| Caspase-3/7 Glo Assay | Luminescent assay to quantify apoptosis activation following UPS inhibition or other stresses. | Promega, G8091 |
This comparison guide examines experimental paradigms combining proteostasis inhibition—targeting the Ubiquitin-Proteasome System (UPS) or autophagy—with established anticancer modalities. The context is a thesis comparing the efficacy and mechanisms of UPS versus autophagy inhibition in preclinical cancer models. The following sections provide objective comparisons of therapeutic performance, supported by experimental data and methodologies.
Comparative Efficacy of Combined Modalities
Table 1: Synergistic Efficacy of Proteostasis Inhibition with Standard Therapies in Preclinical Models
| Combination Therapy | Cancer Model | Key Readout | Result (Combination vs. Monotherapy) | Proposed Mechanism |
|---|---|---|---|---|
| Bortezomib (UPSi) + Doxorubicin (Chemo) | Murine Breast Cancer (4T1) | Tumor Volume (Day 21) | 78% reduction vs. 45% (Bort) / 50% (Dox) | ER stress amplification, increased DNA damage |
| Hydroxychloroquine (Autoph. i) + Anti-PD-1 (Immuno) | Murine Melanoma (B16-F10) | Survival (Day 60) | 80% vs. 40% (Anti-PD-1) / 0% (HCQ) | Enhanced antigen presentation, reduced Treg infiltration |
| Bortezomib (UPSi) + Ibrutinib (Targeted) | Human Mantle Cell Lymphoma (Jeko-1 Xenograft) | Tumor Growth Inhibition (%) | 92% vs. 70% (Ibrutinib) / 65% (Bort) | Synergistic NF-κB suppression, CRT surface exposure |
| Chloroquine (Autoph. i) + Trametinib (Targeted) | KRAS-mut NSCLC (A549 Xenograft) | Median Survival (Days) | 48 vs. 34 (Trametinib) | Inhibition of compensatory survival pathways |
Table 2: Comparative Biomarker Changes Post-Treatment
| Therapy Combination | Model (Cell Line) | Change in Apoptosis Marker (Cleaved Caspase-3) | Change in Autophagy Flux (LC3B-II/p62) | Change in Immune Context (CD8+/Treg Ratio) |
|---|---|---|---|---|
| UPSi + Chemotherapy | 4T1 (in vivo) | +420% | p62: +300% (UPS blocked) | +180% |
| Autophagy i + Immunotherapy | B16-F10 (in vivo) | +200% | LC3B-II: +350% (flux blocked) | +400% |
| UPSi + Targeted Agent | Jeko-1 (in vitro) | +550% | p62: +280% | N/A |
| Autophagy i + Targeted Agent | A549 (in vitro) | +310% | LC3B-II: +400% | N/A |
Detailed Experimental Protocols
Protocol 1: Assessing In Vivo Synergy of UPS Inhibition and Chemotherapy
Objective: Evaluate the combined effect of Bortezomib and Doxorubicin on tumor growth and survival. Materials: 4T1-luc cells, BALB/c mice, Bortezomib (IV, 0.8 mg/kg, twice weekly), Doxorubicin (IP, 4 mg/kg, weekly), Caliper for tumor measurement, In Vivo Imaging System (IVIS). Method:
- Inject 1x10^6 4T1-luc cells subcutaneously into the flank of female BALB/c mice (n=10/group).
- Randomize mice into four groups: Vehicle, Bortezomib monotherapy, Doxorubicin monotherapy, Combination.
- Initiate treatment when tumors reach 100 mm³.
- Measure tumor dimensions bi-weekly; calculate volume as (width² x length)/2.
- Monitor animal weight twice weekly for toxicity.
- Terminate study at Day 21 or when tumor volume exceeds 1500 mm³.
- Harvest tumors for immunohistochemistry (Cleaved Caspase-3, p62) and RNA sequencing.
Protocol 2: Evaluating Autophagy Inhibition and Checkpoint Blockade
Objective: Determine the impact of Hydroxychloroquine (HCQ) on anti-PD-1 efficacy. Materials: C57BL/6 mice, B16-F10 melanoma cells, anti-PD-1 antibody (200 μg, IP, every 3 days), HCQ (60 mg/kg, daily by oral gavage), Flow cytometer with antibodies for CD8, CD4, FoxP3, PD-1. Method:
- Inoculate 2.5x10^5 B16-F10 cells subcutaneously into the right flank.
- After 7 days, randomize into treatment groups (n=8).
- Administer therapies for 3 weeks.
- Harvest tumors and draining lymph nodes at Day 28 from a subset (n=3/group).
- Create single-cell suspensions and stain for flow cytometric analysis of T cell populations.
- For the remaining mice, monitor survival as the primary endpoint.
Signaling Pathways and Workflows
Title: UPS Inhibition and Chemotherapy Synergy Pathway
Title: Autophagy Inhibition Enhances Anti-PD-1 Mechanism
Title: Preclinical Workflow for Testing Combination Therapy
The Scientist's Toolkit: Research Reagent Solutions
Table 3: Essential Reagents for UPS/Autophagy Combination Studies
| Reagent | Supplier Examples (for reference) | Primary Function in Experiments |
|---|---|---|
| Bortezomib (UPS Inhibitor) | Selleckchem, MedChemExpress | Reversibly inhibits the 26S proteasome's chymotrypsin-like activity, inducing ER stress and apoptosis. |
| Hydroxychloroquine (Autophagy Inhibitor) | Sigma-Aldrich, Cayman Chemical | Lysosomotropic agent that raises lysosomal pH, blocking autophagosome degradation and flux. |
| CellTiter-Glo Luminescent Viability Assay | Promega | Quantifies ATP as a proxy for viable cell number in high-throughput synergy screens. |
| LC3B (D11) XP Rabbit mAb | Cell Signaling Technology | Key antibody for monitoring autophagy flux via Western blot (LC3B-I to LC3B-II conversion). |
| p62/SQSTM1 Antibody | Novus Biologicals | Detects p62 protein accumulation, indicating blocked autophagy or proteasomal degradation. |
| Anti-Cleaved Caspase-3 (Asp175) Antibody | Cell Signaling Technology | Marker for apoptotic cells in both flow cytometry and immunohistochemistry. |
| In Vivo Grade Anti-PD-1 (CD279) Antibody | Bio X Cell | For checkpoint blockade studies in immunocompetent mouse models. |
| Recombinant Human/Mouse Cytokine/Growth Factor Panels | R&D Systems | To analyze immune or stress signaling changes in tumor microenvironment supernatants. |
Conclusion
The strategic inhibition of the UPS and autophagy represents two powerful, yet distinct, approaches to disrupt the proteostatic addiction of cancer cells. This comparative analysis reveals that while UPS inhibitors have achieved clinical success, autophagy inhibition presents a promising complementary strategy, particularly in resistant or aggressive tumors. The choice between, or combination of, these modalities must be informed by robust preclinical modeling that accounts for tumor context, compensatory mechanisms, and the dynamic tumor microenvironment. Key future directions include the development of more specific and potent autophagy inhibitors, the validation of non-invasive biomarkers for patient selection, and the design of innovative clinical trials testing rational combinations. Ultimately, a nuanced understanding of the interplay between these two recycling pathways will be essential for unlocking their full therapeutic potential and delivering more effective, personalized cancer treatments.