Optimizing Recombinant Protein Expression in E. coli: A Comprehensive Guide to Key Success Factors
This article provides a comprehensive guide for researchers and biopharmaceutical professionals on the critical factors influencing recombinant protein expression in Escherichia coli.
Optimizing Recombinant Protein Expression in E. coli: A Comprehensive Guide to Key Success Factors
Abstract
This article provides a comprehensive guide for researchers and biopharmaceutical professionals on the critical factors influencing recombinant protein expression in Escherichia coli. We explore foundational genetic elements like codon usage and promoter strength, detail methodological strategies for vector selection and culture conditions, address common troubleshooting scenarios and optimization techniques, and review validation methods and comparative host system analysis. The synthesis of these four core intents delivers a systematic framework for maximizing protein yield, solubility, and functionality in this indispensable workhorse of molecular biology.
The Genetic Blueprint: Core Principles and Key Variables in E. coli Protein Expression
Escherichia coli remains the dominant microbial cell factory for recombinant protein production, underpinning modern biotechnology and therapeutic development. Its primacy is contextualized within the critical research theme of understanding and optimizing the factors affecting protein expression. This guide details the core systems, current methodologies, and reagents central to leveraging E. coli for high-yield, functional protein production.
Core Systems and Quantitative Performance
The selection of an appropriate expression system is the foundational decision. Key systems are compared below.
Table 1: Comparison of Major E. coli Expression Systems
| System Type | Promoter | Inducer | Key Features | Typical Yield Range (mg/L) | Best For |
|---|---|---|---|---|---|
| T7-Based | T7 lac | IPTG | Strong, tightly regulated, high yield. | 10 - 500+ | Cytoplasmic soluble proteins; high-level production. |
| araBAD | PBAD | L-Arabinose | Tightly regulated, titratable expression. | 5 - 200 | Toxic proteins; fine-tuning expression level. |
| pL/pR | pL/pR | Temperature Shift | Thermo-inducible, no chemical cost. | 10 - 300 | Large-scale fermentation; avoid chemical inducers. |
| Tet/Tight | Ptet | Anhydrotetracycline | Extremely tight repression, low basal. | 5 - 150 | Highly toxic proteins; mammalian-like regulation. |
Table 2: Impact of Host Strain Selection on Expression Outcomes
| Host Strain | Genotype Highlights | Primary Functional Deficit | Target Problem | Common Yield Improvement |
|---|---|---|---|---|
| BL21(DE3) | ompT, lon, DE3 phage | Proteases | Standard protein expression | Baseline |
| BL21(DE3) pLysS | ompT, lon, DE3, pLysS (T7 lysozyme) | Basal T7 RNA Pol activity | Toxic protein leakage | 2-10x for toxic genes |
| Origami(DE3) | trxB, gor mutants, DE3 | Cytoplasmic disulfide bonds | Cytoplasmic disulfide bond formation | Up to 100x for disulfide proteins |
| SHuffle | trxB, gor, dsbC periplasm | Periplasmic & cytoplasmic disulfides | Complex disulfide bonds | High activity for eukaryotic proteins |
| BL21(DE3) Star | ompT, lon, DE3, rne131 | mRNA degradation | Poor mRNA stability | 3-10x for low-expression genes |
Detailed Experimental Protocol: High-Density Induction Optimization
This protocol is critical for determining the optimal induction parameters—a key factor in maximizing soluble yield and minimizing inclusion bodies.
Protocol: Optimizing Induction Timing and Temperature for Soluble Yield
Objective: To identify the optimal cell density (OD600) and post-induction temperature for maximizing soluble expression of a target protein.
Materials:
- Recombinant E. coli BL21(DE3) harboring pET vector with gene of interest.
- LB or TB auto-induction media with appropriate antibiotics.
- Isopropyl β-D-1-thiogalactopyranoside (IPTG), sterile filtered.
- Shaking incubator with temperature control.
- Centrifuge and sonicator for cell lysis.
- SDS-PAGE equipment and analysis software.
Procedure:
- Inoculum Preparation: Inoculate 5 mL of media with a single colony and grow overnight (37°C, 220 rpm).
- Main Culture: Dilute overnight culture 1:100 into fresh, pre-warmed media in baffled flasks (culture volume ≤ 20% of flask volume). Grow at 37°C with vigorous shaking.
- Induction Time-Course: Monitor OD600. Remove aliquots of culture at target OD600 values (e.g., 0.4, 0.6, 0.8, 1.0, 2.0, 4.0). Induce each aliquot with a standardized IPTG concentration (e.g., 0.1 - 1.0 mM).
- Temperature Shift: For each induced aliquot, split into two sub-aliquots. Incubate one at 37°C and the other at a reduced temperature (e.g., 18-25°C).
- Harvesting: Grow induced cultures for a standardized period (e.g., 4-6h for 37°C, 16-20h for low temp). Pellet cells by centrifugation (4,000 x g, 20 min).
- Lysis and Fractionation: Resuspend pellets in lysis buffer. Lyse via sonication or chemical methods. Separate soluble (supernatant) and insoluble (pellet) fractions by centrifugation (15,000 x g, 30 min, 4°C).
- Analysis: Analyze total, soluble, and insoluble fractions by SDS-PAGE. Quantify band intensity to calculate the soluble:insoluble ratio and total yield.
Diagram: Experimental Workflow for Induction Optimization
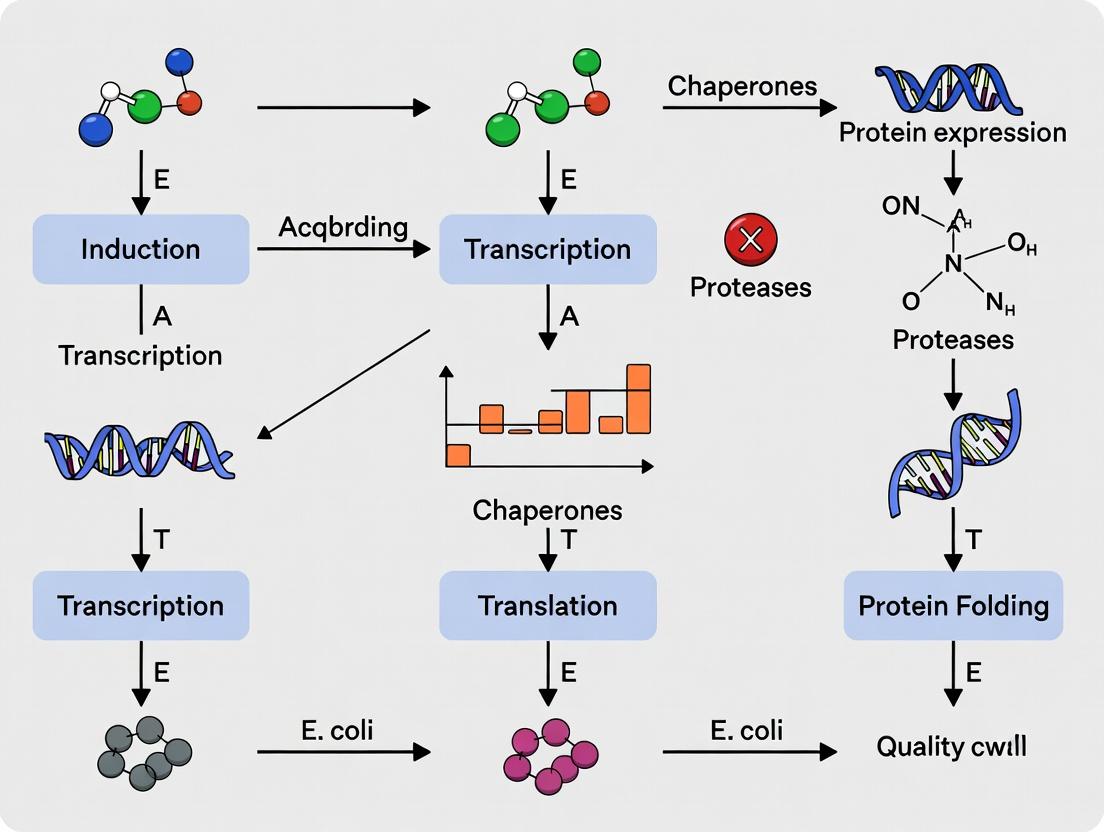
The Central Dogma & Key Stress Pathways
Understanding cellular bottlenecks requires mapping the flow from gene to protein and the stress responses that limit yield.
Diagram: Key Pathways Affecting Protein Expression in E. coli
The Scientist's Toolkit: Key Research Reagent Solutions
Table 3: Essential Reagents for E. coli Protein Expression Research
| Reagent / Kit | Supplier Examples | Function & Application |
|---|---|---|
| pET Expression Vectors | Novagen (MilliporeSigma), GenScript | Standardized, high-copy number plasmids with T7 promoter for controlled, high-level expression. |
| BL21(DE3) Competent Cells | NEB, Invitrogen, Novagen | Gold-standard host strains deficient in proteases, with chromosomal T7 RNA polymerase. |
| Autoinduction Media Blends | Formedium, Mediatech | Specialized media formulations that automatically induce expression at high density, streamlining production. |
| BugBuster / B-PER Reagents | MilliporeSigma, Thermo Fisher | Gentle, non-denaturing detergents for efficient bacterial cell lysis and soluble protein extraction. |
| HisPur Ni-NTA Resins | Thermo Fisher | Immobilized metal affinity chromatography (IMAC) resins for rapid purification of polyhistidine-tagged proteins. |
| Thrombin/TEV Protease Kits | MilliporeSigma, Thermo Fisher | High-precision proteases for cleaving affinity tags from purified proteins to restore native sequence. |
| Chaperone Plasmid Kits (GroEL/S, DnaK/J) | Takara Bio | Co-expression plasmids for molecular chaperones to improve folding and solubility of difficult targets. |
| Codon Plus RIL / Rosetta Strains | Agilent, Novagen | Host strains supplying rare tRNAs for genes with codons not commonly used in E. coli. |
Within the broader thesis on factors affecting protein expression in E. coli, understanding the foundational machinery executing the Central Dogma is paramount. Efficient heterologous protein production is directly governed by the kinetics and fidelity of transcription and translation. This guide details the components, regulation, and experimental interrogation of these core processes in a bacterial context, providing the technical basis for optimizing expression systems.
The Transcription Machinery: From DNA to RNA
Transcription in E. coli is carried out by the DNA-dependent RNA polymerase (RNAP), a multi-subunit enzyme complex.
Core RNA Polymerase Composition
The catalytically active core enzyme (α₂ββ'ω) requires a sigma (σ) factor for promoter-specific initiation.
Table 1: Subunits of E. coli RNA Polymerase
| Subunit | Gene | Function | Mass (kDa) |
|---|---|---|---|
| α | rpoA | Enzyme assembly, UP element binding | 36.5 |
| β | rpoB | Forms active site for RNA synthesis | 150.6 |
| β' | rpoC | DNA template binding | 155.2 |
| ω | rpoZ | Chaperone for β' assembly | 10.2 |
| σ⁷⁰ | rpoD | Primary σ factor; promoter recognition | 70.3 |
Transcription Cycle: Initiation, Elongation, Termination
- Initiation: σ factor binds core, forming the holoenzyme. It recognizes consensus promoter sequences at -10 (Pribnow box: TATAAT) and -35 (TTGACA). The polymerase unwinds DNA to form the transcription bubble.
- Elongation: σ factor dissociates. RNAP synthesizes RNA 5'→3', using NTPs as substrates. Average elongation rate: 40-80 nucleotides/sec.
- Termination: Two primary mechanisms:
- Rho-dependent: Rho helicase binds C-rich rut site on RNA, translocates, and dissociates the RNAP-DNA-RNA complex.
- Rho-independent: GC-rich hairpin followed by a poly-U tract in the RNA causes polymerase stalling and release.
Diagram 1: Bacterial Transcription Cycle
Key Experimental Protocol:In VitroRun-off Transcription Assay
Purpose: To analyze transcription initiation from a specific promoter. Method:
- Template DNA: Linearize a plasmid containing the promoter of interest downstream of the restriction site.
- Reaction Mix: Combine purified E. coli RNAP holoenzyme (10-20 nM), linear DNA template (5-10 nM), NTPs (including [α-³²P]CTP for radiolabeling or fluorescent NTPs), and transcription buffer (40 mM Tris-HCl pH 8.0, 150 mM KCl, 10 mM MgCl₂).
- Incubation: Allow single round of transcription (e.g., 20 min at 37°C). Add heparin (200 µg/mL) to sequester free RNAP and prevent re-initiation.
- Analysis: Terminate reaction with Stop Buffer (95% formamide, EDTA). Resolve RNA products on denaturing urea-PAGE. Visualize via autoradiography or fluorescence imaging.
The Translation Machinery: From RNA to Protein
Translation decodes mRNA into a polypeptide via the ribosome, tRNAs, and associated factors.
TheE. coliRibosome
A 70S complex composed of a 50S large subunit and a 30S small subunit.
Table 2: Composition of the E. coli 70S Ribosome
| Subunit | rRNA Components | Protein Components | Key Functions |
|---|---|---|---|
| 30S | 16S rRNA (1542 nt) | 21 Proteins (S1-S21) | mRNA binding, decoding, A/T-site tRNA selection |
| 50S | 23S rRNA (2904 nt), 5S rRNA (120 nt) | 33 Proteins (L1-L36) | Peptidyl transfer, tRNA accommodation, polypeptide tunnel |
Translation Cycle
Initiation: The 30S subunit, initiation factors (IF1, IF2, IF3), fMet-tRNAᶠᴹᵉᵗ, and GTP bind the mRNA start codon (AUG, GUG, UUG) guided by the Shine-Dalgarno sequence (AGGAGG). The 50S subunit joins. Elongation: EF-Tu delivers aminoacyl-tRNA to the A-site. Peptidyl transferase catalyzes peptide bond formation. EF-G catalyzes translocation. Termination: Release factors (RF1, RF2) recognize stop codons (UAA, UAG, UGA) and hydrolyze the polypeptide. Ribosome recycling factor (RRF) and EF-G dissociate the complex.
Diagram 2: Bacterial Translation Elongation Cycle
Key Experimental Protocol:In VivoTranslation Rate Measurement via Ribosome Profiling
Purpose: To determine the density and position of ribosomes on mRNA genome-wide. Method:
- Cell Harvest & Lysis: Rapidly chill E. coli culture (e.g., using flash-freezing in liquid N₂). Lyse cells, and treat lysate with RNase I to digest mRNA not protected by ribosomes.
- Ribosome Isolation: Centrifuge through a sucrose cushion to pellet monosomes. Extract the protected mRNA fragments (ribosome footprints, ~28-30 nt).
- Library Preparation: Dephosphorylate, purify fragments, and ligate adapters. Reverse transcribe to cDNA. Circularize and PCR amplify.
- Sequencing & Analysis: Perform deep sequencing. Align footprints to the reference genome. Normalize reads by RPKM (Reads Per Kilobase per Million) to calculate ribosome density, indicating translation efficiency.
The Scientist's Toolkit: Research Reagent Solutions
Table 3: Essential Reagents for Studying Transcription & Translation in E. coli
| Reagent | Supplier Examples | Function in Research |
|---|---|---|
| Purified E. coli RNAP Core/Holoenzyme | NEB, Epicypher | In vitro transcription assays, promoter strength studies. |
| Linear DNA Template Kits | Thermo Fisher, Jena Bioscience | Provides controlled templates for run-off transcription assays. |
| ³²P or Fluorescent-labeled NTPs | PerkinElmer, Cytiva | Radiolabeling or fluorescent tagging of nascent RNA for detection. |
| RiboMAX Large Scale RNA Production System | Promega | High-yield in vitro transcription for mRNA preparation. |
| E. coli S30 Extract Systems | Promega, Lucigen | Cell-free transcription/translation (TXTL) for protein expression. |
| Purified Ribosomes & Translation Factors | BioPioneer, MyBioSource | Reconstitution of in vitro translation systems. |
| CHX (Cycloheximide) or Other Translation Inhibitors | Sigma-Aldrich, Cayman Chemical | Arrests ribosomes in vivo for ribosome profiling or puromycylation assays. |
| Ribosome Profiling Kits | Lexogen, Bioo Scientific | Streamlined protocol for generating ribosome-protected fragment libraries. |
| Dual-Luciferase Reporter Assay Systems | Promega | Quantifies transcriptional/translational regulation via reporter genes (luc, gfp). |
| In Vivo Expression Vectors (pET, pBAD) | Novagen, Thermo Fisher | Controlled (IPTG/Arabinose) high-level protein expression in E. coli. |
Within the broader thesis on factors affecting recombinant protein expression in E. coli, the genetic elements governing transcription initiation, translation initiation, and transcription termination are foundational. This technical guide provides an in-depth analysis of promoter strength, Ribosome Binding Site (RBS) efficiency, and terminator efficacy, detailing their quantitative characterization, interplay, and optimization strategies for maximizing protein yield.
In E. coli-based expression systems, the precise engineering of genetic sequences upstream and downstream of the coding sequence is critical for predictable, high-level protein production. Promoters, RBSs, and terminators constitute the core genetic determinants that control mRNA synthesis, ribosome recruitment, and transcriptional polarity, respectively. Their strength and compatibility directly influence mRNA abundance, translational efficiency, and plasmid stability, ultimately determining the success of any research or biomanufacturing endeavor.
Promoter Strength
Promoters are DNA sequences where RNA polymerase binds to initiate transcription. Their strength—defined as the rate of transcription initiation—is a primary lever for controlling gene expression levels.
Key Promoter Elements
- -35 Box (TTGACA): Consensus sequence for initial RNA polymerase recognition.
- -10 Box (TATAAT): Pribnow box for DNA unwinding.
- Spacer Region: The 17±1 bp distance between boxes is optimal.
- UP Element: A/T-rich upstream sequence enhancing binding.
- Transcription Start Site (+1): Where transcription begins.
Quantitative Characterization of Common Promoters
Table 1: Strength and Characteristics of Common E. coli Promoters
| Promoter | Type | Relative Strength (a.u.) | Regulation | Key Applications |
|---|---|---|---|---|
| T7 | Bacteriophage-derived | 1000 - 10,000 | IPTG-inducible via T7 RNAP | Very high-level expression |
| trc / tac | Hybrid (trp/lac) | 500 - 5000 | IPTG-inducible, LacI-repressed | Strong, tightly regulated expression |
| lacUV5 | E. coli variant | 100 - 1000 | IPTG-inducible, LacI-repressed | Moderate, regulated expression |
| araBAD | E. coli native | 50 - 1000 | Arabinose-inducible, AraC-regulated | Tight, titratable regulation |
| J23100 (Constitutive) | Synthetic (Anderson family) | ~100 | Constitutive | Standardized, predictable basal expression |
Experimental Protocol: Measuring Promoter Strength using Reporter Assays
Objective: Quantify promoter activity via a fluorescent reporter (e.g., GFP). Materials:
- Plasmid with test promoter driving GFP.
- Control plasmids (strong/weak promoters, promoter-less).
- E. coli appropriate strain(s).
- Microplate reader (fluorescence-capable).
Methodology:
- Clone test promoter upstream of GFPmut3b in a standardized vector.
- Transform plasmids into isogenic E. coli cells. For inducible promoters, include a compatible repressor plasmid if needed.
- Grow overnight cultures in selective media.
- Dilute cultures 1:100 into fresh media (induct if applicable) in a 96-well plate.
- Incubate with shaking in a plate reader at 37°C, measuring OD~600~ and GFP fluorescence (ex: 488 nm, em: 510 nm) every 10-15 minutes.
- Analyze data from mid-exponential phase. Calculate Promoter Activity Units (PAU) as (Fluorescence/OD~600~) normalized to the value from a reference promoter.
Diagram 1: Workflow for quantifying promoter strength using GFP.
Ribosome Binding Sites (RBS)
The RBS, primarily the Shine-Dalgarno (SD) sequence, facilitates translation initiation by base-pairing with the 16S rRNA. Its sequence and spacing from the start codon are critical determinants of translation initiation rate (TIR).
Determinants of RBS Efficiency
- SD Sequence: Complementary to the 3' end of 16S rRNA (anti-SD: 5'-CCUCC-3'). Perfect complementarity to the core AGGAGG is often strongest.
- Spacer Length: Optimal distance between SD and start codon (AUG) is 5-9 nucleotides.
- Spacer Sequence: Avoid secondary structure that occludes the SD or start codon.
- Start Codon: AUG > GUG > UUG in efficiency.
Quantitative RBS Design and Measurement
Table 2: Predicted vs. Measured Translation Initiation Rates for Model RBS Sequences
| RBS Name / Sequence | Spacer Length (nt) | Predicted TIR (a.u.) | Measured GFP (RFU/OD) | Notes |
|---|---|---|---|---|
| Strong Consensus AGGAGG | 7 | 100,000 | 85000 ± 5000 | Often too strong, can burden cell |
| Medium AGGAG | 8 | 25,000 | 22000 ± 1500 | Common in natural genes |
| Weak AGGA | 9 | 5,000 | 4800 ± 600 | For low-level expression |
| Synthetic (B0034) AAAGAGGAGAAA | 8 | 50,000 | 52000 ± 3000 | BioBrick standard, reliable |
Experimental Protocol: RBS Library Construction and Screening
Objective: Create and screen a library of RBS variants to optimize expression of a protein of interest (POI). Materials:
- Plasmid with promoter and POI, with wild-type RBS replaced by a cloning site (e.g., NcoI, which contains ATG).
- Degenerate oligonucleotides encoding variable SD sequence and spacer.
- Gibson Assembly or Golden Gate cloning reagents.
- Flow cytometer (if FACS-based screening) or plate reader.
Methodology:
- Design degenerate primers to randomize 4-6 bases upstream of the start codon.
- Perform PCR to generate a linear backbone and assemble with the oligo pool using Gibson Assembly.
- Transform the assembly reaction into E. coli, ensuring >10^4^ colony library size.
- Screen/Select:
- For Fluorescent POI: Use FACS to sort cells into bins based on fluorescence intensity. Plate sorted cells and sequence RBS region from colonies.
- For Non-Fluorescent POI: Use a linked reporter (e.g., GFP in an operon) or perform microplate assays on 96 clones from the library.
- Sequence selected clones to identify the RBS sequence and correlate with expression level.
Diagram 2: Workflow for constructing and screening an RBS library.
Terminators
Terminators signal the end of transcription, preventing read-through that can cause plasmid instability, antisense interference, and metabolic burden.
Types and Mechanisms
- Intrinsic (Rho-independent): GC-rich palindrome followed by a poly-U tract, causing RNA polymerase to stall and release.
- Rho-dependent: Requires Rho factor helicase; uses a rut (Rho utilization) site and less structured RNA.
Quantitative Terminator Efficiency
Terminator efficiency (TE) is measured as the percentage reduction in downstream transcription. TE (%) = [1 - (Expression~downstream of terminator~ / Expression~no terminator~)] × 100.
Table 3: Efficiency of Common Terminators
| Terminator | Type | Efficiency (%) | Length (bp) | Notes |
|---|---|---|---|---|
| T7 | Intrinsic | >99 | ~50 | Strong, from bacteriophage T7 |
| rrnB T1 | Intrinsic | 95 - 99 | ~130 | Very strong, native E. coli |
| BBa_B1002 | Intrinsic | ~98 | 129 | BioBrick standard |
| L3S3P21 | Synthetic | >99.5 | 52 | Short, high-efficiency synthetic |
| Rho-dependent | Rho-dependent | 90 - 95 | Variable | Less predictable in synthetic circuits |
Experimental Protocol: Measuring Terminator Efficiency
Objective: Determine the termination efficiency of a DNA sequence. Materials:
- Dual-reporter plasmid with upstream constitutive promoter driving GFP, test terminator, then RFP.
- Control plasmid with no terminator between reporters.
- Flow cytometer or microplate reader.
Methodology:
- Clone test terminator between GFP and RFP in a dual-reporter vector.
- Transform test and control plasmids.
- Grow cells to mid-exponential phase.
- Measure GFP and RFP fluorescence per cell (via flow cytometry) or per culture (via plate reader). Normalize to OD~600~.
- Calculate TE: TE = [1 - (RFP/GFP)~test~ / (RFP/GFP)~control~] × 100. A perfect terminator yields RFP signal near background.
Integrated System Optimization
The interplay between promoter, RBS, and terminator is not purely additive. A strong promoter requires a commensurately strong RBS to harness high mRNA levels, and a strong terminator is essential to prevent transcriptional interference. Modern synthetic biology approaches use computational models (e.g., the RBS Calculator, UNAFold for structure prediction) to predict combinatorial effects before experimental testing.
Diagram 3: Interplay between core genetic determinants in expression.
The Scientist's Toolkit: Research Reagent Solutions
| Item / Reagent | Function / Purpose | Example Supplier / Part |
|---|---|---|
| pET Expression Vectors | High-copy plasmids with strong T7 promoter/lac operator for high-level, inducible expression. | Novagen (Merck) pET series |
| Anderson Promoter Collection (J23xxx) | Set of standardized, characterized constitutive promoters of varying strengths for predictable tuning. | Addgene (BBa_J23100 series) |
| RBS Library Kit | Pre-designed oligo pools for randomizing RBS strength upstream of your gene of interest. | NEB Builder Hifi DNA Assembly + custom oligos |
| Dual Reporter Vector (GFP-RFP) | Plasmid for measuring terminator efficiency or transcriptional leakage via fluorescence ratios. | Addgene (e.g., pSC-GFP-T-RFP) |
| T7 RNA Polymerase Strains | E. coli hosts (DE3 lysogen) providing chromosomal T7 RNAP for pET vector expression. | BL21(DE3), Tuner(DE3), Rosetta(DE3) |
| Gibson Assembly Master Mix | Enzyme mix for seamless, one-step assembly of multiple DNA fragments with 15-40 bp overlaps. | NEB Gibson Assembly, Synthetic Genomics Gibson |
| Flow Cytometer | Instrument for high-throughput, single-cell fluorescence analysis, essential for screening libraries. | BD Accuri, Beckman Coulter CytoFLEX |
| RBS Calculator v2.1 | Online computational tool for predicting translation initiation rates from DNA sequence. | salislab.net/software |
| UNAFold / mFold Server | Predicts mRNA secondary structure to assess RBS accessibility and terminator formation. | unafold.rna.albany.edu |
Within the comprehensive thesis on Factors affecting protein expression in E. coli research, the codon usage bottleneck represents a critical translational constraint. Heterologous protein expression in E. coli is frequently hampered by a mismatch between the codon composition of the foreign gene and the endogenous tRNA pool of the host. While individual rare codons can slow elongation, clusters of such codons—particularly those for low-abundance tRNAs—can lead to ribosomal stalling, premature termination, translation errors, and protein misfolding. This whitepaper examines the relationship between tRNA abundance, rare codon clusters, and their quantifiable impact on recombinant protein yield and quality.
Quantitative Data on tRNA Abundance and Codon Impact
Table 1: Standardized tRNA Abundance Index for Common E. coli Expression Strains Data derived from genomic tRNA copy number and quantitative tRNA-seq studies. Indices are normalized relative to the most abundant tRNA.
| tRNA Isoacceptor (Anticodon) | Corresponding Codon(s) | Approx. Copy Number in E. coli BL21 | Relative Abundance Index (1-100) | Notes |
|---|---|---|---|---|
| tRNAArg (CCG) | CGG, AGG (AGA) | 2 | 5 | Very low abundance; AGG/AGA are classic rare codons. |
| tRNAIle (AUU) | AUA | 3 | 7 | Low abundance; AUA is a problematic rare codon. |
| tRNALeu (CAG) | CUG | 6 | 15 | Moderate, but demand is high due to frequent Leu usage. |
| tRNAPro (CGG) | CCG | 4 | 10 | Low abundance. |
| tRNAGly (CCC) | GGG | 2 | 5 | Very low abundance. |
| tRNALys (UUU) | AAA | 11 | 28 | Moderately high. |
| tRNAPhe (GAA) | UUC, UUU | 8 | 20 | Moderate. |
Table 2: Documented Impact of Rare Codon Clusters on Protein Expression Yield
| Protein Expressed | Host Strain | Rare Codon Cluster Feature | Reported Yield Reduction vs. Optimized Gene | Primary Observed Defect |
|---|---|---|---|---|
| Human Erythropoietin | BL21(DE3) | 4 consecutive AGG (Arg) | >90% | No soluble protein detected; aggregation. |
| Mycobacterium Antigen | K-12 derivatives | AUA cluster near 5' end | ~70% | Severe ribosomal stalling, truncated products. |
| Shark Antibody Domain | Origami 2(DE3) | CCC (Pro) repeats | ~60% | Inclusion body formation; misincorporation. |
| Plant Cytochrome P450 | C41(DE3) | Multiple AGG/AGA spaced <10 codons apart | ~80% | Low total protein; co-factor misincorporation. |
Experimental Protocols for Investigating the Bottleneck
Protocol 1: Ribosomal Profiling (Ribo-seq) to Map Stalling Sites Objective: To experimentally identify positions of ribosomal stalling due to rare codon clusters in real-time. Methodology:
- Cell Harvest & Lysis: Grow E. coli cells expressing the target protein to mid-log phase. Rapidly chill cultures on dry ice/ethanol. Harvest and lyse cells using a cryogenic mill or lysozyme/freeze-thaw in polysome buffer.
- Nuclease Digestion: Treat lysate with RNase I (100 U/ml) for 45 min at 24°C to digest mRNA not protected by ribosomes.
- Monosome Isolation: Layer digest on a sucrose cushion (34%) and ultracentrifuge (70,000 rpm, 4°C, 2 hrs) to pellet protected monosomes.
- RNA Extraction & Library Prep: Extract the protected mRNA footprints (~28 nt) with acid phenol-chloroform. Construct sequencing libraries: dephosphorylate, ligate adapters, reverse transcribe, and PCR amplify.
- Data Analysis: Map sequenced footprints to the mRNA transcript. Stalling sites are identified as peaks of ribosome footprint density, particularly when corresponding to rare codon clusters.
Protocol 2: tRNA Adaptation Index (tAI) Calculation for Gene Optimization Objective: To computationally assess the compatibility of a gene's codon sequence with the host's tRNA pool. Methodology:
- Obtain tRNA Gene Copy Numbers: Compile the genomic tRNA copy numbers for your specific E. coli strain from databases (e.g., GtRNAdb).
- Assign Weights: Calculate the relative adaptiveness weight (wᵢ) for each codon i: wᵢ = Σ (tGCNⱼ * Sⱼ) for all isoacceptors j recognizing the codon, where tGCN is tRNA gene copy number and S is a selectivity factor (often 1 for perfect Watson-Crick matches, <1 for wobble).
- Normalize: Normalize wᵢ values by the maximum w value for that amino acid.
- Calculate Gene tAI: For a gene, compute the geometric mean of the normalized wᵢ values for all its codons: tAI = (Π wᵢ)^{1/L}, where L is gene length. A higher tAI indicates better tRNA adaptation.
Visualizations of Key Concepts and Workflows
Title: The Rare Codon Bottleneck Mechanism
Title: Ribo-seq Experimental Workflow
Title: Strategies to Overcome the Bottleneck
The Scientist's Toolkit: Key Research Reagents & Solutions
Table 3: Essential Materials for Investigating tRNA/Codon Issues
| Item | Function & Application |
|---|---|
| RNase I (Ambion) | Digest unprotected mRNA in ribosomal profiling; crucial for generating ribosome-protected footprints. |
| Sucrose (Ultra Pure) | For creating density gradients/cushions to isolate monosomes from cell lysates during Ribo-seq. |
| Cryogenic Mill (e.g., Retsch) | For rapid, efficient lysis of bacterial cells while preserving ribosome-mRNA complexes. |
| BL21-CodonPlus (Agilent) or Rosetta (Novagen) Strains | E. coli strains engineered to carry plasmids encoding rare tRNA genes (e.g., for AGG, AGA, AUA). |
| tRNA Depletion Kit (e.g., MICROBExpress) | To selectively remove host tRNA/rRNA from total RNA samples for downstream tRNA-seq analysis. |
| Codon Optimization Software (e.g., IDT Codon Optimization Tool, GeneGPS) | Algorithms to redesign gene sequences for optimal tRNA-matching in the target host. |
| Anti-SecM Antibody | Used in in vivo arrest peptide assays to detect ribosome stalling force at specific codon positions. |
| Purified Rare tRNAs | For in vitro translation systems to supplement and directly test the effect of specific tRNA limitation. |
Within the broader thesis investigating Factors affecting protein expression in E. coli, plasmid copy number (PCN) and genetic stability emerge as critical, interlinked determinants. High-level recombinant protein production imposes a significant metabolic burden, leading to selective pressure against high-copy, expression-prone cells. This dynamic directly impacts both product yield and the long-term health and predictability of bacterial cultures. This whitepaper provides a technical guide to understanding, measuring, and controlling PCN and genetic stability to optimize bioprocess outcomes.
Fundamentals of Plasmid Copy Number
Plasmid copy number is defined as the average number of plasmid molecules per host cell. It is primarily governed by the plasmid's origin of replication (ori). PCN is not static; it is influenced by host genetics, growth conditions, and the genetic load of the recombinant insert.
Table 1: CommonE. coliReplication Origins and Their Characteristics
| Origin of Replication | Typical Copy Number Range | Regulation Mechanism | Common Vector Examples | Key Considerations for Protein Expression |
|---|---|---|---|---|
| pMB1 / ColE1 | 15-60 (Medium-High) | RNA I / RNA II | pUC, pET | Risk of metabolic burden, potential instability. |
| pUC | 100-300 (Very High) | Mutated pMB1 (rop-) | pUC series | High DNA yield, severe burden with large inserts. |
| p15A | 10-12 (Low) | Similar to pMB1 | pACYC, pBAD (dual) | Lower burden, used for dual-plasmid systems. |
| SC101 | ~5 (Very Low) | Protein (RepA) | pSC101 | High stability, very low yield of plasmid DNA. |
| CloDF13 | ~25 (Medium) | Protein | pCLOD | Moderate copy, alternative for toxic genes. |
Mechanisms of Genetic Instability
Instability manifests as segregational loss (failure to partition during cell division) or structural instability (deletions, rearrangements within the plasmid). A primary driver is the metabolic burden, which reduces host cell growth rate. Key factors include:
- Resource Drain: Competition for nucleotides, amino acids, ATP, and transcriptional/translational machinery.
- Toxicity of Expression: Even basal expression of some proteins can be toxic.
- Replication Interference: High copy number can disrupt chromosome replication.
Diagram 1: Metabolic Burden and Instability Cycle
Quantitative Measurement Protocols
qPCR for Plasmid Copy Number Determination
Principle: Quantifies plasmid-specific gene vs. chromosome-specific gene.
Protocol:
- Cell Harvest & Lysis: Grow culture to mid-log phase (OD600 ~0.5-0.8). Harvest 1-2 mL. Use thermal or chemical lysis (e.g., 95°C for 10 min in TE buffer, or lysozyme).
- DNA Standard Preparation: Prepare serial dilutions of known quantities of both plasmid and genomic DNA for standard curves.
- qPCR Setup:
- Plasmid Target: Amplify a unique region on the plasmid (e.g., antibiotic resistance gene).
- Chromosome Target: Amplify a single-copy chromosomal gene (e.g., dnaE, icd).
- Use SYBR Green or TaqMan chemistry. Run samples and standards in triplicate.
- Calculation:
- Determine copy number of plasmid and chromosome targets per volume using standard curves.
- PCN = (Plasmid copies / µL) / (Chromosome copies / µL).
Segregational Stability Assay (Plate Count)
Principle: Determines the percentage of cells retaining plasmid after non-selective growth.
Protocol:
- Inoculation: Start a culture from a single colony under antibiotic selection.
- Non-Selective Passaging: Dilute culture 1:1000 daily into fresh, antibiotic-free medium. Repeat for ~50-100 generations.
- Plating: At each passage, plate serial dilutions on both non-selective (LB) and selective (LB + antibiotic) agar plates.
- Calculation:
- % Plasmid-Bearing Cells = (CFU on selective plate / CFU on non-selective plate) * 100.
- Plot % retention vs. generations to determine instability rate.
Table 2: Comparison of PCN Measurement Methods
| Method | Principle | Throughput | Cost | Key Advantage | Key Limitation |
|---|---|---|---|---|---|
| qPCR | DNA quantification by amplification | High | Moderate | High accuracy, absolute numbers | Requires specific primers, sensitive to inhibitors |
| ddPCR | Partitioned endpoint PCR | Medium | High | Absolute quantitation without standard curve | Higher cost, specialized equipment |
| Sequencing (NGS) | Read depth comparison | Very High | High | Genome-wide view, detects variants | Complex data analysis, overkill for simple PCN |
| Gel Electrophoresis | Band intensity of plasmid vs. chrom. DNA | Low | Low | Simple, visual | Low accuracy, semi-quantitative |
Strategies for Optimization
Diagram 2: Strategy Selection Workflow
Key Tactics:
- Vector Engineering: Choose ori matching expression needs. Utilize addiction systems (e.g., hok/sok, ccd) to post-segregationally kill plasmid-free cells.
- Promoter Regulation: Use tightly regulated, inducible systems (T7, araBAD, rhamnose) to minimize basal expression and burden during biomass accumulation.
- Culture Process Optimization: Implement two-stage fermentation (growth phase without induction, followed by induction phase). Optimize induction timing, temperature, and media composition.
- Genomic Integration: For ultimate stability, integrate the gene of interest into the chromosome, though this typically results in lower copy number per cell.
The Scientist's Toolkit: Research Reagent Solutions
Table 3: Essential Materials for PCN & Stability Studies
| Item | Function & Rationale | Example Product/Catalog |
|---|---|---|
| Q5 or Phusion High-Fidelity DNA Polymerase | Error-free amplification for cloning vector fragments and genetic parts to prevent mutations that affect stability. | NEB M0491 / M0530 |
| Commercial Cloning Kits (e.g., Gibson, Golden Gate) | Efficient assembly of plasmids with desired ori, promoter, and tags to systematically test constructs. | NEB E5510 / BsaI kit |
| Site-Directed Mutagenesis Kit | To introduce specific mutations in replication origins or regulatory elements for PCN tuning. | Agilent 200523 |
| Plasmid-Safe ATP-Dependent DNase | Degrades linear chromosomal DNA in lysates to improve purity for qPCR and other assays. | Lucigen E3101K |
| SYBR Green qPCR Master Mix | For accurate, sensitive quantification of plasmid and chromosomal DNA targets in PCN assays. | Thermo Fisher A25742 |
| Next-Generation Sequencing Library Prep Kit | To assess population-level genetic stability and detect plasmid mutations or structural variants. | Illumina 20018705 |
| Tunable Autoinduction Media | Allows controlled, substrate-limited induction in high-density cultures, reducing metabolic shock. | MilliporeSigma 71300 |
| Lytic Enzymes (Lysozyme, Mutanolysin) | For gentle cell lysis to obtain high-quality, sheared genomic DNA for accurate qPCR standards. | Sigma L6876 / M9901 |
This whitepaper details the impact of specific source gene characteristics—GC content, mRNA secondary structure, and inherent toxicity—on recombinant protein expression in E. coli. Within the broader thesis on "Factors affecting protein expression in E. coli," these characteristics represent a critical pre-translational and translational bottleneck. While factors like codon usage, promoter strength, and induction conditions are frequently optimized, the intrinsic properties of the source gene itself can dramatically influence mRNA stability, ribosomal binding, and ultimately, protein yield and cell viability. This guide provides a technical framework for analyzing and engineering these characteristics to maximize expression success.
Core Characteristics: Mechanisms and Impact
GC Content
GC content refers to the percentage of nitrogenous bases in a DNA sequence that are guanine (G) or cytosine (C). In E. coli expression, extremes of GC content are problematic.
Mechanisms & Impact:
- High GC Content (>60-70%): Promotes the formation of stable DNA secondary structures (e.g., hairpins) that can impede polymerase progression during transcription. It also correlates with strong mRNA secondary structures and potential non-optimal codon usage for E. coli.
- Low GC Content (<40-50%): May introduce premature termination signals (e.g., AT-rich regions resembling rho-independent terminators) and can lead to mRNA instability.
Quantitative Data Summary: Table 1: Impact of GC Content on Expression Metrics
| GC Range | Relative Expression Yield | Common Observed Issues | Recommended Action |
|---|---|---|---|
| <40% | Very Low to Low | mRNA degradation, transcriptional attenuation. | Gene synthesis with codon optimization for E. coli. |
| 40-60% | High (Optimal) | Minimal intrinsic issues. | May require no adjustment. |
| >60-70% | Moderate to Low | Transcription blockage, translational inefficiency, inclusion bodies. | Gene synthesis, codon harmonization, lower induction temperature. |
| >70% | Very Low | Severe transcription/translation failure, no expression. | Mandatory gene redesign and synthesis. |
mRNA Secondary Structure
The folding of mRNA into stable intra-strand structures (hairpins, stem-loops) profoundly affects translational initiation and elongation.
Key Regulatory Region: The 5' Untranslated Region (5' UTR) and Start Codon Context. A stable secondary structure (ΔG < -10 kcal/mol) overlapping the Shine-Dalgarno (SD) sequence or the AUG start codon can physically block ribosomal binding and scanning, drastically reducing translation initiation rates.
Quantitative Data Summary: Table 2: Effect of 5' mRNA Structure Stability on Translation Initiation
| ΔG of 5' Region (kcal/mol) | Relative Translation Initiation Rate | Expected Protein Yield Impact |
|---|---|---|
| > -5 | High (Optimal) | Maximal |
| -5 to -10 | Moderate | Reduced (by ~30-70%) |
| < -10 | Very Low | Severe Reduction (>90%) or None |
| < -15 | Negligible | No Detectable Expression |
Toxicity
Gene product toxicity refers to the detrimental effect of the expressed protein or RNA on E. coli host cell physiology, leading to growth inhibition, plasmid instability, or cell death.
Mechanisms:
- Protein-Mediated Toxicity: Disruption of membrane integrity, interference with essential metabolic pathways, sequestration of essential cofactors, or general stress response induction.
- RNA-Mediated Toxicity: Antisense effects from the mRNA sequence binding to essential host transcripts.
Indicators: Severely reduced growth rate post-induction, plasmid loss in culture, selection for non-expressing mutants.
Experimental Protocols for Analysis and Mitigation
Protocol:In silicoAnalysis of Gene Characteristics
Objective: Computational assessment of GC content and mRNA secondary structure. Materials: Gene sequence in FASTA format. Software: Serial Cloner, Geneious, or online tools (e.g., NEBcutter, mFold/UNAFold, the ViennaRNA Package). Method:
- GC Content: Calculate percentage of G and C bases across the full coding sequence (CDS) and in a sliding window (e.g., 50 bp).
- mRNA Folding: Use mFold or the
RNAfoldcommand from ViennaRNA to predict the secondary structure of the 5' UTR + first ~100 nt of the CDS. - Key Parameter: Calculate the minimum free energy (ΔG) of the most stable predicted structure. Visually inspect for structures occluding the SD sequence (AGGAGG) and start codon.
- Codon Adaptation Index (CAI): Use tools like EMBOSS
caior online CAI calculators to assess compatibility with E. coli's tRNA pool (optimal CAI > 0.8).
Protocol: Testing for Product Toxicity
Objective: Empirically determine if expression of the target gene inhibits host growth. Materials: Two compatible plasmid constructs: (1) Target gene under inducible control (e.g., T7/lac), (2) Empty vector control with same origin and resistance. Method:
- Transform both plasmids into the same expression strain (e.g., BL21(DE3)).
- Inoculate 3 mL cultures (appropriate antibiotic) and grow overnight.
- Dilute overnight cultures 1:100 into fresh medium (at least 3 replicates each). Immediately take a 0-hour OD600 measurement.
- Induce one set of cultures at mid-log phase (OD600 ~0.6) with optimal inducer (e.g., 0.5 mM IPTG). Maintain an uninduced set for both constructs.
- Monitor OD600 every hour for 5-6 hours post-induction.
- Analysis: Plot growth curves. A significant lag or lower final OD600 in the induced target gene culture versus the induced empty vector control indicates toxicity. Uninduced cultures should grow similarly.
Protocol: Mitigation via Codon Optimization and Gene Synthesis
Objective: Redesign the source gene to alleviate high GC content, destabilize inhibitory mRNA structures, and adapt codon usage. Materials: Amino acid sequence of the target protein. Method:
- Use a commercial gene synthesis service (e.g., GenScript, IDT, Twist Bioscience).
- Specify Optimization Parameters: Request E. coli-optimized codon usage, avoidance of internal SD-like sequences and restriction sites, and minimization of local mRNA stability around the 5' end.
- Request Delivery: Cloned into your desired expression vector. Always sequence the entire synthesized insert.
Visualizations
Title: Gene Characterization & Mitigation Workflow
Title: From Gene Feature to Poor Expression Yield
The Scientist's Toolkit: Research Reagent Solutions
Table 3: Essential Materials for Investigating Source Gene Characteristics
| Reagent/Material | Function/Application | Example Vendor/Product |
|---|---|---|
| Codon-Optimized Gene Fragments | De novo synthesis of genes engineered for high GC content, mRNA structure, and codon usage in E. coli. | IDT gBlocks, Twist Bioscience Gene Fragments, GenScript Gene Synthesis. |
| T7 Express LysY/Iq Competent E. coli | Expression strains with tightly regulated T7 RNAP; the lacY1 mutation in LysY/Iq allows precise control for toxic genes. | New England Biolabs (NEB) C3016/C3026. |
| pET Series Expression Vectors | Standard vectors for T7-driven expression. Variants with different tags (His-tag, SUMO) and fusion partners can enhance solubility of problematic proteins. | MilliporeSigma (Novagen), Addgene. |
| Tight-Induction Regulator Systems | Systems offering very low basal expression for toxic genes (e.g., pLysS/pLysE plasmids, arabinose- or rhamnose-inducible systems). | Takara Bio (pLysS), NEB (Lemo21(DE3) strain). |
| RNA Structure Prediction Software Suite | Computational tools for modeling mRNA secondary structure and calculating stability (ΔG). | ViennaRNA Package (free), mFold web server. |
| Real-Time PCR (qRT-PCR) Reagents | Quantification of specific mRNA transcript levels to assess the impact of GC/content/structure on mRNA stability and abundance. | Thermo Fisher SuperScript III Platinum SYBR Green, Bio-Rad iTaq Universal SYBR Green. |
| Anti-RNAse BSA | Additive for in vitro transcription/translation reactions or RNA extraction to prevent degradation during analysis. | Thermo Fisher (AM2618). |
| Tunable Auto-Induction Media | Media formulations that allow culture growth to high density before automatic induction, useful for testing toxicity over long periods. | MilliporeSigma (Novagen) Overnight Express Autoinduction System. |
From Plasmid to Product: Strategic Methodologies for High-Yield Expression
Within the complex landscape of E. coli recombinant protein expression, vector selection is a primary determinant of success. This choice, framed within a broader thesis on Factors Affecting Protein Expression in E. coli, directly influences transcription rates, translation efficiency, protein folding, and final yield. This guide provides a technical comparison between standard, multi-purpose vectors and specialized systems like pET, pBAD, and Gateway, outlining their roles in optimizing expression outcomes.
Core System Comparison & Quantitative Data
Specialized plasmids are engineered with specific regulatory elements to address challenges like toxicity, solubility, and precise control. The table below summarizes key quantitative and functional differences.
Table 1: Comparison of Standard vs. Specialized E. coli Expression Vectors
| Feature | Standard/General Cloning Vector (e.g., pUC19, pBluescript) | pET System (T7-based) | pBAD System (AraC-arabinose) | Gateway Technology |
|---|---|---|---|---|
| Primary Promoter | Constitutive (e.g., lac) or weak | T7lac (Strong, phage-derived) | PBAD (Tight, arabinose-inducible) | Depends on destination vector |
| Regulation Mechanism | Leaky repression (LacI) | Stringent. Dual control: LacI & T7 RNA Polymerase | Very Tight. AraC represses; arabinose induces | N/A (Recombinational cloning) |
| Typical Expression Level | Low to Moderate (1-5% total protein) | Very High (up to 50% total protein) | Tunable, Low to High (via arabinose conc.) | Depends on chosen destination vector |
| Key Advantage | Simplicity, general cloning | Maximum protein yield | Fine-tuned control, reduces toxicity | Rapid, site-specific transfer of ORF between vectors |
| Key Limitation | Leaky expression, poor control | Can overwhelm host, toxicity | Lower max yield than pET, catabolite repression | Proprietary, requires specific enzyme mix |
| Ideal Use Case | Gene cloning, subcloning, screening | High-level expression of non-toxic proteins | Expression of toxic proteins, metabolic studies | High-throughput cloning for multiple expression hosts |
Detailed Methodologies & Experimental Protocols
Protocol: Testing Expression with pET and pBAD Vectors
This comparative protocol assesses protein yield and toxicity.
Materials:
- E. coli BL21(DE3) (for pET) and TOP10 or equivalent (for pBAD).
- pET-28a(+) and pBAD/His A vectors containing your gene of interest (GOI).
- LB broth and agar plates with appropriate antibiotics (Kanamycin for pET-28a, Ampicillin for pBAD).
- Inducers: 1M IPTG (for pET), 20% (w/v) L-Arabinose (for pBAD).
- Lysis buffer, SDS-PAGE equipment.
Procedure:
- Transformation & Culture: Transform each plasmid into its appropriate host strain. Pick single colonies into 5 mL LB+antibiotic and grow overnight (37°C, 220 rpm).
- Expression Culture: Dilute overnight culture 1:100 into 50 mL fresh, pre-warmed LB+antibiotic. Grow at 37°C to mid-log phase (OD600 ~0.6).
- Induction:
- pET System: Split culture. To the induced sample, add IPTG to a final concentration of 0.5 mM. Leave the uninduced control.
- pBAD System: Split culture into three flasks. Induce with 0.002% (low) and 0.2% (high) arabinose. Leave one as an uninduced control.
- Post-Induction: Incubate cultures for 4-6 hours at the optimal temperature (often 30°C or 37°C; lower temps may aid solubility).
- Harvest & Analysis: Take 1 mL samples pre- and post-induction. Pellet cells (10,000 x g, 2 min). Resuspend in lysis buffer, sonicate. Centrifuge to separate soluble and insoluble fractions. Analyze total, soluble, and insoluble fractions by SDS-PAGE (12-15% gel).
- Assessment: Compare band intensity of the target protein. Use densitometry software for semi-quantitative yield analysis. Note growth differences (OD600 over time) to assess toxicity.
Protocol: ORF Transfer Using Gateway Cloning
This protocol details moving a GOI from an Entry Clone to an Expression Destination Vector.
Materials:
- Entry Clone: pENTR/D-TOPO or similar with verified GOI.
- Destination Vector: e.g., pDEST14 (for T7 expression in E. coli) or pDEST15 (GST fusion).
- LR Clonase II Enzyme Mix (Thermo Fisher).
- Proteinase K solution.
Procedure:
- LR Reaction: In a microcentrifuge tube, combine:
- Entry Clone (~150 ng)
- Destination Vector (~150 ng)
- LR Clonase II Enzyme Mix (2 µL)
- TE Buffer, pH 8.0 to 8 µL total.
- Incubate at 25°C for 1 hour.
- Termination: Add 1 µL of Proteinase K solution and incubate at 37°C for 10 minutes.
- Transformation: Transform 2 µL of the reaction into competent E. coli (e.g., DH5α). Plate on LB agar with the appropriate antibiotic for the destination vector (e.g., Ampicillin for pDEST14).
- Screening: Screen colonies by colony PCR or restriction digest to confirm the correct Expression Clone. The attB1 and attB2 sites flanking the GOI can also be sequenced.
The Scientist's Toolkit: Essential Reagents & Materials
Table 2: Key Research Reagent Solutions for Vector-Based Expression
| Reagent / Material | Function in Experiment | Critical Specification / Note |
|---|---|---|
| Chemically Competent E. coli Cells | Host for plasmid propagation and protein expression. | Strain must match system (e.g., BL21(DE3) for T7/pET; AraC- strains for pBAD). |
| T7 RNA Polymerase Gene | Encoded in host genome (DE3 lysogen) for pET system. Drives high-level transcription. | Must be present in host strain (e.g., BL21(DE3), Tuner(DE3)). |
| IPTG (Isopropyl β-D-1-thiogalactopyranoside) | Non-hydrolyzable inducer for lac-based systems (pET, pUC). | Concentration optimization (0.1-1.0 mM) is critical to balance yield and solubility. |
| L-Arabinose | Natural inducer for the pBAD promoter. Binds and alters AraC conformation. | Allows fine-tuning; low conc. (0.002%) for toxic proteins, high (0.2%) for max yield. |
| LR Clonase II Enzyme Mix | Proprietary enzyme mix (Integrase + Excisionase) for Gateway LR recombination. | Catalyzes recombination between attL (Entry) and attR (Destination) sites. |
| pENTR/D-TOPO Vector | Topoisomerase I-activated Entry Vector for creating Gateway Entry Clones. | Allows rapid, directional TA cloning of PCR products with attL sites. |
| Complete Protease Inhibitor Cocktail | Protects expressed protein from degradation during cell lysis and purification. | Essential for unstable proteins; use EDTA-free if doing IMAC purification. |
System Visualization & Workflows
T7/pET System Induction Pathway
Gateway LR Recombination Cloning Workflow
Decision Tree for Expression Vector Selection
Within the critical research framework of optimizing protein expression in E. coli, a primary bottleneck remains the production of soluble, functional, and easily purifiable recombinant proteins. This technical guide provides an in-depth analysis of four principal fusion tag systems—His-tag, GST (Glutathione S-transferase), MBP (Maltose-binding protein), and SUMO (Small Ubiquitin-like Modifier)—detailing their mechanisms for enhancing solubility and streamlining purification. We present comparative data, detailed experimental protocols, and visual workflows to equip researchers with the knowledge to select and implement the optimal tag strategy for their specific protein target.
The pursuit of high-yield soluble protein expression in E. coli is central to structural biology, enzymology, and therapeutic development. Despite its advantages, common issues include protein aggregation (inclusion body formation), low solubility, proteolytic degradation, and inefficient recovery. Fusion tags and partner proteins serve as indispensable tools to circumvent these hurdles, acting as solubility enhancers, purification handles, and sometimes folding catalysts. The choice of tag directly influences yield, purity, and the functional state of the final product, making it a pivotal experimental variable in any E. coli expression project.
Comparative Analysis of Major Fusion Tag Systems
The following table summarizes the core characteristics and performance metrics of the four featured systems.
Table 1: Comparison of Major Fusion Tag Systems
| Feature | Polyhistidine (His-tag) | GST | MBP | SUMO |
|---|---|---|---|---|
| Typical Size | 6-10 aa (~1 kDa) | ~26 kDa | ~40 kDa | ~11 kDa |
| Primary Function | Affinity Purification | Solubility & Purification | Solubility Enhancer | Solubility & Cleavage |
| Affinity Matrix | Immobilized Metal (Ni²⁺, Co²⁺) | Glutathione Agarose | Amylose Resin | (Purification via His-tag often appended) |
| Elution Agent | Imidazole (competitive) | Reduced Glutathione | Maltose | (Tag removal required) |
| Binding Capacity | High (5-20 mg/mL resin) | Moderate (5-10 mg/mL) | Moderate (3-8 mg/mL) | N/A |
| Solubility Enhancement | Low (often none) | High | Very High | High |
| Common Cleavage Protease | N/A (rarely cleaved) | Thrombin, PreScission | Factor Xa, TEV | ULP1 (highly specific) |
| Key Advantage | Speed, simplicity, native conditions | Good for difficult proteins; dimerization can help | Most effective for preventing aggregation | Efficient, precise cleavage; no residue left |
In-Depth Protocols
Protocol 1: Tandem Affinity Purification with His-SUMO Tag
This protocol leverages the solubility benefits of SUMO and the high-affinity purification of the His-tag, followed by precise cleavage.
- Construct Design: Clone gene of interest (GOI) into vector downstream of a His-tagged SUMO sequence.
- Expression: Transform BL21(DE3) E. coli. Grow culture to OD600 ~0.6, induce with 0.5-1 mM IPTG at 16-18°C for 16-20 hours.
- Lysis: Harvest cells, resuspend in Lysis Buffer (50 mM Tris-HCl pH 8.0, 300 mM NaCl, 10 mM imidazole, 1 mM PMSF, 1 mg/mL lysozyme). Lyse via sonication.
- Immobilized Metal Affinity Chromatography (IMAC):
- Clarify lysate by centrifugation (20,000 x g, 30 min).
- Load supernatant onto Ni-NTA agarose column pre-equilibrated with Binding/Wash Buffer (50 mM Tris-HCl pH 8.0, 300 mM NaCl, 20 mM imidazole).
- Wash with 10-15 column volumes (CV) of Wash Buffer.
- Elute with 5 CV of Elution Buffer (50 mM Tris-HCl pH 8.0, 300 mM NaCl, 250 mM imidazole).
- SUMO Protease (ULP1) Cleavage:
- Dialyze or desalt eluate into Cleavage Buffer (50 mM Tris-HCl pH 8.0, 150 mM NaCl).
- Add recombinant ULP1 protease at 1:50 (protease:substrate) molar ratio. Incubate at 4°C for 4-6 hours or 30°C for 1-2 hours.
- Reverse IMAC: Pass cleavage reaction over fresh Ni-NTA resin. The cleaved His-SUMO tag and protease (often His-tagged) bind, while the untagged target protein flows through for collection.
Protocol 2: GST Fusion Protein Pulldown (Interaction Studies)
This protocol is used for both purification and protein-protein interaction assays.
- Expression & Lysis: Express GST-GOI fusion as above. Lyse cells in GST Lysis Buffer (1x PBS pH 7.4, 1% Triton X-100, 1 mM DTT, protease inhibitors).
- Glutathione Affinity Capture:
- Clarify lysate. Incubate supernatant with Glutathione Sepharose 4B beads (0.5 mL bed volume per liter culture) for 1 hour at 4°C with gentle rotation.
- Pellet beads (500 x g, 5 min). Wash 3x with 10 bead volumes of Wash Buffer (1x PBS, 1 mM DTT).
- Elution or On-Bead Assay:
- For purification: Elute with 5 bead volumes of Elution Buffer (50 mM Tris-HCl pH 8.0, 10 mM reduced glutathione). Collect fractions.
- For interaction studies: Incubate washed beads bound to GST-GOI with potential partner protein lysate. Wash stringently, then elute with SDS-PAGE sample buffer for analysis.
Visual Workflows
His-SUMO Tag Protein Purification Workflow
Decision Logic for Fusion Tag Selection
The Scientist's Toolkit: Essential Research Reagent Solutions
Table 2: Key Reagents for Fusion Tag Experiments
| Reagent / Material | Function & Key Feature |
|---|---|
| pET-based Expression Vectors (e.g., pET-28a, pGEX-6P, pMAL, pSUMO) | Engineered plasmids with T7 promoter for high-level, inducible expression of tagged fusions. |
| BL21(DE3) Competent Cells | Standard E. coli host for T7 RNA polymerase-driven expression; offers tunable protein production. |
| Ni-NTA Superflow Resin | High-capacity immobilized metal affinity chromatography matrix for robust His-tag purification. |
| Glutathione Sepharose 4B | Beads with immobilized glutathione for high-affinity, specific capture of GST-tagged proteins. |
| Amylose Resin | Cross-linked amylose matrix for affinity purification of MBP-tagged proteins via maltose binding. |
| ULP1 Protease (SenP2) | Highly specific cysteine protease recognizing the SUMO fold; leaves no extra residues. |
| TEV Protease | Highly specific protease with recognition sequence (Glu-Asn-Leu-Tyr-Phe-Gln↓Gly); common for MBP/GST. |
| PreScission Protease | Human Rhinovirus 3C protease; cleaves between Gln and Gly in the LEVLFQ↓GP sequence. |
| Reduced Glutathione | Competitive elution agent for releasing GST-fusion proteins from the affinity matrix. |
| Imidazole | Competitive eluent for His-tagged proteins; used in wash (low conc.) and elution (high conc.) buffers. |
Within the broader thesis on factors affecting protein expression in E. coli, host strain selection is a foundational variable. The BL21(DE3) lineage and its derivatives are engineered to address specific bottlenecks in recombinant protein production. This guide provides an in-depth analysis of strains optimized for challenging targets: proteins requiring disulfide bond formation, containing rare codons, or being membrane-associated.
BL21(DE3): The Parent Strain
The BL21(DE3) strain is lysogenized with λDE3, carrying the T7 RNA polymerase gene under control of the lacUV5 promoter, enabling IPTG-inducible, high-level expression of genes cloned into T7-based vectors.
Strains for Cytoplasmic Disulfide Bond Formation
In the reducing cytoplasm of standard E. coli, disulfide bonds often fail to form. Specialized strains alter the thioredoxin (trxB) and glutathione reductase (gor) pathways to create an oxidative cytoplasm.
Key Strains:
- Origami(DE3): trxB gor double mutant with enhanced disulfide bond formation. Combined with mutations for selenomethionine production (met auxotroph).
- SHuffle: Engineered to express a misfolded variant of DsbC (a disulfide bond isomerase) in the cytoplasm, actively catalyzing correct disulfide bond formation.
Quantitative Comparison:
| Strain | Genotype (Key Mutations) | Primary Application | Typical Yield Improvement (vs. BL21(DE3)) | Key Feature |
|---|---|---|---|---|
| BL21(DE3) | ompT hsdSB(rB- mB-) gal dcm (DE3) | Standard soluble expression | Baseline | General purpose T7 expression |
| Origami(DE3) | trxB gor lacZ::T7 polymerase (DE3) ahpC | Cytoplasmic disulfide bonds | 2-10x for disulfide-rich proteins | Oxidizing cytoplasm |
| SHuffle T7 | trxB gor lacZ::T7 polymerase (DE3) ahpC dsbC (cytoplasmic) | Complex disulfide bonds | Up to 15x for multi-disulfide proteins | Active cytoplasmic isomerase |
Experimental Protocol: Expression and Analysis of a Disulfide-Bonded Protein
- Transformation: Transform plasmid into chemically competent SHuffle or Origami cells.
- Culture: Inoculate LB + antibiotics + 0.5% glucose (to repress basal expression). Grow overnight at 30°C (SHuffle) or 37°C.
- Expression: Dilute culture 1:50 into fresh medium. Grow to OD600 ~0.6-0.8. Induce with 0.1-1.0 mM IPTG. Reduce temperature to 16-25°C. Express for 16-20 hours.
- Lysis: Harvest cells. Lyse in B-PER or via sonication in non-reducing lysis buffer (omit DTT/β-mercaptoethanol).
- Analysis: Run soluble fraction on non-reducing SDS-PAGE. Confirm disulfide bonds by comparing mobility shifts between reduced (+DTT) and non-reduced samples.
Diagram Title: Engineering E. coli for cytoplasmic disulfide bond formation.
Strains for Rare Codon Issues
Proteins with codons rarely used in E. coli (e.g., AGG/AGA for Arg, AUA for Ile) suffer from translational stalling, truncation, and misfolding. Rosetta strains supply tRNAs for these codons.
Key Strains:
- Rosetta(DE3): Supplies tRNAs for AUA, AGG, AGA, CUA, CCC, GGA on a chloramphenicol-resistant plasmid.
- Rosetta2(DE3): Improved version with a more stable plasmid carrying the same tRNA genes.
Quantitative Comparison:
| Strain | Supplied tRNAs (Codon) | Compatible Antibiotic | Typical Solubility Improvement | Notes |
|---|---|---|---|---|
| Rosetta(DE3) | AUA, AGG, AGA, CUA, CCC, GGA | Chloramphenicol | Highly variable; can rescue failed expression | Requires maintenance of plasmid |
| Rosetta2(DE3) | AUA, AGG, AGA, CUA, CCC, GGA | Chloramphenicol | Similar to Rosetta, with higher plasmid stability | Preferred derivative |
Experimental Protocol: Testing for Rare Codon Problems
- Parallel Expression: Clone target gene into identical T7 vectors. Transform one into BL21(DE3) and another into Rosetta2(DE3). Include chloramphenicol for Rosetta2.
- Small-scale Test: Perform parallel 5 mL cultures and induction (as per standard protocol).
- Analysis: Compare total protein yield (whole-cell lysate on SDS-PAGE) and solubility (soluble vs. insoluble fraction) between the two strains. A significant increase in full-length soluble product in Rosetta2 indicates rare codon limitation.
Strains for Membrane Protein Expression
Membrane proteins (MPs) are toxic at high levels and require integration into the membrane. Strains are engineered for slower transcription/translation and altered membrane composition.
Key Strains:
- C41(DE3) & C43(DE3): Evolved from BL21(DE3) for MP toxicity tolerance. Mutations reduce T7 RNA polymerase activity, slowing expression.
- Lemo21(DE3): Allows fine-tuning of expression via control of T7 lysozyme (a natural inhibitor of T7 RNA Pol) with rhamnose.
- BL21(DE3)-pLysS: Contains a plasmid expressing T7 lysozyme, reducing basal expression.
Quantitative Comparison:
| Strain | Key Feature | Induction Control | Target Application | Toxicity Mitigation Mechanism |
|---|---|---|---|---|
| C41/C43(DE3) | Evolved mutants | IPTG only | Toxic MPs & aggregates | Reduced T7 RNAP activity |
| Lemo21(DE3) | Tunable expression | IPTG + Rhamnose | MPs, esp. transporters | Titratable T7 lysozyme |
| pLysS/pLysE | Basal repression | IPTG only | Moderately toxic proteins | Constant low T7 lysozyme |
Experimental Protocol: Membrane Protein Expression in C43(DE3)
- Transformation & Culture: Transform plasmid into C43(DE3). Grow overnight in LB + antibiotic at 37°C.
- Expression Scale-up: Dilute 1:100 into 1L TB medium. Grow at 37°C to OD600 ~0.8.
- Induction & Harvest: Induce with low IPTG (0.1-0.5 mM). Lower temperature to 18-25°C. Express for 4-16 hours. Harvest by centrifugation.
- Membrane Preparation: Resuspend cell pellet in lysis buffer. Lyse by French press or sonication. Remove intact cells/debris by low-speed centrifugation (10,000 x g). Isolate membranes by ultracentrifugation (150,000 x g, 1 hr).
- Solubilization & Purification: Solubilize membrane pellet in detergent (e.g., DDM, OG). Incubate with gentle agitation. Remove insoluble material by ultracentrifugation. Proceed with affinity purification from the solubilized supernatant.
Diagram Title: Workflow for membrane protein expression in E. coli.
The Scientist's Toolkit: Research Reagent Solutions
| Item | Function/Application | Example/Notes |
|---|---|---|
| pET Vector Series | High-level, T7 promoter-driven expression. | pET-28a (+His-tag), pET-22b (+pelB signal). |
| MagicMedia | Autoinduction medium; simplifies expression. | Convenient for high-throughput screening. |
| BugBuster Master Mix | Detergent-based cell lysis reagent. | Efficient for soluble protein extraction. |
| Detergents (DDM, OG, LDAO) | Solubilization of membrane proteins. | n-Dodecyl-β-D-maltoside (DDM) is common. |
| Lysozyme & Benzonase | Enzymatic lysis & DNA digestion. | Reduces viscosity of lysates. |
| Protease Inhibitor Cocktails | Prevent degradation during purification. | Essential for unstable proteins. |
| Ni-NTA / Co²⁺ Resin | Immobilized metal affinity chromatography (IMAC). | Standard for His-tagged protein purification. |
| Size Exclusion Columns | Final polishing step; removes aggregates. | Assesses monodispersity (e.g., Superdex). |
| β-Mercaptoethanol / DTT | Reducing agents for disulfide bond analysis. | Compare reduced vs. non-reduced gels. |
| Western Blot Reagents | Detection and confirmation of target protein. | Anti-His, anti-GST antibodies. |
Within the broader thesis on factors affecting recombinant protein expression in E. coli, the strategy for induction is a critical determinant of success. The induction parameters—specifically the concentration of the chemical inducer Isopropyl β-D-1-thiogalactopyranoside (IPTG), the post-induction temperature, and the timing of induction—directly influence protein yield, solubility, and biological activity. This guide provides an in-depth technical analysis of optimizing these interconnected variables to maximize target protein production in E. coli-based systems.
Foundational Principles of Induction
Induction initiates the transcription of the target gene, typically under the control of the lac or T7/lac promoter systems. IPTG inactivates the LacI repressor, allowing RNA polymerase to bind. However, the subsequent rate and duration of protein synthesis create a metabolic burden, often leading to inclusion body formation if not managed correctly. The core optimization challenge is to balance the rate of transcription/translation with the host cell's capacity for proper folding and post-translational processing.
Key Signaling Pathway: ThelacOperon & Induction Mechanism
The following diagram illustrates the molecular mechanism of IPTG induction in the lac operon system, a foundational concept for strategy optimization.
Diagram Title: Mechanism of IPTG induction in the lac operon system.
Quantitative Optimization of Parameters
The optimal induction strategy is highly protein-specific, but general trends and recommended starting points are derived from meta-analyses of recent literature. The following tables consolidate quantitative data for systematic optimization.
Table 1: Optimization Matrix for IPTG Concentration and Temperature
| Target Protein Characteristic | Recommended IPTG Range | Recommended Post-Induction Temperature | Primary Rationale |
|---|---|---|---|
| Soluble, non-toxic protein | 0.1 - 1.0 mM | 30°C - 37°C | Maximizes yield without overwhelming chaperone systems. |
| Aggregation-prone / Insoluble | 0.01 - 0.1 mM | 16°C - 25°C | Slows translation rate to favor proper folding; reduces metabolic load. |
| Membrane-associated | 0.05 - 0.5 mM | 18°C - 28°C | Slows synthesis for proper membrane integration. |
| Toxic to host cells | 0.001 - 0.05 mM (Autoinduction) | 20°C - 30°C | Minimizes basal expression; autoinduction allows high cell density first. |
Table 2: Optimization of Induction Timing (OD600)
| Growth Phase at Induction | Typical OD600 Range | Advantages | Disadvantages |
|---|---|---|---|
| Mid-log phase | 0.4 - 0.6 | Minimal nutrient depletion, healthy cells, reproducible. | Lower final biomass, potential for lower total yield. |
| Late-log / Early stationary | 0.6 - 1.2 (varies) | Higher biomass, can increase total protein yield. | Nutrient limitation may stress cells, increasing inclusion bodies. |
| High-density (autoinduction) | >2.0 | Maximizes biomass before induction; simplifies process. | Requires specialized medium; not suitable for highly toxic proteins. |
Detailed Experimental Protocols for Optimization
Protocol 1: IPTG Concentration & Temperature Matrix Screen
Objective: To empirically determine the optimal IPTG concentration and post-induction temperature for a new protein.
- Culture Preparation: Inoculate 5 mL LB with antibiotic(s) from a single colony. Grow overnight (37°C, 220 rpm).
- Main Culture: Dilute overnight culture 1:100 into fresh, pre-warmed LB medium (50 mL in 250 mL baffled flasks). Incubate at 37°C with shaking (220 rpm).
- Induction: When OD600 reaches 0.5, aliquot 5 mL of culture into each of 12 pre-warmed tubes.
- Parameter Matrix: Add IPTG to each tube to final concentrations of 0.01, 0.1, and 1.0 mM. Immediately place sets of tubes (for each IPTG concentration) into four shaking incubators set at 16°C, 25°C, 30°C, and 37°C.
- Harvest: Continue incubation for 4-6 hours (or overnight for low temperatures). Take final OD600 and harvest cells by centrifugation (4,000 x g, 20 min).
- Analysis: Analyze pellets for total expression (by SDS-PAGE of whole-cell lysates) and solubility (by comparing supernatant and pellet fractions after sonication and centrifugation).
Protocol 2: Time-Course Induction at Different OD600
Objective: To determine the optimal cell density for induction.
- Culture Setup: Prepare a 500 mL main culture in a 2 L baffled flask. Monitor OD600 closely.
- Induction Points: Remove 50 mL aliquots at OD600 = 0.4, 0.6, 0.8, and 1.0.
- Induce: Add pre-optimized IPTG concentration (from Protocol 1) to each aliquot.
- Post-Induction: Incubate all induced aliquots at the pre-optimized temperature with shaking.
- Harvest Time-Course: From each aliquot, collect 10 mL samples at 2, 4, 6, and 18 hours post-induction.
- Analysis: Process samples as in Protocol 1. Plot target protein yield (by band intensity or assay) versus induction OD and post-induction time.
Protocol 3: Autoinduction Protocol for High-Throughput
Objective: To express proteins without monitoring OD600, ideal for screening.
- Medium Preparation: Use ZYP-5052 autoinduction medium or equivalent. Ensure the presence of required antibiotics.
- Inoculation: Inoculate directly from a colony or small preculture into 1-5 mL of autoinduction medium in a deep-well block or small flask.
- Growth & Induction: Incubate at desired temperature (e.g., 25°C) with vigorous shaking (≥250 rpm) for 18-24 hours. Induction occurs automatically as lactose metabolizes upon glucose exhaustion.
- Harvest: Pellet cells and analyze as before.
Experimental Workflow for Systematic Optimization
The following diagram outlines a logical, stepwise workflow for developing an optimized induction strategy.
Diagram Title: Stepwise workflow for induction parameter optimization.
The Scientist's Toolkit: Key Research Reagent Solutions
Table 3: Essential Materials for Induction Optimization Experiments
| Item | Function & Rationale |
|---|---|
| IPTG (Isopropyl β-D-1-thiogalactopyranoside) | Chemical inducer; binds LacI repressor to de-repress T7/lac or lac promoters. Stock solutions (e.g., 1M, sterile-filtered) are stable at -20°C. |
| Autoinduction Media (e.g., ZYP-5052) | Contains glucose, lactose, and glycerol. Glucose represses induction until exhausted, allowing high-density growth before automatic induction by lactose. |
| Baffled Culture Flasks | Increases oxygen transfer efficiency, ensuring aerobic growth conditions critical for healthy, high-yield cultures. |
| Temperature-Controlled Shaking Incubators | Essential for precise post-induction temperature optimization, especially for low-temperature expressions. |
| Spectrophotometer & Cuvettes | For accurate monitoring of optical density at 600 nm (OD600) to determine induction timing. |
| Protease Inhibitor Cocktails | Added during cell lysis to prevent degradation of the recombinant protein, especially in lengthy low-temperature inductions. |
| Sonication or French Press | For efficient cell lysis to analyze total protein expression and solubility fractionation. |
| His/Ni-NTA or GST Resin | For rapid small-scale purification (e.g., from 1 mL culture) to assess protein integrity and solubility quickly. |
| Precision Balance & pH Meter | For accurate media and buffer preparation, a foundational requirement for reproducible growth conditions. |
Optimizing IPTG concentration, temperature, and timing is not a one-size-fits-all endeavor but a systematic process of balancing transcriptional drive with the host cell's physiological state. The integrated data and protocols provided here serve as a robust framework within the broader context of E. coli expression optimization. By employing a matrix-based screening approach followed by detailed time-course analysis, researchers can efficiently converge on an induction strategy that maximizes both the quantity and quality of the target recombinant protein, thereby accelerating downstream research and development pipelines.
Within the pursuit of optimizing recombinant protein expression in E. coli, upstream process development is paramount. While genetic constructs and strain engineering define potential, the cellular physiological state—directly governed by fermentation techniques—determines the realized yield. This guide details the core bioprocessing pillars of high-density fermentation, media design, and feeding strategies, framed as critical, often limiting, factors in the broader thesis of maximizing functional protein output in E. coli.
Media Formulation: The Nutritional Foundation
Media composition dictates metabolic pathways, growth rates, and ultimately, the metabolic burden of protein production. The choice between defined, complex, and semi-defined media balances reproducibility, cost, and support for high cell density.
Key Media Types and Impact on Protein Expression
| Media Type | Key Components | Typical Final OD600 | Impact on Protein Expression | Primary Use Case |
|---|---|---|---|---|
| Defined (Minimal) | Salts, single C-source (e.g., Glucose, Glycerol), N-source (e.g., NH4Cl) | 10 - 40 | High reproducibility; avoids catabolite repression with careful feeding; allows metabolic flux analysis. | Isotopic labeling; metabolic studies; therapeutic protein production (regulatory clarity). |
| Complex (Rich) | Tryptone, Yeast Extract, Peptones | 5 - 15 (batch) | Supports rapid growth; high basal expression; components are undefined and variable. | Initial clone screening; scale-up seed train; non-therapeutic protein production. |
| Semi-Defined | Defined base + specific supplements (e.g., amino acids, vitamins) | 30 - 60+ | Balances definition with support for high density; can supplement auxotrophic strains. | High-density production runs where defined media lacks essential factors. |
Experimental Protocol: Optimizing Media for a Toxic Protein
- Design: Prepare 3 x 500 mL shake flasks with (a) Defined (M9 + 0.4% glucose), (b) Complex (2xYT), and (c) Semi-defined (M9 + 0.4% glucose + 0.2% casamino acids + vitamin mix).
- Inoculation: Inoculate each with 1% overnight culture of the expression strain harboring the toxic protein plasmid.
- Growth: Grow at 37°C, 220 rpm to mid-log phase (OD600 ~0.6-0.8).
- Induction: Induce expression with IPTG (e.g., 0.5 mM final).
- Sampling: Take samples at 0, 2, 4, and 6 hours post-induction for OD600 and cell viability (CFU plating).
- Analysis: Pellet cells for SDS-PAGE and Western blot. Correlate specific yield (protein/OD) with growth curve and viability drop to identify media that mitigates toxicity.
Feeding Strategies for High-Density Fermentation
Achieving cell densities (OD600 > 50) requires controlled substrate delivery to prevent overflow metabolism (e.g., acetate formation) and oxygen limitation.
Quantitative Comparison of Feeding Strategies
| Strategy | Control Mode | Target Growth Rate (µ, h⁻¹) | Typical Final OD600 | Acetate Risk | Complexity |
|---|---|---|---|---|---|
| Batch | N/A | Variable, high initial | 3-10 | High | Low |
| Fed-Batch (Constant Rate) | Open-loop | Decreasing over time | 50-100 | Medium | Low |
| Exponential Feeding | Closed-loop (pre-set µ) | Constant (e.g., 0.15-0.25) | 100-200 | Low | Medium |
| DO-Stat | Closed-loop (DO feedback) | Variable, DO-limited | 80-150 | Low-Medium | Medium |
| Nutrient-Limited (e.g., N-Source) | Closed-loop (Metabolite) | Controlled by limiting nutrient | Varies | Very Low | High |
Experimental Protocol: Implementing an Exponential Feed for High-Density Production
- Bioreactor Setup: Sterilize a 5L bioreactor with 2L of defined minimal medium (e.g., Modified R Medium). Calibrate pH and DO probes.
- Batch Phase: Inoculate to OD600 0.1. Allow cells to grow on the initial carbon source (e.g., 10 g/L glycerol).
- Feed Initiation: Begin feed when carbon is nearly depleted (DO spike, ~OD600 5-10). The feed medium is typically 500-700 g/L glycerol in water.
- Feed Calculation: The feed rate ( F(t) ) is calculated to maintain a desired specific growth rate (µ): ( F(t) = (\mu / Y{X/S}) * (X0 * V0 / S0) * e^{\mu t} ), where ( Y{X/S} ) is yield coefficient, ( X0 ) is initial biomass, ( V0 ) is initial volume, ( S0 ) is feed substrate concentration.
- Induction: At target biomass (e.g., OD600 50-80), reduce temperature to 25-30°C and induce with IPTG or auto-induction.
- Post-Induction Feed: Switch to a reduced feed rate (e.g., 25-50% of pre-induction) to maintain metabolism without excessive growth.
Diagram Title: Exponential Feed-Batch Fermentation Workflow
Integrated View: Pathway to High-Titer Protein
The interplay between media, feeding, and cellular physiology centers on managing central metabolism to direct resources toward recombinant protein synthesis rather than waste products or excessive biomass.
Diagram Title: Process Impact on E. coli Protein Production Pathway
The Scientist's Toolkit: Key Research Reagent Solutions
| Item/Reagent | Function in Advanced Culture | Key Consideration |
|---|---|---|
| Defined Media Kits (e.g., M9, MOPS) | Provides a chemically reproducible base for metabolic studies and controlled feeding. | Consistency, absence of undefined components, carbon source flexibility. |
| Antifoam Agents (e.g., PPG, silicone based) | Controls foam in aerated bioreactors to prevent probe fouling and vessel overflow. | Must be sterile, biocompatible, and minimal to avoid affecting downstream purification. |
| Trace Metal Solutions | Supplies essential co-factors (Fe, Zn, Co, Mo, etc.) for enzyme function in defined media. | Critical for achieving high cell density; can require chelating agents to prevent precipitation. |
| IPTG & Alternative Inducers | Induces expression from lac/T7 promoters. Auto-inducing media components (lactose) offer alternative. | Concentration and timing critically affect folding; lower concentrations often favor solubility. |
| On-line DO & pH Probes | Provides real-time feedback on metabolic activity and culture condition for dynamic control. | Require proper calibration and sterilization. DO is key for feedback feeding (DO-Stat). |
| High-Density Growth Supplements (e.g., NZ amine, yeast extract) | Used in semi-defined strategies to supply peptides and vitamins that boost density. | Introduces variability; essential for some recalcitrant proteins or strains. |
| Acetate Assay Kits | Quantifies acetate accumulation, a key indicator of metabolic imbalance and feed inefficiency. | Enables optimization of feed rate to stay below inhibitory thresholds (typically <5 g/L). |
| Glycerol Feedstock (Pharma Grade) | Primary carbon source for many fed-batch processes due to low cost and reduced overflow metabolism vs. glucose. | High concentration feed solutions must be sterile-filtered, not autoclaved, to avoid caramelization. |
Within a broader thesis investigating factors affecting recombinant protein expression in E. coli, robust analytical monitoring is paramount. Success hinges on the ability to track bacterial growth and precisely assess the yield, solubility, and integrity of the target protein. This guide details the core analytical pipeline, from basic biomass measurement (OD600) to definitive protein characterization (Western Blotting), providing the technical framework essential for researchers and drug development professionals.
Optical Density at 600 nm (OD600): Monitoring Growth Kinetics
OD600 is a turbidimetric method used to estimate microbial cell density in a liquid culture. It is a critical first step, as induction timing and culture harvest are often based on growth phase, which directly impacts protein expression yield and solubility.
Protocol: Measuring OD600
- Blank the Spectrophotometer: Use fresh, sterile growth medium (e.g., LB broth) to zero the instrument at 600 nm.
- Dilution: For accurate readings, dilute the E. coli culture so that the measured OD600 falls between 0.1 and 0.4. This range is typically within the instrument's linear range. A 1:10 dilution in fresh medium is common for mid-log phase cultures.
- Measurement: Vortex the culture tube briefly to ensure homogeneity. Pipette the diluted sample into a clean cuvette, wipe the clear sides, and insert it into the spectrophotometer. Record the value.
- Calculation: Multiply the recorded OD600 value by the dilution factor to obtain the OD600 of the original culture.
Table 1: Correlation Between OD600 and E. coli Culture Status
| OD600 Range | Growth Phase | Typical Cell Density (CFU/mL)* | Recommendation for Induction |
|---|---|---|---|
| 0.05 - 0.2 | Early Log | ~1 x 10^7 - 5 x 10^7 | Often too early; low biomass |
| 0.3 - 0.8 | Mid-Log | ~1 x 10^8 - 5 x 10^8 | Optimal for most expressions |
| >0.8 - 1.5 | Late Log / Early Stationary | ~1 x 10^9 | Acceptable for some protocols |
| >1.5 | Stationary | Viable count may plateau | Risk of stress, lower yield |
*Colony Forming Units per mL; approximate correlation.
SDS-PAGE: Assessing Expression and Solubility
Sodium Dodecyl Sulfate Polyacrylamide Gel Electrophoresis (SDS-PAGE) separates denatured proteins based on molecular weight. It is the primary tool for visualizing total protein expression and determining the soluble fraction of the recombinant protein.
Protocol: Sample Preparation for Expression Analysis
- Collect Samples: Take equal culture volumes (e.g., 1 mL) pre-induction and at various time points post-induction.
- Pellet Cells: Centrifuge at >10,000 x g for 2 minutes. Discard supernatant.
- Prepare Total Protein Sample: Resuspend cell pellet in 1X Laemmli buffer (e.g., 100 µL) relative to original culture density (e.g., OD600=1). Boil for 10 minutes.
- Prepare Soluble Fraction Sample: Lyse the pelleted cells from an equivalent sample using sonication or a chemical lysis buffer. Centrifuge at 15,000 x g for 15 minutes at 4°C to pellet insoluble debris (inclusion bodies). Transfer the supernatant (soluble fraction) to a new tube. Mix an aliquot with 1X Laemmli buffer and boil.
- Load and Run: Load 10-20 µL of each boiled sample onto a polyacrylamide gel (e.g., 4-20% gradient) alongside a pre-stained protein ladder. Run at constant voltage (e.g., 120-150V) until the dye front nears the bottom.
Table 2: Key Components of SDS-PAGE
| Component | Function | Typical Composition/Details |
|---|---|---|
| Stacking Gel | Concentrates proteins into a sharp band before separation | Low % acrylamide (e.g., 4%), Tris-HCl pH 6.8 |
| Resolving Gel | Separates proteins by molecular weight | Higher % acrylamide (e.g., 12-15%), Tris-HCl pH 8.8 |
| SDS (Sodium Dodecyl Sulfate) | Denatures proteins and confers uniform negative charge | 0.1% in gels and buffers |
| Laemmli Buffer | Loading buffer containing SDS, reducing agent (β-mercaptoethanol), dye | Tris-HCl, Glycerol, SDS, Bromophenol Blue, β-ME/DTT |
| Coomassie Stain | General protein visualization dye | R-250 or G-250 variants; detects ~50-100 ng/band |
Western Blotting: Confirming Protein Identity
Western blotting (immunoblotting) transfers proteins from an SDS-PAGE gel to a membrane, where a target-specific antibody is used for detection. This confirms the identity of the recombinant protein and can assess purity.
Protocol: Western Blotting
- Transfer: Following SDS-PAGE, assemble a transfer stack in the order: cathode, sponge, filter paper, gel, nitrocellulose/PVDF membrane, filter paper, sponge, anode. Proteins are transferred via wet or semi-dry electrophoresis (e.g., 100V for 60 min at 4°C).
- Blocking: Incubate membrane in 5% (w/v) non-fat dry milk or BSA in TBST (Tris-Buffered Saline with 0.1% Tween-20) for 1 hour at room temperature to prevent nonspecific antibody binding.
- Primary Antibody Incubation: Incubate membrane with primary antibody (specific to target protein or tag, e.g., His-tag, GST) diluted in blocking buffer. Incubate overnight at 4°C or 1-2 hours at RT.
- Washing: Wash membrane 3-5 times for 5 min each with TBST.
- Secondary Antibody Incubation: Incubate membrane with an enzyme-conjugated secondary antibody (e.g., HRP-anti-mouse) for 1 hour at RT.
- Detection: Apply chemiluminescent substrate (e.g., Luminol/enhancer) to the membrane and visualize signal using a digital imager.
Table 3: Key Reagents for Western Blotting
| Reagent | Function | Key Consideration |
|---|---|---|
| Transfer Membrane | Binds proteins for probing | Nitrocellulose (high affinity), PVDF (durability, requires methanol activation) |
| Blocking Agent | Reduces nonspecific background | Milk (general use), BSA (for phospho-specific antibodies) |
| Primary Antibody | Binds target protein with high specificity | Monoclonal (consistent), Polyclonal (high signal; variable) |
| HRP-Conjugated Secondary Antibody | Binds primary antibody for detection | Species-specific (e.g., anti-mouse, anti-rabbit) |
| Chemiluminescent Substrate | Generates light upon HRP enzymatic reaction | Enhanced sensitivity substrates can detect fg-pg of protein |
The Scientist's Toolkit: Essential Research Reagent Solutions
| Item | Function |
|---|---|
| LB Broth (Luria-Bertani) | Standard rich medium for E. coli cultivation. |
| IPTG (Isopropyl β-D-1-thiogalactopyranoside) | Inducer for T7/lac-based expression systems. |
| Lysozyme & DNase I | Enzymes for gentle cell lysis during soluble fraction preparation. |
| Protease Inhibitor Cocktail (EDTA-free) | Prevents proteolytic degradation of recombinant protein during lysis. |
| Precast Polyacrylamide Gels | Ensure consistency and save time in SDS-PAGE. |
| Pre-stained Protein Ladder | Allows tracking of electrophoresis and transfer efficiency. |
| Nitrocellulose Membrane (0.45µm) | Standard blotting membrane for most proteins >20 kDa. |
| HRP Chemiluminescent Substrate Kit | Sensitive, non-radioactive detection for Western blots. |
| Anti-His Tag Monoclonal Antibody | Common primary antibody for detecting polyhistidine-tagged proteins. |
Experimental Workflow Diagram
Title: Workflow for Monitoring E. coli Protein Expression.
Key Signaling Pathway in Induction
Title: IPTG Induction Pathway in T7 Systems.
Solving the Puzzle: Systematic Troubleshooting for Low Yield, Insolubility, and Degradation
In the context of optimizing protein expression in E. coli—a cornerstone of molecular biology, biotechnology, and drug development—systematic troubleshooting is essential. The choice of expression system, host strain, and culture conditions are primary Factors affecting protein expression in E. coli research. This guide provides a structured diagnostic flowchart and detailed protocols to identify and resolve issues leading to low or no recombinant protein yield.
Table 1: Major Factors Contributing to Low Protein Expression in E. coli
| Factor Category | Specific Issue | Typical Impact on Yield | Recommended Solution |
|---|---|---|---|
| Vector/Sequence | Rare/Suboptimal Codons | Up to 100-fold reduction | Use codon-optimized gene or co-express tRNA plasmids. |
| Weak/Incorrect Promoter | Failure to initiate transcription | Switch to strong, inducible promoters (e.g., T7, tac). | |
| mRNA Secondary Structure | Inhibition of translation initiation | Modify 5' gene sequence or use destabilizing sequences. | |
| Host Strain | Proteolytic Degradation | Complete loss of soluble protein | Use protease-deficient strains (e.g., BL21(DE3) ompT, lon). |
| Lack of Required tRNAs | Premature translation termination | Use Rosetta or other codon-enhanced strains. | |
| Toxicity/Leaky Expression | Low cell density pre-induction | Use tighter control strains (e.g., BL21(DE3)pLysS). | |
| Culture Conditions | Incorrect Induction | No expression | Optimize inducer concentration (IPTG: 0.1-1.0 mM) and temperature (16-37°C). |
| Insoluble Aggregation (Inclusion Bodies) | High expression but no soluble protein | Lower growth temperature (16-30°C), reduce inducer concentration, or use solubility tags. | |
| Inadequate Aeration/Cell Density | Low volumetric yield | Ensure OD600 at induction is optimal (typically 0.6-0.8 for log-phase). |
Table 2: Key Reagents for Troubleshooting Expression
| Reagent | Function/Application | Example Product/Strain |
|---|---|---|
| Codon Enhancement Plasmids | Supply rare tRNAs for AGG, AGA, AUA, etc. | pRARE2, Rosetta strains |
| Protease Inhibitor Cocktails | Prevent degradation during lysis and purification | PMSF, EDTA-free tablets |
| Solubility Enhancement Tags | Increase soluble fraction of fusion protein | MBP, GST, SUMO, Trx |
| Alternative Inducers | Fine-tune expression levels where IPTG is toxic | Lactose, auto-induction media |
| Membrane Protein Specialized Strains | Optimize expression of challenging membrane proteins | C41(DE3), C43(DE3) |
Experimental Protocols for Key Diagnostic Steps
Protocol 1: Rapid Small-Scale Expression Test & SDS-PAGE Analysis Objective: To confirm expression and approximate yield and solubility.
- Transformation & Inoculation: Transform expression plasmid into appropriate E. coli strain (e.g., BL21(DE3)). Pick a single colony into 5 mL LB with antibiotic. Incubate overnight at 37°C, 220 rpm.
- Induction: Dilute overnight culture 1:100 into 5 mL fresh medium (+ antibiotic). Grow at 37°C to OD600 ~0.6. Take a 1 mL pre-induction sample (centrifuge, discard supernatant, store pellet at -20°C). Add inducer (e.g., 0.5 mM IPTG). Split culture: incubate one aliquot at 37°C, another at 18°C for 4-16 hours. Take 1 mL post-induction samples.
- Lysis & Fractionation: Resuspend pellets in 100 µL lysis buffer (e.g., 50 mM Tris-HCl pH 8.0, 1 mg/mL lysozyme). Freeze-thaw once. Sonicate briefly or treat with 1% Triton X-100. Centrifuge at 15,000 x g for 10 min. Collect supernatant (soluble fraction). Resuspend pellet in 100 µL inclusion body solubilization buffer (e.g., 8M urea or 1% SDS).
- Analysis: Load 10-20 µL of each fraction (pre-induction, total post-induction, soluble, insoluble) on an SDS-PAGE gel. Stain with Coomassie Blue. Compare band intensity at predicted molecular weight.
Protocol 2: mRNA Level Analysis via RT-qPCR Objective: Differentiate between transcriptional and translational/post-translational failure.
- RNA Extraction: Harvest 1 mL of culture pre- and post-induction. Use an RNA stabilization reagent immediately. Extract total RNA using a commercial kit with DNase I treatment.
- Reverse Transcription: Use random hexamers or gene-specific primers and a reverse transcriptase to generate cDNA.
- qPCR: Design primers for the target gene and a housekeeping gene (e.g., rpoB). Perform SYBR Green qPCR. Calculate relative fold-change in target mRNA using the 2^(-ΔΔCt) method. Low mRNA levels suggest promoter, terminator, or plasmid copy number issues.
The Scientist's Toolkit: Research Reagent Solutions
| Item | Function/Explanation |
|---|---|
| BL21(DE3) Competent Cells | Standard workhorse for T7 promoter-based expression; lacks Lon and OmpT proteases. |
| Rosetta 2 Competent Cells | BL21 derivative that supplies tRNAs for 7 rare codons (AUA, AGG, AGA, CUA, CCC, GGA, CGG). |
| BL21(DE3)pLysS Strains | Contain plasmid expressing T7 lysozyme, which inhibits basal T7 RNA polymerase activity for tight control of toxic genes. |
| pET Series Vectors | Most common vectors for high-level, inducible T7-driven expression. |
| Autoinduction Media | Allows high-density growth with automatic induction at stationary phase, ideal for screening. |
| BugBuster Master Mix | Commercial reagent for gentle, non-denaturing cell lysis and soluble protein extraction. |
| HisTrap HP Columns | Immobilized metal affinity chromatography (IMAC) columns for rapid purification of His-tagged proteins. |
| TEV Protease or Thrombin | For precise removal of affinity tags after purification to obtain native protein. |
Diagnostic Flowcharts & Visualizations
Title: Flowchart for Diagnosing Low/No Protein Expression
Title: Core Experimental Workflow for Troubleshooting
Within the context of a broader thesis on factors affecting protein expression in E. coli, addressing protein insolubility and inclusion body (IB) formation is a critical downstream challenge. This guide provides an in-depth technical comparison of two principal strategies: in vitro refolding and in vivo solubility enhancement.
Core Mechanisms and Quantitative Outcomes
The choice between strategies is guided by target protein characteristics and project goals. The following table summarizes key quantitative data from recent studies (2023-2024).
Table 1: Comparative Outcomes of Refolding vs. Solubility Enhancement Strategies
| Strategy | Typical Soluble Yield Range | Success Rate (Varies by Protein) | Key Advantage | Major Limitation | Scale-Up Feasibility |
|---|---|---|---|---|---|
| In Vitro Refolding | 10-60% of refolded protein | Moderate to High (for robust proteins) | Purification simplified via IBs; removes cellular contaminants. | Low total yield; empirically driven; aggregation during dilution. | High, but cost-intensive. |
| In Vivo Solubility Enhancement | 2-50 mg/L culture (can be higher) | Highly Variable (protein-dependent) | Native folding; avoids denaturation/renaturation. | Fusion tag cleavage needed; may not work for all proteins. | Excellent for microbial fermentation. |
| Common Fusion Tags | N/A | >80% of E. coli targets show some improvement | Simple cloning and expression. | Tags can affect structure/function. | Excellent. |
| Molecular Chaperone Co-expression | Often 2-10 fold increase over baseline | Moderate | Promotes native folding in cell. | Can burden cellular machinery. | Good. |
Data synthesized from recent literature reviews and primary research on prokaryotic expression systems.
Experimental Protocols
Protocol 2.1: Standard Inclusion Body Refolding by Dilution
Objective: To recover active protein from isolated inclusion bodies.
- IB Isolation & Washing: Resuspend cell pellet in Lysis Buffer (20 mM Tris-HCl pH 8.0, 100 mM NaCl, 1 mM EDTA, 0.1% Triton X-100, 1 mg/mL lysozyme). Incubate 30 min on ice, sonicate. Centrifuge at 15,000 x g, 30 min, 4°C. Wash pellet sequentially with Wash Buffer I (same as lysis + 0.5% deoxycholate) and Wash Buffer II (20 mM Tris-HCl pH 8.0, 2 M Urea). Centrifuge after each wash.
- Solubilization: Solubilize final IB pellet in Denaturation Buffer (6 M GuHCl, 50 mM Tris pH 8.0, 10 mM DTT, 1 mM EDTA) for 1-2 hrs at room temperature with gentle agitation. Centrifuge to clarify.
- Refolding: Rapidly dilute the denatured protein 50-fold into chilled Refolding Buffer (50 mM Tris pH 8.0, 0.5 M L-Arginine, 1 mM GSH, 0.1 mM GSSG, 0.5 M NaCl). Stir gently for 12-24 hrs at 4°C.
- Concentration & Buffer Exchange: Concentrate refolded protein using centrifugal concentrators (10 kDa MWCO). Exchange into storage or assay buffer via dialysis or gel filtration.
Protocol 2.2: Enhancing Solubility via MBP-Tag Fusion & TEV Cleavage
Objective: To express a challenging protein in soluble form using a fusion partner.
- Cloning: Clone target gene into pMAL-c5X vector (NEB) downstream of the malE gene (encoding MBP) using standard restriction-ligation or Gibson Assembly.
- Expression: Transform into E. coli BL21(DE3) or a derivative like SHuffle for disulfide bonds. Grow culture in LB+Amp to OD600 ~0.6. Induce with 0.3 mM IPTG. Shift temperature to 18-25°C and express for 16-20 hrs.
- Soluble Purification: Harvest cells, lyse in Column Buffer (20 mM Tris-HCl pH 7.4, 200 mM NaCl, 1 mM EDTA). Clarify lysate by centrifugation. Apply supernatant to an amylose resin column. Wash with >10 CV Column Buffer. Elute with Column Buffer + 10 mM maltose.
- Tag Removal: Add purified, recombinant TEV protease (1:50 w/w ratio) to the eluted fusion protein. Dialyze against Cleavage Buffer (50 mM Tris-HCl pH 8.0, 0.5 mM EDTA, 1 mM DTT) at 4°C for 16 hrs.
- Final Purification: Pass cleavage mixture back over amylose resin. The MBP tag and TEV protease bind, while the target protein flows through. Further purify target protein by size-exclusion chromatography.
Strategic Workflow Diagram
Title: Strategic Workflow for Insoluble Protein Recovery
The Scientist's Toolkit: Research Reagent Solutions
Table 2: Essential Reagents for Combating Insolubility
| Reagent / Material | Primary Function in Context | Example / Note |
|---|---|---|
| Detergents & Chaotropes | Solubilize IBs and prevent aggregation during refolding. | Urea (4-8 M), GuHCl (6 M), Sarkosyl (0.1-2%) – Denaturing agents. L-Arginine (0.5-1 M) – Suppresses aggregation in refolding buffers. |
| Redox Couples | Facilitate disulfide bond formation/reshuffling during refolding. | GSH/GSSG Glutathione System – Typical ratio 10:1 to 5:1 (reduced:oxidized). L-Cysteine/Cystamine – Alternative redox pair. |
| Fusion Tag Vectors | Enhance in vivo solubility and often aid purification. | pMAL (MBP), pET-SUMO, pGEX (GST) – Common solubility enhancers. His-tag vectors – For purification but limited solubility aid. |
| Proteases for Tag Cleavage | Remove affinity tags post-purification to obtain native protein. | TEV Protease – High specificity, active at 4°C. PreScission (3C) Protease – Alternative with different recognition site. |
| Chaperone Plasmid Sets | Co-express folding helpers in the host cell. | pG-KJE8, pGro7 – Express DnaK/DnaJ-GrpE and GroEL/GroES sets, respectively. Induced with L-arabinose/tetracycline. |
| Specialized E. coli Strains | Provide a folding-advantaged cellular environment. | SHuffle – Cytoplasmic disulfide bond formation. Origami – Enhances disulfide bonds via trxB/gor mutations. |
| Affinity Chromatography Resins | Purify solubly expressed fusion proteins. | Amylose Resin – For MBP fusions. Glutathione Sepharose – For GST fusions. Ni-NTA Resin – For His-tagged proteins. |
Cellular Folding Pathways & Intervention Points
Title: Folding Pathways and Intervention Points
Within the broader thesis on factors affecting recombinant protein expression in E. coli, proteolytic degradation stands as a critical, often yield-limiting obstacle. The bacterial host’s endogenous proteolytic machinery can rapidly cleave and inactivate heterologously expressed proteins, particularly those that are unstable, misfolded, or expressed in inclusion bodies. This guide details two principal, complementary strategies to mitigate this issue: the use of engineered protease-deficient E. coli strains and the application of protease inhibitor cocktails during cell lysis and purification.
Protease-DeficientE. coliStrains: Genetically Engineered Solutions
Protease-deficient strains are engineered by inactivating genes encoding key cytoplasmic or periplasmic proteases. These strains minimize the co-purification of host proteases and reduce degradation during expression.
Key Protease Targets and Corresponding Strains
The table below summarizes the most commonly targeted proteases, their functions, and representative commercial strains.
Table 1: Common Protease-Deficient E. coli Strains and Their Genetic Backgrounds
| Strain Name | Deleted Protease Genes | Primary Protease Function Affected | Typical Application |
|---|---|---|---|
| BL21(DE3) | ompT, lon | Outer membrane protease T; ATP-dependent cytoplasmic protease | General cytoplasmic expression; baseline for further engineering. |
| BL21(DE3) pLysS/E | ompT, lon (+ T7 lysozyme) | As above, plus controlled lysis via T7 lysozyme expression. | Expression of toxic proteins; tighter control of basal expression. |
| C43(DE3)/C41(DE3) | Derived from BL21, adaptive evolution | Uncharacterized mutations improving membrane protein tolerance. | Expression of toxic membrane and integral membrane proteins. |
| JK321 | degP (htrA) null allele | Periplasmic serine protease; degrades misfolded periplasmic proteins. | Periplasmic expression of secreted proteins. |
| KS1000 | degP, ptr3, yfgC deletions | Multiple proteases, including periplasmic DegP and others. | Enhanced stability of secreted and periplasmic proteins. |
| SHuffle | trxB, gor, ahpC mutations + dsbC expression | Cytoplasmic disulfide bond formation; not strictly protease-deficient, but improves folding. | Cytoplasmic expression of disulfide-bonded proteins, reducing misfolding-induced degradation. |
Protocol: Evaluating Protein Stability in Protease-Deficient Strains
Objective: Compare the stability of a target protein expressed in BL21(DE3) versus a more deficient strain (e.g., BL21 Δlon ΔompT ΔhtrA / degP).
Materials:
- Chemically competent cells of BL21(DE3) and the triple-deletion strain.
- Target gene in a T7 or similar expression vector (e.g., pET series).
- LB broth and appropriate antibiotics.
- IPTG for induction.
- Lysis buffer: 50 mM Tris-HCl (pH 8.0), 150 mM NaCl, 1 mM EDTA, 1 mg/mL lysozyme.
- Protease Inhibitor Cocktail (see Section 3).
- SDS-PAGE equipment and reagents.
Procedure:
- Transform & Culture: Transform both strains with the expression plasmid. Inoculate single colonies into 5 mL LB + antibiotic and grow overnight at 37°C.
- Expression: Dilute overnight cultures 1:100 into fresh medium. Grow at 37°C to an OD600 of 0.6-0.8. Induce with 0.1-1.0 mM IPTG. Shift temperature if required (e.g., to 25°C or 18°C) and continue incubation for 4-16 hours.
- Harvest & Lyse: Harvest cells by centrifugation (5,000 x g, 10 min, 4°C). Resuspend pellets in 1 mL lysis buffer. Incubate on ice for 30 min. Sonicate on ice (3 x 10 sec pulses, 30 sec rest). Split each lysate into two equal aliquots.
- Stability Incubation: To one aliquot from each strain, add a broad-spectrum protease inhibitor cocktail. Leave the other aliquot untreated. Incubate both sets at 4°C or on ice for 2-4 hours.
- Analysis: Centrifuge all samples (16,000 x g, 20 min, 4°C) to separate soluble and insoluble fractions. Analyze the soluble fraction by SDS-PAGE and Western blot (if antibody is available) to assess target protein abundance and degradation fragment patterns.
Workflow for Comparing Protein Stability in Protease-Deficient Strains
Protease Inhibitor Cocktails: Pharmacological Intervention
When genetic strategies are insufficient, or during downstream processing, protease inhibitors are essential. Cocktails combine inhibitors targeting different protease classes.
Classes of Protease Inhibitors and Their Specificities
Table 2: Common Protease Inhibitors and Their Applications in E. coli Lysates
| Inhibitor Class | Target Protease(s) | Common Reagent | Working Concentration | Key Consideration |
|---|---|---|---|---|
| Serine Protease Inhibitors | Lon, DegP (HtrA), OmpT (partly) | PMSF, AEBSF, Benzamidine | 0.1-1 mM (PMSF) | PMSF is unstable in water; add fresh from stock in ethanol/isopropanol. |
| Cysteine Protease Inhibitors | Unknown cytosolic proteases | Leupeptin, E-64 | 1-10 µM | Effective against papain-family enzymes; often included broadly. |
| Metalloprotease Inhibitors | Various metallo-endopeptidases | EDTA, EGTA, 1,10-Phenanthroline | 1-10 mM (EDTA) | Chelates divalent cations (Zn²⁺, Ca²⁺). Can destabilize some proteins. |
| Aspartic Protease Inhibitors | Pepsin-like enzymes (rare in E. coli) | Pepstatin A | 1 µM | Often included for completeness, though less critical for E. coli. |
| Aminopeptidase Inhibitors | Broad-spectrum aminopeptidases | Bestatin | 1-10 µM | Inhibits N-terminal degradation of purified proteins. |
Protocol: Formulating and Applying a Broad-Spectrum Inhibitor Cocktail
Objective: Prepare and use a "EDTA-free" cocktail suitable for downstream applications requiring metal ions (e.g., IMAC purification).
Stock Solutions (prepare in appropriate solvent, store as recommended):
- AEBSF (Serine inhibitor): 100 mM in water. (-20°C)
- Leupeptin (Cysteine/Serine): 10 mM in water. (-20°C)
- Pepstatin A (Aspartic): 1 mM in methanol or DMSO. (-20°C)
- Bestatin (Aminopeptidase): 10 mM in DMSO. (-20°C)
Cocktail Formulation (100X Concentrate): For 1 mL of 100X "EDTA-Free" Cocktail:
- 100 µL AEBSF (100 mM) – Final [1X]: 1 mM
- 10 µL Leupeptin (10 mM) – Final [1X]: 10 µM
- 100 µL Pepstatin A (1 mM) – Final [1X]: 1 µM
- 10 µL Bestatin (10 mM) – Final [1X]: 10 µM
- Bring to 1 mL with sterile water or buffer (e.g., 50 mM Tris, pH 8.0). Vortex. Store at -20°C in aliquots.
Application: Add the 100X cocktail directly to cell suspension or lysate at a 1:100 dilution (e.g., 10 µL per 1 mL lysate). Mix immediately. Always add the cocktail just before or immediately after cell disruption. For IMAC purification, ensure inhibitors are compatible (e.g., avoid EDTA, use AEBSF instead of PMSF).
The Scientist's Toolkit: Essential Research Reagent Solutions
Table 3: Key Reagents for Addressing Proteolytic Degradation
| Reagent / Material | Supplier Examples | Function & Rationale |
|---|---|---|
| BL21(DE3) Competent Cells | NEB, Thermo Fisher, Merck | Standard host for T7-driven expression; deficient in lon and ompT proteases. |
| Protease Inhibitor Cocktail Tablets (EDTA-free) | Roche (cOmplete), Merck (PIC) | Convenient, pre-formulated broad-spectrum cocktails for rapid use in lysis buffers. |
| AEBSF Hydrochloride | GoldBio, Thermo Fisher | Water-soluble, stable alternative to PMSF for serine protease inhibition. |
| Lysozyme (from chicken egg white) | Merck, Sigma-Aldrich | Enzymatically degrades bacterial cell wall, used in gentle lysis protocols. |
| Pierce Protease Inhibitor Mini Tablets, EDTA-Free | Thermo Fisher | Single-use tablets for small-volume lysates, minimizing waste and variability. |
| BugBuster or B-PER Reagents | Merck, Thermo Fisher | Detergent-based lysis reagents for rapid extraction; can be supplemented with inhibitors. |
| HisPur Ni-NTA Resin | Thermo Fisher | Immobilized metal affinity chromatography resin; rapid purification to separate target from proteases. |
| Protease Fluorescent Detection Kit | Thermo Fisher (Pierce) | Quantifies protease activity in lysates to assess inhibitor efficacy or strain deficiency. |
Integrated Strategy and Decision Pathway
The most effective approach often combines both genetic and pharmacological strategies. The following pathway outlines a decision process.
Decision Pathway for Addressing Proteolytic Degradation
Within the multi-factorial analysis of protein expression in E. coli, controlling proteolytic degradation is non-negotiable for obtaining viable yields of intact, functional protein. A hierarchical approach is recommended: begin with an appropriate protease-deficient host, optimize expression conditions to minimize stress and misfolding, and rigorously apply tailored protease inhibitor cocktails during cell lysis. Monitoring protease activity in lysates and systematically comparing strains and conditions, as outlined in the provided protocols, will enable researchers to identify the optimal strategy for their specific target protein, thereby turning a major bottleneck into a manageable variable.
Within the broader thesis investigating Factors affecting protein expression in E. coli research, the control of gene expression is paramount. Unwanted "leaky" expression—transcription and translation occurring in the absence of an intended inducer—poses a significant challenge, particularly when the protein of interest is toxic to the host cell. This leakiness can lead to growth inhibition, reduced biomass, plasmid instability, and ultimately, failed protein production. In contrast, tightly regulated expression systems minimize basal expression, allowing for robust cell growth prior to induction and maximizing yield of even highly toxic proteins. This whitepaper provides an in-depth technical analysis of the mechanisms, quantitative impacts, and experimental strategies surrounding this critical balance.
Mechanisms and Quantitative Impact of Leakiness
Leaky expression arises from incomplete repression in inducible systems. In the lac-based system, for example, the lac repressor (LacI) does not bind its operator sequence with infinite affinity, leading to a low probability of transcription initiation even in the presence of repressor and absence of inducer (IPTG). For toxic proteins, this basal expression selects for mutants with reduced expression capacity, compromising culture integrity.
Table 1: Comparative Basal Expression Levels of Common E. coli Expression Systems
| Expression System | Repressor/Control Mechanism | Typical Reported Basal Expression Level* | Primary Inducer |
|---|---|---|---|
| T7/lacO | LacI binding to T7 promoter | Moderate-High (0.001-0.01% of induced) | IPTG |
| pBAD (araBAD) | AraC dimerization & DNA looping | Very Low (<0.0001% of induced) | L-Arabinose |
| TetR/TetA | TetR binding to tetO | Low (0.0005% of induced) | Anhydrotetracycline (aTc) |
| rhaBAD | RhaS/RhaR activation | Low (0.001% of induced) | L-Rhamnose |
| T7 Express (DE3) LysY/I | T7 Lysozyme inhibition of T7 RNAP | Very Low (with LysY/I genes) | IPTG |
*Basal level is expressed as a fraction of fully induced protein yield. Values are approximate and highly dependent on specific plasmid copy number, promoter sequence, and host genotype. Data synthesized from recent literature (2022-2024).
Table 2: Impact of Protein Toxicity on E. coli Growth Parameters Under Leaky Conditions
| Toxicity Class | Example Protein | Observed OD600 Reduction (vs. empty vector) | Plasmid Loss Rate (per generation)* | Common Cellular Response |
|---|---|---|---|---|
| Mild | Membrane proteins | 10-30% | <5% | Envelope stress (σE, Cpx), chaperone upregulation |
| Severe | Proteases, pore-forming toxins | 50-70% | 10-30% | SOS response, apoptosis-like death, filamentation |
| Extreme | Antimicrobial peptides (e.g., colicins) | >80% | >50% | Rapid loss of culturability, membrane disruption |
*Rate estimated in selective media without induction over ~20 generations.
Experimental Protocols for Assessing Leakiness and Toxicity
Protocol 3.1: Quantitative Assessment of Basal Expression Using Fluorescent Reporters
Objective: Measure promoter leakiness without the confounding variable of target protein toxicity. Materials: Reporter plasmid (e.g., pUA66-derived with promoter driving gfpmut2), appropriate E. coli strain, LB medium, microplate reader. Procedure:
- Transform reporter plasmid into test strain. Include a non-fluorescent control.
- Inoculate triplicate cultures in 96-well plates with 200 µL LB + antibiotic.
- Grow at 37°C with shaking in a plate reader, monitoring OD600 and fluorescence (ex: 485 nm, em: 520 nm) every 15-30 min.
- Calculate Specific Fluorescence = Fluorescence/OD600 at mid-log phase (OD600 ~0.5).
- Leakiness Ratio = (Specific Fluorescence in non-induced / Specific Fluorescence in fully induced) x 100%.
Protocol 3.2: Growth Inhibition Assay for Toxic Protein Leakiness
Objective: Directly quantify the fitness cost of basal expression of a toxic protein. Materials: Expression plasmid with toxic gene, tightly controlled positive control plasmid (e.g., pBAD), isogenic host, LB medium. Procedure:
- Co-transform the toxic plasmid and a compatible, constitutively expressed fluorescent plasmid (e.g., RFP) for normalization.
- Inoculate cultures in triplicate in non-inducing medium. For ara systems, use 0.2% glucose for full repression.
- Perform serial dilutions in 96-well plates, monitoring OD600 and RFP fluorescence for 12-16 hours.
- Calculate Growth Rate Inhibition = µ(empty vector) - µ(test plasmid) / µ_(empty vector).
- Plot growth curves; a decreased growth rate in non-induced conditions indicates functional leakiness.
Protocol 3.3: Plasmid Stability Test Under Selective Pressure
Objective: Determine the rate of plasmid loss due to selective pressure from leaky toxic expression. Materials: Expression plasmid, appropriate antibiotic, non-selective LB plates, selective LB plates. Procedure:
- Inoculate a single colony into non-selective medium and grow overnight.
- Dilute culture 1:10^6 in fresh non-selective medium and grow for ~20 generations.
- Plate dilutions on both non-selective and antibiotic-containing selective plates.
- Incubate overnight and count colonies.
- Plasmid Retention % = (CFU on selective / CFU on non-selective) x 100% after 20 generations. Values <100% indicate selection against plasmid-bearing cells.
Strategies for Achieving Tight Regulation: System Selection and Engineering
Table 3: Tightly Regulated Systems and Their Optimization for Toxic Protein Expression
| System | Key Tightening Strategy | Mechanism of Improved Control | Recommended Host Strain |
|---|---|---|---|
| pBAD/araBAD | Use araC pBAD plasmid, add 0.1% glucose | Catabolite repression + AraC looping | Top10, JWK (ΔaraBAD) |
| T7-Based | Use E. coli strains with pLysS/pLysE (express T7 lysozyme) | Lysozyme inhibits basal T7 RNAP activity | BL21(DE3)pLysS, C41(DE3)pLysE |
| T7-Based | Employ "auto-induction" media with glucose repression | Glucose represses lac operon until depletion | BL21(DE3) Star (Δrne) |
| rhaBAD | Use rhaR mutant host, titrate L-rhamnose | RhaR mutant eliminates rhamnose-independent activation | LMG194 (ΔrhaR) |
| Tet-Based | Use tetR tetO system with high-copy repressor plasmid | High TetR titrates out basal leak | Any; co-transform pRARE (with tetR) |
Visualization of Pathways and Workflows
Title: Pathway from Leaky Expression to Production Failure
Title: Workflow for Expressing Toxic Proteins
Title: Mechanisms of T7/lac System Control and Tightening
The Scientist's Toolkit: Research Reagent Solutions
Table 4: Essential Materials for Studying Leaky Expression and Toxicity
| Item | Function/Benefit | Example Product/Supplier |
|---|---|---|
| Tightly Regulated Cloning Vectors | Minimize basal expression; essential for toxic genes. | pBAD series (Thermo), pETite (Lucigen), pRham (Lucigen). |
| Specialized E. coli Host Strains | Provide repressors, proteases, or T7 RNAP control. | BL21(DE3)pLysS (NEB), C43(DE3) (Sigma), JWK strains (ΔaraBAD) (CGSC). |
| Tunable Inducers | Allow fine-grained control of expression levels. | Anhydrotetracycline (aTc, Takara), L-Rhamnose (Sigma), D-Fucose (anti-inducer for ara). |
| Fluorescent Reporter Plasmids | Quantify promoter activity without toxicity confounders. | pUA66 (GFP promoter probe, Addgene), pSC101-BAD-mCherry (low copy). |
| Autoinduction Media | Repress expression until log phase; simplifies production. | Overnight Express (Novagen), ZYM-5052 (commercial mixes). |
| Plasmid Stabilizing Reagents | Maintain plasmid copy number under non-selective growth. | CopyControl (Lucigen) for inducible copy number. |
| Cell Viability/Stress Kits | Quantify growth inhibition and stress responses. | BacTiter-Glo (Promega, ATP assay), RealTime-Glo MT Cell Viability (Promega). |
| Protease Inhibitor Cocktails | Mitigate toxicity from leaky proteases. | cOmplete EDTA-free (Roche), P8849 (Sigma). |
| Membrane Stress Reporter Strains | Report on envelope stress from leaky membrane proteins. | E. coli FP9 (σE-GFP reporter, available from labs). |
Within the context of a broader thesis on factors affecting protein expression in E. coli, the fine-tuning of induction parameters is a critical determinant of success. The choice of expression system—be it T7, lac, ara, or others—sets the stage, but the yield, solubility, and bioactivity of the target protein are ultimately dictated by the precise orchestration of three interdependent physical parameters: Post-Induction Temperature, Aeration, and Induction Point (OD600). Optimizing these factors mitigates common pitfalls such as inclusion body formation, metabolic burden, and proteolytic degradation, directly impacting downstream applications in structural biology and therapeutic development.
Quantitative Parameter Analysis: Effects and Optimal Ranges
The following tables summarize key quantitative data from recent research on optimizing these parameters for soluble protein yield in E. coli.
Table 1: Post-Induction Temperature Optimization for Soluble Expression
| Temperature (°C) | Effect on Solubility | Effect on Yield | Typical Use Case | Key Considerations |
|---|---|---|---|---|
| 37 | Often maximizes total protein expression. | High total yield, but often insoluble. | Robust expression of highly soluble proteins. | High risk of inclusion bodies; increased protease activity. |
| 30 | Balances yield and solubility. | Moderate to high yield, improved solubility. | Standard first-pass optimization. | Slower growth and protein folding rates. |
| 20 - 25 | Strongly favors proper folding and solubility. | Lower total yield, but highest soluble fraction. | Expression of difficult-to-fold or aggregation-prone proteins. | Very slow growth; extended induction times (12-24 hrs). |
| 15 - 18 | Maximizes folding fidelity, minimizes proteolysis. | Low yield, but often essential for functional activity. | Membrane proteins or complexes requiring high fidelity. | Requires very long induction periods (>24 hrs). |
Table 2: Aeration & Agitation Impact on Expression
| Parameter | Low / Inadequate Level | Optimal / High Level | Physiological Impact |
|---|---|---|---|
| Agitation (RPM) | <200 in baffled flasks | 200-250 (flasks), varies with bioreactor | Ensures homogeneous distribution of cells, nutrients, and inducers. Prevents oxygen gradients. |
| Culture Volume:Flask Ratio | >1:5 | 1:10 to 1:5 | Maximizes surface area for gas exchange. Critical for maintaining dissolved oxygen (DO). |
| Dissolved Oxygen (DO) | <20% saturation | Maintained at >30-40% saturation | Oxygen limitation shifts metabolism to anaerobic pathways, causing acid production and reduced growth/yield. |
Table 3: Induction Point (OD600) Optimization
| Induction OD600 | Metabolic State | Advantages | Disadvantages |
|---|---|---|---|
| Low (0.4 - 0.6) | Mid-exponential phase. | Low cell density, minimal nutrient depletion. Low metabolic burden post-induction. | Low final biomass; sensitive to variations. |
| Standard (0.6 - 1.0) | Mid-to-late exponential phase. | Robust, reproducible cell density. Common starting point for many protocols. | Potential for early acetate production in rich media. |
| High (1.5 - 3.0) | Late exponential / early stationary. | High biomass pre-induction. Can improve yield for some proteins. | Nutrient depletion possible; higher risk of acetate/acid stress affecting folding. |
| Autoinduction | Self-triggering at high density. | Hands-off; yields high biomass and often high soluble protein. | Less control over exact induction timing; medium is specific. |
Detailed Experimental Protocols
Protocol 1: Systematic Screen of Post-Induction Temperature and Induction Point
Objective: To identify the optimal combination of induction OD600 and post-induction temperature for maximizing soluble yield of a recombinant protein.
- Day 1: Transform the expression plasmid into an appropriate E. coli strain (e.g., BL21(DE3)). Plate on selective agar. Incubate overnight at 37°C.
- Day 2: Inoculate 5 mL of sterile autoinduction or defined medium (e.g., TB or M9 with appropriate antibiotics) with a single colony. Grow overnight at 37°C, 220 RPM.
- Day 3:
- Dilute the overnight culture 1:100 into fresh, pre-warmed medium in separate flasks (use a 1:10 flask-to-volume ratio). Grow at 37°C, 220 RPM.
- Monitor OD600 closely.
- For Induction Point Screen: Induce separate culture flasks at OD600 = 0.5, 0.8, 1.2, and 2.0 by adding IPTG (typically to 0.1-1.0 mM final) or arabinose (0.01-0.2% w/v final).
- For Temperature Screen: Immediately after induction, split each induced culture into four separate, pre-warmed flasks. Transfer these to shaking incubators set at 37°C, 30°C, 25°C, and 18°C.
- Continue incubation with shaking (ensure adequate aeration, reduce RPM for lower temps if needed) for a defined period (e.g., 3-4 hrs for 37°C, 6 hrs for 30°C, 16-24 hrs for lower temperatures).
- Harvest: Pellet cells by centrifugation (4,000 x g, 20 min, 4°C). Store pellets at -80°C or process immediately.
- Analysis: Lyse cells via sonication or enzymatic methods. Separate soluble and insoluble fractions by centrifugation (16,000 x g, 30 min, 4°C). Analyze total, soluble, and insoluble fractions by SDS-PAGE and quantify via densitometry or Bradford assay.
Protocol 2: Monitoring the Impact of Aeration
Objective: To assess the effect of dissolved oxygen tension on protein expression and cell physiology.
- Setup: Use identical baffled flasks with varying culture volume-to-flask ratios: 1:3 (high density/poor aeration), 1:5 (moderate), and 1:10 (optimal aeration). Alternatively, use a benchtop bioreactor with a controlled DO probe.
- Growth: Inoculate pre-warmed medium in each flask from the same seed culture. Grow at 37°C, 220 RPM. Monitor OD600 and pH (if possible) over time.
- Induction: Induce all cultures at the same target OD600 (e.g., 0.8).
- Post-Induction: Continue incubation. In the bioreactor, maintain DO >30% via cascade control (increasing agitation, then enriching air with O2). In flasks, aeration is fixed by the volume ratio.
- Analysis: Harvest cultures. Compare:
- Final cell density (OD600).
- Acetate concentration in supernatant (commercial kit).
- Target protein yield and solubility (as in Protocol 1).
- Cell viability (via plating).
Visualizations: Pathways and Workflows
Title: Interplay of Key Expression Parameters
Title: Core Optimization Experimental Workflow
The Scientist's Toolkit: Essential Research Reagents & Materials
Table 4: Key Reagent Solutions for Expression Optimization
| Item | Function & Rationale | Example/Notes |
|---|---|---|
| Autoinduction Media | Allows growth to high density before carbon catabolite repression is lifted, auto-inducing expression. Minimizes hands-on timing. | Commercial formulations (e.g., Overnight Express) or lab-made ZYP-5052. Ideal for high-throughput screening. |
| Terrific Broth (TB) | Rich, highly buffered medium supporting very high cell densities. Maximizes biomass and potential protein yield. | Contains phosphate buffer, which helps resist pH drops from acetate production. |
| Defined Minimal Media (M9) | Chemically defined medium. Essential for isotope labeling (NMR) and metabolic studies. Reduces background for downstream purification. | Glucose or glycerol as carbon source. Must be supplemented with MgSO4, CaCl2, and thiamine. |
| IPTG (Isopropyl β-D-1-thiogalactopyranoside) | Non-hydrolyzable inducer for lac and T7 lac systems. Strong, dose-dependent induction. | Typically used at 0.1-1.0 mM final concentration. Sterilize by filtration. |
| L-(+)-Arabinose | Inducer for the pBAD and related systems. Allows tighter, graded regulation of expression. | Used at lower concentrations (0.01% - 0.2% w/v). Tighter control can reduce metabolic burden. |
| Protease Inhibitor Cocktails | Prevents degradation of the target protein by endogenous proteases during cell lysis and purification. | EDTA-free cocktails are essential if the target protein requires divalent cations. Use immediately upon lysis. |
| Lysozyme & Benzonase | Enzymatic lysis agents. Lysozyme digests the peptidoglycan layer. Benzonase degrades DNA/RNA, reducing viscosity. | Gentle alternative to sonication. Benzonase significantly clarifies lysates, improving column flow. |
| Solubility & Folding Enhancers | Additives co-expressed or added to lysis buffer to improve solubility of difficult proteins. | Co-expression: Molecular chaperones (GroEL/ES, DnaK/J). Buffer Additives: Arginine, glycerol, non-detergent sulfobetaines. |
Within the systematic investigation of factors influencing recombinant protein production in E. coli, the bottleneck of protein folding and solubility is paramount. High-level expression often leads to misfolding, aggregation, and inclusion body formation, resulting in loss of functional protein. This technical guide details targeted co-expression strategies that address these post-translational challenges, thereby serving as critical experimental variables in optimizing yield and biological activity.
Core Co-expression Strategies: Mechanisms and Applications
Molecular Chaperones: Preventing Aggregation and Facilitating Folding
Molecular chaperones are proteins that stabilize unfolded or partially folded polypeptides, preventing inappropriate interactions. They do not convey steric information but provide a controlled environment for correct folding.
Key Systems:
- GroEL/GroES (Hsp60/Hsp10): A barrel-shaped complex that encapsulates non-native proteins in an Anfinsen cage, allowing folding in isolation.
- DnaK/DnaJ/GrpE (Hsp70 System): DnaK binds hydrophobic stretches of nascent chains; DnaJ targets substrates to DnaK and stimulates ATP hydrolysis; GrpE acts as a nucleotide exchange factor to release the folded protein.
- Trigger Factor (TF): A ribosome-associated chaperone that interacts with nascent chains as they emerge from the ribosomal tunnel.
Foldases: Catalyzing Specific Folding Steps
Foldases are enzymes that catalyze specific covalent steps in the folding pathway.
Key Enzymes:
- Protein Disulfide Isomerase (Dsb family): Catalyzes the formation, breakage, and isomerization of disulfide bonds in the periplasm. DsbA introduces bonds, DsbC isomerizes incorrect bonds.
- Peptidyl-Prolyl cis-trans Isomerases (PPIases): Accelerate the slow isomerization of peptide bonds preceding proline residues (e.g., FkpA, SurA).
tRNA Supplements: Overcoming Codon Usage Bias
Heterologous genes, especially those from eukaryotic sources, often contain codons that are rare in E. coli, causing ribosomal stalling, translation errors, and truncation. Co-expression of plasmids encoding cognate tRNAs for these rare codons (e.g., AGA, AGG, AUA, CUA, GGA) alleviates this bottleneck.
Data Presentation: Quantitative Efficacy of Co-expression Strategies
Table 1: Comparative Efficacy of Common Co-expression Strategies on Model Proteins
| Co-expressed Factor | Target Protein Class | Reported Increase in Soluble Fraction (%) | Reported Impact on Functional Yield (Fold) | Key Reference (Example) |
|---|---|---|---|---|
| GroEL/GroES | Multidomain cytosolic enzymes | 40-70% | 3-8x | de Marco et al., 2019 |
| DnaK/DnaJ/GrpE | Unstructured/aggregation-prone | 30-60% | 2-5x | Rosano & Ceccarelli, 2014 |
| Trigger Factor + DnaKJE | Rapidly translating cytosolic | 50-80% | 4-10x | Liu & Wang, 2021 |
| DsbC (in trxB- gor- strain) | Multi-disulfide bond proteins | 60-90% | 10-50x | Lobstein et al., 2012 |
| FkpA | Proline-rich/ single-chain Fv | 20-50% | 5-20x | Zhang et al., 2020 |
| Rare tRNA (AGG/AGA) | Humanized antibodies/genes | N/A (translational) | 5-100x (total yield) | Wan et al., 2023 |
Table 2: Common Commercial E. coli Strains for Co-expression
| Strain Name | Key Features (Chaperone/Foldase/tRNA) | Optimal Application |
|---|---|---|
| Origami 2 | trxB gor mutations enhance disulfide bond formation in cytoplasm. | Cytoplasmic expression of disulfide-bonded proteins. |
| Rosetta | Supplies tRNAs for AUA, AGG, AGA, CUA, GGA, CCC codons. | Eukaryotic genes with severe codon bias. |
| BL21(DE3)pLysS | Not a co-expression strain per se, but controls basal T7 expression, reducing toxicity pre-induction. | Standard baseline for toxic proteins. |
| ArcticExpress | Co-expresses chaperonin Cpn60/Cpn10 from O. antarctica (active at 4-12°C). | Proteins requiring low-temperature folding. |
| SHuffle | Constitutively expresses DsbC in cytoplasm (trxB gor background). | Cytoplasmic expression of proteins requiring disulfide isomerization. |
Experimental Protocols
Standard Protocol for Co-expression of Molecular Chaperones
Methodology:
- Plasmid Selection: Choose a compatible plasmid system (different origins of replication and antibiotic resistance) for the target protein and chaperone plasmids (e.g., pET vector for target [ColE1, Amp^R^], pGro7 for GroEL/ES [pACYC, Cm^R^] or pKJE7 for DnaK/J/GrpE [pACYC, Cm^R^]).
- Co-transformation: Co-transform chemically competent E. coli BL21(DE3) with both plasmids. Select on LB-agar plates containing both antibiotics (e.g., 100 µg/mL ampicillin + 34 µg/mL chloramphenicol).
- Pre-culture & Main Culture: Inoculate a single colony into dual-antibiotic LB medium and grow overnight. Dilute into fresh medium with antibiotics.
- Chaperone Induction: At an OD~600nm~ of ~0.5-0.6, add L-arabinose (pGro7: 0.5 mg/mL) or tetracycline (pKJE7: 5 ng/mL) to induce chaperone expression. Grow for 1 hour at 30°C.
- Target Protein Induction: Add IPTG (typically 0.1-1.0 mM) to induce target protein expression. Optimize temperature (often 20-25°C) and duration (4-16 hours).
- Analysis: Harvest cells, lyse, and fractionate via centrifugation. Analyze soluble (supernatant) and insoluble (pellet) fractions by SDS-PAGE. Assess activity via functional assays.
Protocol for Enhancing Disulfide Bond Formation
Methodology (using SHuffle strain):
- Strain Selection: Use SHuffle T7 Express or similar strain (constitutive dsbC, trxB, gor mutations).
- Transformation & Growth: Transform with target plasmid. Grow overnight in LB with antibiotic at 30°C (temperature-sensitive trxB/gor suppression).
- Expression: Dilute culture and grow at 30°C to mid-log phase. Induce with IPTG. For robust folding, lower temperature to 16-25°C post-induction for 16-20 hours.
- Analysis: Analyze solubility via SDS-PAGE under non-reducing and reducing conditions to confirm disulfide-linked oligomerization.
Protocol for Codon Optimization via tRNA Supplementation
Methodology:
- Strain Selection: Use a strain like Rosetta 2 (DE3) which carries the pRARE2 plasmid (Cm^R^) supplying 7 rare codon tRNAs.
- Antibiotic Regime: Maintain selection for both the target plasmid (e.g., Amp) and the pRARE2 plasmid (Cm) at all stages.
- Expression: Follow standard protocols for the target protein. The supplementation is constitutive.
- Troubleshooting: If protein yield remains low, sequence verify the gene to identify clusters of rare codons and consider alternative tRNA plasmids or gene synthesis for full codon optimization.
Visualization of Pathways and Workflows
Diagram 1: Chaperone networks for protein folding in E. coli cytosol.
Diagram 2: Workflow for protein co-expression experiments in E. coli.
The Scientist's Toolkit: Essential Research Reagents
Table 3: Key Reagent Solutions for Implementing Co-expression
| Reagent / Material | Function & Application | Example Product/Catalog # |
|---|---|---|
| Chaperone Plasmid Set | Vectors for inducible co-expression of GroEL/ES, DnaK/J/GrpE, TF, etc. | Takara Bio "Chaperone Plasmid Set" (pGro7, pKJE7, pG-Tf2) |
| Disulfide Bond Enhancing Strains | Genetically engineered strains for cytoplasmic (SHuffle) or periplasmic (Origami) disulfide formation. | NEB SHuffle T7 Express, Merck Millipore Origami 2 |
| Rare tRNA Supplementation Strains | Strains carrying plasmids encoding tRNAs for codons rare in E. coli. | Novagen Rosetta 2 (DE3), Lucigen Rosetta-gami B |
| Arabinose (for pGro vectors) | Inducer for the araB promoter driving chaperone expression. | MilliporeSigma L-Arabinose, >99% |
| Tetracycline (for pKJE vectors) | Low-concentration inducer for the tet promoter driving DnaK/J/GrpE. | MilliporeSigma Tetracycline Hydrochloride |
| IPTG | Standard inducer for T7/lac-based target protein expression vectors. | Gold Biotechnology IPTG, molecular biology grade |
| Compatible Antibiotics | For maintaining selection of multiple plasmids (e.g., Ampicillin, Chloramphenicol, Kanamycin). | Various suppliers, molecular biology grade |
| Lysis Reagents | For cell disruption and preparation of soluble/insoluble fractions (lysozyme, detergents, sonication). | MilliporeSigma Lysozyme, Roche cOmplete Protease Inhibitor |
| Non-reducing SDS-PAGE Buffer | To analyze disulfide bond formation without breaking -S-S- bonds. | Thermo Fisher Scientific NuPAGE Sample Buffer (non-reducing) |
Beyond the Gel: Validation, Alternative Hosts, and Future Perspectives
In the pursuit of recombinant protein production using E. coli, researchers must navigate numerous factors affecting expression—from plasmid design and codon optimization to induction conditions and host strain selection. However, successful expression is merely the first step. Rigorous analytical characterization is mandatory to confirm that the purified protein is not only abundant but also correct, pure, and functionally active. This technical guide details the three cornerstone methodologies for this critical verification phase: Mass Spectrometry (for identity and purity), Immunoassays (for specific detection and quantification), and Functional Bioassays (for biological activity). Together, these techniques form an essential framework for validating any protein produced in E. coli expression systems.
Mass Spectrometry: Defining Molecular Identity and Purity
Mass spectrometry (MS) provides unparalleled accuracy in determining the molecular weight and primary structure of a protein, directly confirming its identity and revealing common post-expression modifications.
Key Experimental Protocol: Intact Mass Analysis and Peptide Mapping
- Sample Preparation: Desalt and buffer-exchange purified protein into volatile buffers (e.g., 0.1% formic acid) using spin columns or online desalting.
- Intact Protein Analysis: Inject sample into an LC-MS system coupled to a high-resolution mass analyzer (e.g., Q-TOF, Orbitrap). Deconvolution software converts the multiple-charge ion series to a zero-charge mass spectrum.
- Peptide Mapping (Bottom-Up Proteomics): Denature protein, reduce disulfide bonds (DTT), alkylate cysteines (iodoacetamide), and digest with a protease (e.g., trypsin). Analyze the peptide mixture via LC-MS/MS. Database searching (e.g., against the expected sequence) identifies peptides and any modifications.
- Data Interpretation: Compare observed mass (intact or peptides) with theoretical mass. Mass shifts indicate potential modifications (e.g., N-terminal Met retention, deamidation, oxidation).
Quantitative Data Summary: MS Performance Metrics
| Metric | Typical Performance Range | Primary Information Gained |
|---|---|---|
| Mass Accuracy | 1 - 50 ppm (high-res MS) | Confirms correct amino acid sequence. |
| Sequence Coverage | 70 - 100% (peptide mapping) | Extent of protein sequence verified. |
| Detection Sensitivity | Low-femtomole to picomole | Purity assessment and impurity detection. |
| Mass Range | Up to >200 kDa (intact analysis) | Direct analysis of full-length product. |
Title: Mass Spectrometry Analysis Workflow for Protein Identity
Immunoassays: Sensitive Detection and Quantification
Immunoassays leverage antibody-antigen specificity to detect, quantify, and assess the structural integrity of the target protein amidst complex mixtures.
Key Experimental Protocol: Quantitative ELISA
- Coating: Immobilize a capture antibody specific to the target protein onto a microplate wells. Block with protein-based buffer (e.g., BSA).
- Sample & Standard Addition: Add purified protein samples (and a dilution series of a known standard for a calibration curve) to wells.
- Detection: Add a biotinylated or enzyme-conjugated detection antibody (recognizing a different epitope) followed by Streptavidin-HRP or a secondary antibody-HRP conjugate.
- Signal Development & Readout: Add chromogenic substrate (e.g., TMB). Stop reaction and measure absorbance. Determine sample concentration from the standard curve.
Quantitative Data Summary: Common Immunoassay Formats
| Assay Type | Detection Limit | Key Application | Throughput |
|---|---|---|---|
| Direct ELISA | ~1-10 ng/mL | High-affinity capture, simple setup. | High |
| Sandwich ELISA | ~0.1-1 pg/mL | High specificity and sensitivity for complex samples. | High |
| Western Blot | ~0.1-1 ng | Confirms molecular weight and detects specific isoforms/cleavage. | Low |
| Dot Blot | ~1-10 ng | Rapid presence/absence check, no size separation. | Medium |
Title: Key Steps in a Sandwich ELISA Workflow
Functional Bioassays: Measuring Biological Activity
A bioassay measures a protein's ability to elicit a specific biological response in a cellular or biochemical system, confirming proper folding and functional integrity.
Key Experimental Protocol: Cell-Based Reporter Gene Assay for a Cytokine
- Cell Line Preparation: Culture reporter cells (e.g., HEK-293 or specialized lymphocyte lines) engineered to produce a measurable signal (e.g., luciferase, SEAP) upon activation by the target cytokine pathway.
- Sample Stimulation: Treat cells with serial dilutions of the purified E. coli-derived protein and a reference standard.
- Signal Measurement: After incubation (e.g., 6-24h), lyse cells and add luciferase substrate. Measure luminescence.
- Data Analysis: Plot dose-response curves. Calculate the relative potency (EC50) of the test sample compared to the reference standard.
Quantitative Data Summary: Bioassay Performance Indicators
| Indicator | Description | Acceptance Criteria Example |
|---|---|---|
| Relative Potency | EC50(sample) / EC50(reference) | 80-125% of reference standard. |
| Dose-Response Curve | Sigmoidal log[concentration] vs. response | R² > 0.95, appropriate upper/lower asymptotes. |
| Specificity | Signal blocked by neutralizing antibody | >70% inhibition of response. |
| Precision (Repeatability) | %CV of replicate measurements | <20% CV. |
Title: Cell-Based Reporter Gene Assay Signaling Pathway
The Scientist's Toolkit: Research Reagent Solutions
| Reagent / Material | Function in Characterization |
|---|---|
| High-Resolution Mass Spectrometer | Provides accurate mass measurement for intact proteins and peptides for identity confirmation. |
| Trypsin (Protease) | Enzymatically cleaves proteins at specific sites for peptide mapping and sequence analysis. |
| ELISA Kit (Matched Antibody Pair) | Provides pre-optimized, specific antibodies for sensitive and quantitative detection of target protein. |
| Chromogenic Substrate (e.g., TMB) | Generates a colorimetric change upon reaction with HRP enzyme for ELISA signal detection. |
| Reporter Cell Line | Engineered cells containing a response element linked to a measurable gene (luciferase, SEAP) for bioactivity. |
| Reference Standard | Fully characterized, biologically active protein used as a benchmark in immunoassays and bioassays. |
| Neutralizing Antibody | Specific antibody that blocks protein-receptor interaction, used to confirm assay specificity. |
Within the broader investigation of Factors affecting protein expression in E. coli, successful purification is only a preliminary step. A primary challenge is determining whether the expressed protein is not merely soluble, but also correctly folded into its native, functional conformation. E. coli expression systems, while powerful, often lack the complex chaperone machinery and post-translational modifications of eukaryotic cells, leading to misfolding, aggregation, or inclusion body formation even under "soluble" conditions. This guide details three orthogonal and complementary techniques—Circular Dichroism (CD), Thermal Shift Assay (TSA), and functional Activity Tests—to rigorously assess protein folding. These methods serve as critical quality control checkpoints, directly linking expression condition variables (e.g., strain, temperature, induction protocol, codon usage, fusion tags) to the structural and functional integrity of the target protein.
Core Techniques for Folding Assessment
Circular Dichroism (CD) Spectroscopy
CD measures the differential absorption of left- and right-handed circularly polarized light by chiral molecules. For proteins, the far-UV spectrum (190-250 nm) reports on secondary structure (α-helices, β-sheets, random coil), while the near-UV spectrum (250-350 nm) provides insights into tertiary structure via aromatic amino acid environments.
Quantitative Data Summary: Table 1: Characteristic CD Spectral Signatures for Protein Secondary Structures
| Secondary Structure | Peak Position (nm) | Trough Position (nm) | Characteristic Spectral Shape |
|---|---|---|---|
| α-Helix | ~190, ~208 | ~222 | Double negative minima at 222 & 208 nm, strong positive peak at ~190 nm. |
| β-Sheet | ~195 | ~215-218 | Single broad negative minimum at ~215-218 nm, positive peak at ~195 nm. |
| Random Coil | ~198 | ~200-220 (weak) | Strong negative peak near 198 nm, weak ellipticity above 210 nm. |
Detailed Protocol:
- Sample Preparation: Dialyze purified protein into a CD-compatible buffer (e.g., 5-10 mM phosphate, pH 7.0-8.0). Avoid high salt (>150 mM), chloride ions, or absorbing additives. Determine exact concentration (A280).
- Instrument Setup: Use a quartz cuvette with a short pathlength (0.1 mm or 0.01 cm for far-UV). Set nitrogen purge. Temperature control (e.g., 20°C) is standard.
- Measurement: For far-UV, scan from 260 nm to 190 nm (or instrument low-wavelength limit). Use appropriate protein concentration (typically 0.1-0.2 mg/mL for a 0.1 cm pathlength). Perform multiple scans and average.
- Data Analysis: Subtract buffer baseline. Smooth data if necessary. Express results as mean residue ellipticity (degrees cm² dmol⁻¹). Use deconvolution algorithms (e.g., SELCON3, CDSSTR) to estimate secondary structure percentages.
Thermal Shift Assay (TSA)
TSA (or differential scanning fluorimetry) monitors protein thermal unfolding as a function of temperature. A fluorescent dye (e.g., SYPRO Orange) binds to exposed hydrophobic patches of the unfolding protein, causing a fluorescence increase. The midpoint of this transition is the melting temperature (Tm), indicative of thermodynamic stability.
Quantitative Data Summary: Table 2: Interpreting Thermal Shift Assay Results
| ΔTm | Interpretation in Expression/Folding Context |
|---|---|
| > +2°C | Indicates increased stability. May result from successful point mutation, binding of a correct ligand/substrate, or optimization of expression buffer/pH. |
| ± 1-2°C | No significant change in stability. |
| < -2°C | Indicates decreased stability. Suggests misfolding, destabilizing mutation, improper cofactor incorporation, or sub-optimal buffer conditions from purification. |
Detailed Protocol:
- Reaction Setup: In a 96- or 384-well PCR plate, mix protein (0.1-1 mg/mL, 10-20 µL final volume) with SYPRO Orange dye (5X final concentration) in assay buffer.
- Instrument Setup: Load plate into a real-time PCR instrument. Set fluorescence detection channel appropriate for SYPRO Orange (e.g., ROX/FAM).
- Thermal Ramp: Program a gradient from 20°C to 95°C with a slow ramp rate (e.g., 1°C/min) and continuous fluorescence reading.
- Data Analysis: Plot fluorescence vs. temperature. Fit data to a Boltzmann sigmoidal curve. The Tm is the inflection point of the curve. Compare Tm values across different expression/purification conditions.
Functional Activity Tests
These assays measure the protein's biological or biochemical activity, providing the most direct evidence of correct folding. The assay is unique to the protein's function (e.g., enzymatic turnover, ligand binding, cellular response).
Quantitative Metrics: Table 3: Common Activity Assay Parameters
| Parameter | Definition | Folding Relevance |
|---|---|---|
| Specific Activity | Activity units per mg of protein. | Low specific activity suggests a large fraction of purified protein is misfolded or inactive. |
| Km (Michaelis Constant) | Substrate concentration at half Vmax. | Anomalous Km may indicate altered active site geometry or misfolding affecting substrate access. |
| IC50/EC50 | Ligand concentration for half-maximal inhibition/effect. | Correct values confirm proper folding of binding pockets. |
| Turnover Number (kcat) | Max catalytic events per active site per second. | Direct measure of the efficiency of the correctly folded enzyme. |
Detailed Protocol (Example: Enzymatic Assay):
- Assay Development: Identify a spectrophotometric or fluorometric readout linked to substrate conversion (e.g., NADH oxidation at 340 nm).
- Kinetic Measurement: In a plate reader or spectrophotometer, mix purified enzyme with substrate in reaction buffer at defined temperature.
- Initial Rate Calculation: Monitor product formation linearly over time. Vary substrate concentration to determine Michaelis-Menten kinetics (Km, Vmax).
- Normalization: Divide the obtained activity by the total protein concentration to determine specific activity. Compare to literature values for the wild-type protein.
Visualizing the Assessment Workflow
Title: Integrated Workflow for Protein Folding Assessment
The Scientist's Toolkit: Essential Reagent Solutions
Table 4: Key Research Reagents for Folding Assessment
| Reagent/Material | Function/Application |
|---|---|
| CD-Compatible Buffers (e.g., phosphate, borate, low-fluoride Tris) | Provide necessary ionic environment without absorbing in the far-UV, allowing accurate secondary structure measurement. |
| SYPRO Orange Dye | Environment-sensitive fluorescent dye used in TSA to bind hydrophobic regions exposed during protein thermal unfolding. |
| Microplate Sealers (Optically Clear) | Prevent evaporation during TSA runs in real-time PCR instruments, ensuring consistent thermal and signal stability. |
| Activity Assay Substrate/Co-factor | High-purity compound specific to the protein's function (e.g., ATP for kinases, NADH for dehydrogenases) to measure correct active site folding. |
| Standard/Control Protein | A known, correctly folded protein standard for CD or activity assay calibration and validation of experimental conditions. |
| Size-Exclusion Chromatography (SEC) Column | Used post-assessment to separate monomeric, folded protein from aggregates, confirming biophysical and activity data. |
Within the broader thesis on factors affecting protein expression in E. coli—including inclusion body formation, codon bias, lack of post-translational modifications (PTMs), and endotoxin contamination—this guide examines alternative platforms for recombinant protein production. When E. coli fails to yield functional, soluble, or properly modified protein, three primary systems are employed: the yeast Pichia pastoris (Komagataella spp.), the insect cell/baculovirus expression vector system (BEVS), and mammalian cell cultures.
Pichia pastoris: A Robust Microbial Eukaryote
Overview: Pichia combines the ease of microbial fermentation with eukaryotic protein processing capabilities, such as disulfide bond formation, glycosylation (high-mannose type), and secretion.
Key Advantages & Limitations:
- Advantages: High-density growth, strong inducible promoters (e.g., AOX1), low-cost media, efficient secretion into minimal-media supernatant.
- Limitations: Hypermannosylation can affect protein activity and immunogenicity; glycan patterns differ from humans.
Experimental Protocol: Heterologous Protein Secretion in Pichia
- Vector Construction: Clone gene of interest into a secretion vector (e.g., pPICZα) containing the S. cerevisiae α-factor secretion signal and under control of the AOX1 promoter.
- Integration: Linearize plasmid and transform into competent Pichia cells (e.g., GS115 strain) via electroporation. Select on zeocin plates.
- Screening: Screen multiple Mut+ or MutS clones for protein expression in small-scale (5-10 mL) cultures in BMGY medium.
- Induction: Centrifuge cells from grown culture, resuspend in induction medium (BMMY containing 0.5-1% methanol) to induce the AOX1 promoter.
- Maintenance & Harvest: Add methanol every 24 hours to maintain induction. Culture for 3-5 days. Centrifuge to separate cells from secreted protein in supernatant.
- Analysis: Concentrate supernatant and analyze protein yield and activity via SDS-PAGE, Western blot, and functional assays.
Baculovirus Expression Vector System (BEVS): Insect Cell Factory
Overview: BEVS uses recombinant baculovirus (typically Autographa californica multiple nucleopolyhedrovirus, AcMNPV) to infect insect cell lines (e.g., Sf9, Hi5), enabling high-level cytoplasmic or secretory expression of complex eukaryotic proteins.
Key Advantages & Limitations:
- Advantages: Capacity for large gene inserts, authentic folding, complex multimeric assembly, and human-like PTMs (though glycosylation is truncated).
- Limitations: Lytic system; scaling can be costly; viral amplification required; time-consuming initial clone generation.
Experimental Protocol: Recombinant Baculovirus Generation and Protein Expression
- Gene Cloning: Insert gene into a donor plasmid (e.g., pFastBac1) downstream of a strong baculoviral promoter (e.g., polyhedrin, p10).
- Generation of Bacmid: Transform the donor plasmid into E. coli DH10Bac cells containing the bacmid and a helper plasmid. Site-specific transposition occurs. Select white colonies on LB plates with antibiotics and X-gal/IPTG.
- Isolation of Bacmid DNA: Isolate recombinant bacmid DNA from a selected white colony using a standard alkaline lysis miniprep protocol.
- Transfection: Seed adherent Sf9 cells in a 6-well plate. Mix 1 µg bacmid DNA with cellfectin II reagent in unsupplemented medium. Add complex to cells to generate P0 viral stock.
- Virus Amplification: Harvest P0 supernatant at 72-96 hours post-transfection. Infect fresh suspension Sf9 cells at a low multiplicity of infection (MOI ~0.1) to generate amplified P1 stock. Titer via plaque assay or endpoint dilution.
- Protein Expression: Infect log-phase Hi5 or Sf9 cells in suspension at an MOI of 3-5. Harvest cells 48-72 hours post-infection by centrifugation for intracellular protein, or harvest supernatant for secreted proteins.
Mammalian Cells: The Gold Standard for Authenticity
Overview: Systems like HEK293 (human embryonic kidney) and CHO (Chinese hamster ovary) cells provide full human-compatible PTMs, including complex N-linked glycosylation, for the most therapeutically relevant proteins.
Key Advantages & Limitations:
- Advantages: Native folding, assembly, and PTMs; essential for functional studies of human receptors, antibodies, and complex multi-subunit enzymes.
- Limitations: Highest cost, slowest growth, technically demanding, lower yields, potential for viral contamination.
Experimental Protocol: Transient Transfection in HEK293 Cells
- Vector Design: Clone gene into a mammalian expression vector (e.g., pcDNA3.4) containing a strong promoter (CMV), secretion signal if needed, and selectable marker.
- Cell Preparation: Seed HEK293 cells (adherent or suspension-adapted) in an appropriate vessel (e.g., poly-D-lysine coated flask for adherent) to reach 70-90% confluency at time of transfection.
- Complex Formation (PEI Method): For 1 L of suspension culture, mix 1 mg of plasmid DNA with 3 mg of linear 25 kDa polyethylenimine (PEI) in separate aliquots of serum-free medium (e.g., Opti-MEM). Combine, vortex, and incubate at room temperature for 15-20 minutes to form DNA-PEI complexes.
- Transfection: Add the complex dropwise to the cell culture. For adherent cells, change to fresh medium post-addition.
- Enhancement & Production: Add valproic acid (final 3-4 mM) 24 hours post-transfection to enhance protein yield for CMV-driven expression. Maintain culture at 37°C, 5% CO2, with agitation for suspension.
- Harvest: For secreted proteins, centrifuge culture (e.g., 72-96 hours post-transfection) and filter supernatant (0.22 µm). For intracellular proteins, lyse pelleted cells.
Comparative Analysis: Quantitative Data
Table 1: Comparative Overview of Expression Systems
| Parameter | E. coli | Pichia pastoris | Baculovirus/Insect Cells | Mammalian (HEK293/CHO) |
|---|---|---|---|---|
| Typical Yield (mg/L) | 10-5000 | 10-3000 (secreted) | 1-500 | 0.1-100 (transient), 1-5000 (stable) |
| Time to Protein (Days) | 3-7 | 7-14 | 14-28 (incl. virus gen.) | 7-14 (transient), months (stable line) |
| Cost | Very Low | Low | Moderate | High |
| Glycosylation | None | High-mannose (8-14 mannose) | Paucimannose (trimannosyl core) | Complex, human-like |
| Key PTMs | Limited | Disulfide bonds, cleavage | Disulfide bonds, phosphorylation, acetylation | Full spectrum (γ-carboxylation, etc.) |
| Folding Environment | Reducing cytoplasm | Oxidative secretory pathway | Eukaryotic cytoplasm/secretory | Human-compatible |
| Common Use Case | Simple proteins, antigens, non-glycosylated enzymes | Disulfide-rich proteins, industrial enzymes | Complex multi-domain proteins, vaccines, VLPs | Therapeutic glycoproteins, complex membrane proteins |
Table 2: System Selection Guide Based on E. coli Failure Mode
| Failure Mode in E. coli | Recommended System | Rationale |
|---|---|---|
| Inclusion Body Formation | Pichia (secretory), Baculovirus | Oxidative folding environment promotes solubility. |
| Lack of Disulfide Bonds | Pichia (secretory), BEVS, Mammalian | Proper oxidative folding in ER. |
| Improper Folding/Assembly | BEVS, Mammalian | Chaperone machinery supports complex folding. |
| Required Glycosylation | Mammalian (CHO/HEK) | Authentic human N- and O-linked glycosylation. |
| Functional Multi-subunit Complex | BEVS, Mammalian | Co-expression and assembly in eukaryotic environment. |
| Toxin/Labile Protein | Pichia (secretory), BEVS (fast) | Lower temperature, faster than stable mammalian. |
| Membrane Protein (e.g., GPCR) | BEVS, Mammalian | Native lipid bilayer and trafficking. |
Visualization of Workflows
Title: Pichia pastoris Secretory Expression Workflow
Title: Baculovirus (BEVS) Protein Expression Workflow
Title: Mammalian Transient Transfection Workflow
The Scientist's Toolkit: Research Reagent Solutions
| Item | Function & Application |
|---|---|
| pPICZα Vector (Thermo Fisher) | Pichia secretion vector with α-factor signal peptide, AOX1 promoter, and zeocin resistance for selection. |
| pFastBac Vector System (Thermo Fisher) | Donor plasmid for Bac-to-Bac BEVS, facilitating site-specific transposition into the bacmid in E. coli. |
| pcDNA3.4 Vector (Thermo Fisher) | High-efficiency mammalian expression vector with CMV promoter, optimized for protein production in HEK293 and CHO cells. |
| Linear 25 kDa PEI (Polysciences) | Cationic polymer for transient transfection of mammalian cells, forming complexes with DNA for efficient delivery. |
| Sf9 and Hi5 Insect Cell Lines (Thermo Fisher) | Lepidopteran cell lines for baculovirus propagation (Sf9) and high-level recombinant protein expression (Hi5). |
| Expi293/ExpiCHO Systems (Thermo Fisher) | Chemically defined media, cells, and protocols for high-density, high-yield transient protein expression in mammalian systems. |
| Zeocin (InvivoGen) | Selective antibiotic (bleomycin family) effective in bacteria, yeast, and mammalian cells, used for Pichia and dual-selection vectors. |
| Valproic Acid (Sigma-Aldrich) | Histone deacetylase inhibitor that enhances recombinant protein expression from the CMV promoter in mammalian cells. |
| Protease Inhibitor Cocktails (Roche) | Essential additives in lysis buffers for Pichia, insect, and mammalian cell preparations to prevent protein degradation. |
| Endoglycosidase H (NEB) | Enzyme that cleaves high-mannose N-glycans (from Pichia, insect cells); used for deglycosylation analysis. |
| PNGase F (NEB) | Enzyme that cleaves most N-linked glycans (complex, hybrid, high-mannose); used for mammalian protein analysis. |
This whitepaper examines the economic and scalability factors in using Escherichia coli as a host for recombinant protein production. Within the broader thesis on "Factors affecting protein expression in E. coli research," this discussion focuses on how the priorities, constraints, and methodologies shift fundamentally when moving from small-scale research to industrial biomanufacturing. Key factors such as strain selection, culture conditions, vector design, and downstream processing must be re-evaluated through the lenses of cost-per-gram, regulatory compliance, and process robustness.
Comparative Analysis: Research Bench vs. Industrial Bioreactor
The following table summarizes the core differences in objectives, methodologies, and economic drivers.
Table 1: Key Considerations at Different Scales
| Aspect | Research-Scale (1 mL - 10 L) | Large-Scale Production (> 1000 L) |
|---|---|---|
| Primary Goal | Speed, flexibility, proof-of-concept | Cost efficiency, reproducibility, yield |
| Strain Selection | Cloning strains (DH5α); BL21 derivatives for expression | Highly engineered, proprietary production strains (e.g., BL21(DE3) pLysS, W3110) with stable genomic modifications |
| Culture Medium | Rich, defined media (LB, TB, M9+glucose); cost secondary | Optimized, minimal or semi-defined media; raw material cost and sourcing critical |
| Induction System | IPTG common; tunable promoters (e.g., pBAD) | IPTG often avoided due to cost/toxicity; temperature- or pH-shift induction preferred |
| Process Mode | Batch culture in flasks or small bioreactors | Fed-batch is standard; continuous culture emerging |
| Key Economic Metric | Cost per successful expression trial | Cost per gram of purified protein (CoGs) |
| Yield Target | 1-100 mg/L acceptable for characterization | >1 g/L mandatory for commercial viability |
| Downstream Processing | Small-column chromatography, affinity tags (His-tag) | Scalable unit operations (centrifugation, TFF, column chromatography); tag removal may be omitted to reduce steps |
| Regulatory Focus | Institutional biosafety | cGMP compliance, extensive documentation (batch records, QC) |
Scalability Challenges and Technical Solutions
Strain Engineering for Production
Research strains are optimized for transformation efficiency and plasmid stability. Production strains require:
- Genomic stability: Removal of proteases (e.g., lon, ompT), antibiotic markers.
- Metabolic engineering: Enhancing precursor supply (e.g., Ala, Val, Ile, Phe pathways), redox cofactor regeneration.
- Toxicity mitigation: Engineering for inclusion body formation or soluble expression as required.
Protocol 3.1.1: Fed-Batch Process Development in a 5-L Bioreactor
- Inoculum Prep: Streak production strain from cryostock onto selective agar. Inoculate a 250 mL shake flask with 50 mL of seed medium. Incubate at 30°C, 220 rpm for 12-16 h to an OD600 of ~5.
- Bioreactor Setup: A 5-L bioreactor is charged with 2.5 L of defined minimal medium (e.g., Modified M9 with glucose). Parameters are set: temperature = 37°C, pH = 6.9 (controlled with NH4OH/H3PO4), dissolved oxygen (DO) = 30% (cascaded to agitation then O2 enrichment).
- Batch Phase: Inoculate bioreactor to an initial OD600 of 0.1. Allow cells to grow until the initial carbon source is depleted, indicated by a sharp rise in DO (the "carbon spike").
- Fed-Batch Phase: Initiate exponential feeding of a concentrated nutrient feed (e.g., 500 g/L glucose, 10 g/L MgSO4) using a predefined profile to maintain a specific growth rate (µ) of 0.12-0.15 h⁻¹.
- Induction: At a target cell density (OD600 ~120), induce protein expression by shifting temperature to 25°C (for a temperature-sensitive promoter) or adding a chemical inducer.
- Harvest: 4-6 hours post-induction, cool the broth and harvest by continuous centrifugation at 16,000 x g. Cell paste is frozen at -80°C.
Metabolic Burden and Plasmid vs. Genomic Integration
High-copy plasmids, standard in research, impose a significant metabolic burden at scale, reducing yield and stability. Large-scale processes increasingly use genomic integration of the expression cassette.
Table 2: Expression System Economics
| System | Research Advantage | Production Drawback | Typical Yield Range |
|---|---|---|---|
| High-Copy Plasmid (pET) | Rapid testing, high gene dosage | Antibiotic cost, burden, instability | 10-500 mg/L |
| Low-Copy Plasmid | Reduced burden | Lower gene dosage, still requires antibiotic | 50-800 mg/L |
| Genomic Integration (e.g., using λ Red/CRISPR) | Stable, no antibiotics | Complex strain development, lower gene copy | 200-2000 mg/L |
The Scientist's Toolkit: Key Reagent Solutions
Table 3: Essential Materials for E. coli Expression Studies
| Item | Function | Example/Supplier |
|---|---|---|
| BL21(DE3) Competent Cells | Standard expression host with T7 RNA polymerase gene integrated. | NEB BL21(DE3), Thermo Fisher |
| pET Expression Vectors | High-copy plasmids with strong, IPTG-inducible T7/lac promoter. | Novagen (MilliporeSigma) |
| 2xYT or Terrific Broth (TB) | Nutrient-rich media for high-cell-density growth in shake flasks. | Difco, BD Biosciences |
| Isopropyl β-d-1-thiogalactopyranoside (IPTG) | Chemical inducer for lac/T7 promoter systems. | Gold Biotechnology, Thermo Fisher |
| Protease Inhibitor Cocktails | Prevent proteolytic degradation of recombinant proteins during lysis. | e.g., PMSF, Pepstatin A, EDTA |
| Ni-NTA Agarose Resin | Immobilized metal affinity chromatography (IMAC) resin for His-tagged protein purification. | Qiagen, Cytiva |
| Ultrasonic Cell Disruptor | Equipment for lysing E. coli cells to release recombinant protein. | Branson, Qsonica |
| AKTA chromatography system | FPLC system for reproducible, scalable protein purification. | Cytiva |
Visualization of Workflows
Title: E. coli Protein R&D to Production Workflow
Title: Scale-Up Timeline & Cost Trajectory
The pursuit of robust and high-yield protein expression in Escherichia coli remains a cornerstone of biotechnology and therapeutic development. Traditional optimization cycles are laborious, focusing on variables like promoter strength, ribosomal binding sites (RBS), codon usage, induction conditions, and host strain engineering. The broader thesis on factors affecting protein expression in E. coli must now incorporate a new paradigm: the integration of cell-free systems for rapid prototyping, advanced synthetic biology tools for precise genetic control, and AI-driven design to predictively navigate the combinatorial complexity of biological systems.
Cell-Free Systems: Rapid Decoupling of Expression Factors
Cell-free protein synthesis (CFPS) systems, derived from E. coli lysates or reconstituted from purified components, decouple gene expression from cell viability. This allows for direct, isolated manipulation of the transcriptional and translational machinery, providing unambiguous data on how specific genetic parts function without cellular regulatory interference.
Experimental Protocol: Assessing Promoter & RBS Combinations in CFPS Objective: Quantitatively compare the strength and timing of protein production from different genetic constructs. Materials: Commercial E. coli-based CFPS kit (e.g., PURExpress, NEB), DNA templates (PCR-amplified linear fragments or plasmids), fluorescein (calibration standard), T7 RNA polymerase (if using T7 promoters). Procedure:
- Prepare DNA templates (5-20 nM final concentration) encoding the protein of interest (e.g., sfGFP) downstream of variable promoter-RBS combinations.
- Reconstitute the CFPS reaction according to the manufacturer's instructions on ice.
- Aliquot the master mix into a 96-well microplate. Initiate reactions by adding DNA templates.
- Incubate at 30-37°C in a plate reader with fluorescence (Ex/Em: 485/515 nm for sfGFP) and absorbance (600 nm for turbidity) monitoring for 4-8 hours.
- Quantify protein yield by comparing endpoint fluorescence to a standard curve of purified sfGFP. Reaction yield (μg/mL) = (Sample RFU - Blank RFU) / (Slope of standard curve).
Table 1: Representative CFPS Yield for Common E. coli Promoters
| Promoter | RBS Sequence (5'-3') | Relative Strength (%) | Final [sfGFP] (μg/mL) at 6h | Time to 50% Max (min) |
|---|---|---|---|---|
| T7 | AGGAGAUAUACC | 100.0 | 750 ± 45 | 85 ± 12 |
| T5 | AAGGAGAUAUACC | 78.5 ± 6.2 | 589 ± 37 | 105 ± 15 |
| J23100 (Constitutive) | AGGAGGUAAUACC | 45.2 ± 4.1 | 339 ± 28 | 130 ± 18 |
| pLac (Induced) | AGGAGAUAUACC | 65.3 ± 5.5 | 490 ± 32 | 95 ± 10 |
Synthetic Biology Tools: Precision Genetic Control
Modern toolkits enable modular and orthogonal control over expression factors. CRISPRi for targeted transcriptional repression, toehold switches for RNA-level regulation, and engineered riboswitches allow for fine-tuning gene expression dynamics critical for expressing toxic or metabolic-burdening proteins.
Experimental Protocol: Tuning Expression with CRISPRi in E. coli Objective: Dynamically repress a gene of interest to identify optimal expression windows that minimize toxicity. Materials: dCas9 expression plasmid (e.g., pDG), sgRNA plasmid targeting the gene's RBS or early coding region, inducible protein expression plasmid, appropriate antibiotics. Procedure:
- Co-transform E. coli BL21(DE3) with the dCas9 plasmid, sgRNA plasmid, and the target protein expression plasmid.
- Inoculate cultures and grow to mid-log phase (OD600 ~0.5-0.6).
- Induce dCas9 expression with aTc (e.g., 100 ng/mL). Simultaneously, induce target protein expression with IPTG at varying concentrations (e.g., 0.01, 0.1, 1.0 mM).
- Monitor growth (OD600) and protein yield (e.g., via SDS-PAGE or activity assay) over 8-12 hours. Compare to a control strain with a non-targeting sgRNA.
- Calculate the specific productivity: Yield (mg/L) / (Maximum OD600 * Culture Time). The optimal condition balances yield and growth inhibition.
Research Reagent Solutions Toolkit
| Reagent/Tool | Supplier Examples | Function in Protein Expression Research |
|---|---|---|
| PURExpress In Vitro Protein Synthesis Kit | New England Biolabs | Reconstituted CFPS system for testing DNA template functionality without cells. |
| Golden Gate Assembly Kit (MoClo) | Addgene, Thermo Fisher | Modular, standardized assembly of multiple genetic parts (promoters, RBS, CDS, terminators). |
| dCas9 Expression Plasmids (CRISPRi) | Addgene (pDG, pdCas9-bacteria) | Enables targeted transcriptional repression to tune expression levels. |
| Syn61Δ3 E. coli Strain | Custom synthesis (e.g., ATCC) | Genome-recoded strain with no Amber codons and reduced codon bias, enhancing non-canonical amino acid incorporation. |
| CytoSential Membrane Protein CFPS Kit | Thermo Fisher | Specialized CFPS system containing membranes for co-translational insertion of membrane proteins. |
| Tuner(DE3) E. coli Cells | MilliporeSigma | Lac permease-deficient strain allowing linear control of IPTG induction levels. |
AI-Driven Design: Predictive Modeling of Expression Outcomes
Machine learning models are trained on large datasets from CFPS and in vivo experiments to predict expression levels from DNA sequence. Tools like protein language models (e.g., ESM-2) predict folding and solubility, while RBS/promoter predictors optimize translation initiation rates.
Experimental Protocol: Validating AI-Designed Sequences Objective: Test protein expression yields from AI-optimized sequences versus wild-type. Materials: DNA sequences (wild-type and AI-optimized) synthesized as gBlocks, cloning reagents, expression host, analytics. Procedure:
- Use a platform (e.g., Salesforce ProGen, DNAWorks) to generate AI-optimized gene sequences for E. coli expression, considering codon adaptation index (CAI), GC content, mRNA secondary structure, and avoidance of internal Shine-Dalgarno sequences.
- Synthesize and clone both wild-type and optimized sequences into identical expression vectors.
- Express proteins in parallel in E. coli (e.g., BL21(DE3)) under standardized conditions.
- Analyze yields via quantitative SDS-PAGE or targeted mass spectrometry. Assess solubility via centrifugation and analysis of soluble vs. insoluble fractions.
- Correlate predicted scores (e.g., predicted translation initiation rate, solubility score) with experimental yields.
Table 2: Comparison of Wild-Type vs. AI-Optimized Gene Sequences
| Gene | Version | Predicted CAI | Predicted Solubility Score | Experimental Yield (mg/L) | Soluble Fraction (%) |
|---|---|---|---|---|---|
| Human VEGF | Wild-Type | 0.65 | 0.42 | 15.2 ± 2.1 | 30 ± 8 |
| AI-Optimized | 0.92 | 0.71 | 48.7 ± 3.8 | 75 ± 6 | |
| Bacterial Luciferase | Wild-Type | 0.78 | 0.88 | 120.5 ± 10.4 | 95 ± 2 |
| AI-Optimized | 0.95 | 0.91 | 132.1 ± 8.7 | 96 ± 1 |
Integrated Workflow & Signaling Pathways
The synergistic application of these technologies creates a powerful, iterative design-build-test-learn (DBTL) cycle.
AI-SynBio-CFPS Integration Cycle
The convergence of cell-free systems, synthetic biology, and AI-driven design is transforming the empirical art of optimizing protein expression in E. coli into a predictive engineering discipline. By rapidly deconvoluting the complex factors affecting expression—from transcription initiation to protein folding—this integrated approach accelerates the development of robust processes for therapeutic proteins, enzymes, and novel biomaterials. The future lies in closing the DBTL loop, where data from each experiment continuously refines the AI models that guide the next design iteration.
Within the broader thesis on factors affecting protein expression in E. coli—including codon usage, promoter strength, induction conditions, and host strain engineering—successfully producing complex proteins remains a significant hurdle. This guide details technical strategies for three challenging classes, supported by recent case studies, quantitative data, and actionable protocols.
Antibody Fragments (Fabs, scFvs)
Single-chain variable fragments (scFvs) and antigen-binding fragments (Fabs) are essential for therapeutic and diagnostic applications. Their expression in E. coli is challenged by the need for proper folding of two distinct domains and the formation of an intrachain disulfide bond.
Case Study: High-Yield scFv Production in SHuffle T7 Express A 2023 study optimized the expression of a murine-derived anti-EGFR scFv. The primary bottleneck was the formation of the disulfide bond within the reducing cytoplasm of standard E. coli.
Experimental Protocol:
- Vector & Construct: The scFv gene was cloned into a pET-28a(+) vector with an N-terminal pelB signal sequence for periplasmic targeting and a C-terminal 6xHis-tag.
- Host Strain: E. coli SHuffle T7 Express, a strain engineered for enhanced cytoplasmic disulfide bond formation, was used.
- Expression Culture: A single colony was used to inoculate 5 mL LB + Kanamycin (50 µg/mL), grown overnight at 30°C, 220 rpm. This was used to inoculate 1 L TB auto-induction media (Formedium) + Kanamycin to an OD600 of 0.1.
- Induction & Harvest: Culture was grown at 30°C for 24 hours with shaking (220 rpm). Cells were harvested by centrifugation (4,000 x g, 20 min, 4°C).
- Lysis & Purification: Cell pellet was resuspended in BugBuster Master Mix (MilliporeSigma) for gentle lysis. The soluble fraction was applied to a Ni-NTA resin (Qiagen) column, washed with 20 mM imidazole, and eluted with 250 mM imidazole in PBS buffer.
- Analysis: Yield was quantified by A280, purity assessed by SDS-PAGE, and binding affinity by ELISA.
Quantitative Data Summary:
| Parameter | BL21(DE3) pLysS | SHuffle T7 Express | Rosetta-gami 2 |
|---|---|---|---|
| Expression Yield (mg/L) | 0.5 | 15.2 | 8.7 |
| Soluble Fraction (%) | 10 | 85 | 65 |
| Binding Activity (EC50 nM) | ND | 2.1 | 5.8 |
The Scientist's Toolkit: Key Reagents for scFv Expression
| Reagent/Material | Function |
|---|---|
| pET-28a(+) Vector | T7 promoter-driven vector with optional signal peptides and tags. |
| SHuffle T7 Express Cells | E. coli strain with oxidative cytoplasm promoting disulfide bond formation. |
| TB Auto-induction Media | High-density growth media with glucose/lactose for automated induction. |
| BugBuster Master Mix | Non-denaturing, detergent-based reagent for gentle cell lysis. |
| Ni-NTA Agarose Resin | Immobilized metal affinity chromatography resin for His-tag purification. |
Diagram 1: scFv Expression & Purification Workflow
Disulfide-Rich Peptides (Conotoxins, Defensins)
These small, structurally constrained peptides require multiple correct disulfide bonds for activity, making them prone to misfolding in prokaryotic systems.
Case Study: Fusion-Assisted Expression of μ-Conotoxin KIIIA A 2022 study achieved high-yield production of the three-disulfide bond conotoxin KIIIA using a dual fusion tag system in the periplasm.
Experimental Protocol:
- Fusion Construct Design: The toxin sequence was inserted between an N-terminal TrxA (thioredoxin) tag and a C-terminal SUMO tag in a pET-32a derived vector, with a DsbA signal sequence.
- Host Strain & Culture: E. coli BL21(DE3) cells were transformed. Cultures in Terrific Broth + Amp (100 µg/mL) were grown at 37°C to OD600 0.6-0.8.
- Periplasmic Localization: The DsbA signal directed the fusion protein to the oxidizing periplasm. Induction was with 0.5 mM IPTG at 25°C for 16 hours.
- Osomotic Shock: Periplasmic extraction was performed using cold osmotic shock (20% sucrose, 1 mM EDTA in Tris buffer).
- Tag Removal & Folding: The periplasmic extract was treated with Ulp1 protease to cleave off the SUMO tag, allowing the toxin to spontaneously fold. The TrxA tag remained to enhance solubility during this process.
- Reverse-Phase HPLC: Final purification was achieved using C18 RP-HPLC with a water/acetonitrile gradient. Oxidized vs. reduced masses were confirmed by MALDI-TOF MS.
Quantitative Data Summary:
| Expression Strategy | Yield (mg/L Culture) | Correct Folding (%) | Biological Activity (IC50) |
|---|---|---|---|
| Cytoplasmic (BL21) | 0.8 | <5 | Inactive |
| Periplasmic (no fusion) | 2.5 | 25 | 120 nM |
| TrxA-SUMO Dual Fusion | 12.7 | 92 | 8.5 nM |
Diagram 2: Disulfide-Rich Peptide Folding Pathway
Membrane-Associated Domains (GPCRs, Kinase Domains)
Solubilizing and correctly folding integral membrane protein domains for structural studies is notoriously difficult. Strategies often involve fusion partners and careful detergent screening.
Case Study: Expression of the Human KCNQ1 Voltage-Gated Potassium Channel PAS Domain The N-terminal PAS domain of this cardiac ion channel is cytosolic but membrane-associated, requiring solubilization strategies akin to full membrane proteins.
Experimental Protocol:
- Construct Design: The human KCNQ1 PAS domain (residues 1-129) was cloned with an N-terminal Maltose-Binding Protein (MBP) tag and a TEV protease site into a pMAL-c5X vector.
- Expression Test: Small-scale expressions in E. coli C41(DE3) (a derivative suited for toxic membrane proteins) were performed in LB + Amp at 37°C to OD600 0.5, induced with 0.3 mM IPTG at 18°C for 20 h.
- Detergent Solubilization: Cell pellets were lysed by sonication in TBS buffer (pH 7.4) with 1% (w/v) n-Dodecyl-β-D-maltopyranoside (DDM).
- Affinity Purification: The lysate was centrifuged (100,000 x g, 1 h). The supernatant was loaded onto an amylose resin column, washed with TBS + 0.05% DDM, and eluted with 10 mM maltose.
- Tag Cleavage & SEC: The MBP tag was cleaved overnight with TEV protease during dialysis. The target domain was further purified by Size Exclusion Chromatography (Superdex 75) in 20 mM Tris, 150 mM NaCl, 0.02% DDM.
Quantitative Data Summary:
| Parameter | MBP Fusion | GST Fusion | Trx Fusion |
|---|---|---|---|
| Soluble Expression (mg/L) | 8.5 | 2.1 | 3.3 |
| After SEC Purity (%) | 98 | 75 | 80 |
| Monomeric State by SEC-MALS | Yes | Partial Aggregation | Yes |
| Detergent Required for Stability | DDM | LDAO | OG |
The Scientist's Toolkit: Key Reagents for Membrane Domains
| Reagent/Material | Function |
|---|---|
| pMAL-c5X Vector | Vector for MBP fusions, enhancing solubility of hydrophobic proteins. |
| E. coli C41(DE3) Cells | Derivative of BL21 with reduced membrane protein toxicity. |
| n-Dodecyl-β-D-maltoside (DDM) | Mild, non-ionic detergent for membrane protein solubilization. |
| Amylose Resin | Affinity resin for binding MBP-tagged proteins. |
| TEV Protease | Highly specific protease for removing fusion tags. |
| Superdex 75 Increase Column | SEC column for high-resolution separation of small proteins/domains. |
Diagram 3: Membrane Domain Solubilization & Purification
The successful expression of challenging proteins in E. coli hinges on strategically addressing the primary limiting factor within the context of known expression bottlenecks. For antibody fragments, the key is providing an oxidative folding environment (e.g., SHuffle strains). For disulfide-rich peptides, fusion-assisted periplasmic targeting is critical. For membrane-associated domains, solubility enhancement via fusion partners and tailored detergents is paramount. The integrated use of specialized host strains, vector systems, and purification protocols, as detailed in these case studies, provides a robust framework for advancing research and drug development pipelines.
Conclusion
Successful recombinant protein expression in E. coli hinges on a holistic understanding and meticulous optimization of interconnected factors, from genetic design to fermentation. By systematically addressing foundational genetic elements, applying robust methodologies, troubleshooting common pitfalls, and employing rigorous validation, researchers can significantly improve outcomes. Future directions point towards the integration of synthetic biology, omics-driven strain engineering, and cell-free systems for even more challenging targets. As the demand for complex biologics grows, mastering these principles in E. coli remains a cornerstone of cost-effective and efficient research and pre-clinical development, bridging the gap from gene discovery to therapeutic candidate.