High-Throughput Protein Screening: A Comprehensive Guide to DLS Plate Reader Technology and Applications
This article provides a detailed exploration of Dynamic Light Scattering (DLS) plate readers as a pivotal tool for high-throughput protein screening in modern drug discovery.
High-Throughput Protein Screening: A Comprehensive Guide to DLS Plate Reader Technology and Applications
Abstract
This article provides a detailed exploration of Dynamic Light Scattering (DLS) plate readers as a pivotal tool for high-throughput protein screening in modern drug discovery. Tailored for researchers, scientists, and drug development professionals, it covers the foundational principles of DLS technology, advanced methodologies for aggregation and stability analysis, troubleshooting for common experimental challenges, and a comparative validation against other biophysical techniques. The full scope offers actionable insights for implementing robust, efficient protein characterization workflows, from early-stage development to formulation optimization.
What is DLS Plate Reader Technology? Foundational Principles for Protein Analysis
Dynamic Light Scattering (DLS) is a non-invasive, well-established technique for determining the size distribution and hydrodynamic diameter of particles, including proteins, nanoparticles, and aggregates, in solution. Within the context of high-throughput protein screening using DLS plate readers, understanding the core principles is critical for robust assay development, screening for monodispersity, detecting aggregation, and identifying optimal buffer conditions during drug discovery.
Core Principles of DLS in Solution
Brownian Motion and the Stokes-Einstein Equation
The fundamental principle of DLS is the analysis of Brownian motion—the random movement of particles suspended in a fluid due to collisions with solvent molecules. DLS instruments measure the velocity of this motion. Smaller particles diffuse faster, while larger particles diffuse more slowly. The hydrodynamic diameter (dH) is calculated from the translational diffusion coefficient (D) using the Stokes-Einstein equation: dH = kBT / (3πηD) Where:
- kB = Boltzmann constant
- T = Absolute temperature (K)
- η = Solvent viscosity
Intensity Fluctuations and Autocorrelation
A laser illuminates the sample, and the scattered light intensity is detected at a fixed angle (commonly 173° for backscatter to minimize multiple scattering). Due to Brownian motion, the relative positions of particles change, causing constructive and destructive interference in the scattered light. This results in rapid, random intensity fluctuations over time. A digital autocorrelator analyzes these fluctuations to generate an intensity autocorrelation function (ACF), which decays at a rate dependent on the particle size.
From Correlation Function to Size Distribution
The decay profile of the ACF is analyzed to extract the diffusion coefficient. For monodisperse samples, the decay is a single exponential. For polydisperse samples, it is a multi-exponential decay. Algorithms (e.g., cumulants analysis, CONTIN, NNLS) fit the ACF to derive an intensity-weighted size distribution. Key outputs are the Z-average diameter (intensity-weighted mean) and the polydispersity index (PdI), which quantifies the breadth of the distribution.
Key Quantitative Metrics from DLS
Table 1: Core Quantitative Outputs from DLS Measurement
| Metric | Definition | Interpretation in Protein Screening | Typical Target Value for Proteins |
|---|---|---|---|
| Z-Average (d.nm) | Intensity-weighted mean hydrodynamic diameter. Primary, robust indicator of mean size. | Monitors protein oligomeric state and stability. Shifts indicate aggregation or degradation. | Monomeric protein: Size consistent with known structure (e.g., 3-10 nm). |
| Polydispersity Index (PdI) | Dimensionless measure of distribution width (0 to 1). Calculated from cumulants analysis. | Indicator of sample homogeneity. Low PdI = monodisperse; High PdI = polydisperse/aggregated. | PdI < 0.1: Monodisperse. PdI 0.1-0.2: Moderately polydisperse. PdI > 0.2: Polydisperse. |
| Intensity Size Distribution | Plot of relative intensity of scattered light vs. particle size. | Visual identification of populations (monomer, aggregate, fragment). | A single, sharp peak is ideal. |
| % Intensity by Size | Quantifies the scattering intensity contribution of different size populations. | Critical for detecting small populations of large aggregates, which dominate scattering. | e.g., >99% intensity in monomer peak. |
Application Notes for High-Throughput DLS in Protein Screening
Application Note 1: Rapid Assessment of Protein Monodispersity
Objective: Quickly screen multiple protein constructs or formulations in a 96- or 384-well plate to identify monodisperse, well-behaved candidates for downstream structural or functional studies. Protocol:
- Sample Preparation: Prepare protein samples at a consistent concentration (ideally 0.5-2 mg/mL) in a clear-bottom, low-volume 384-well microplate. Include buffer-only wells for background subtraction.
- Instrument Setup: Load plate into a DLS-enabled plate reader (e.g., Wyatt Technology's DynaPro Plate Reader, Malvern Panalytical's High Throughput DLS system). Set temperature to 25°C (or desired screening temp). Define measurement positions per well.
- Acquisition Parameters: Set number of acquisitions (5-10), acquisition time per read (3-10 seconds). Enable automatic attenuator adjustment.
- Data Analysis: Software automatically calculates Z-average and PdI for each well. Apply user-defined filters (e.g., flag wells where PdI > 0.2 or Z-average deviates >15% from expected monomer size).
- Output: Heat maps of Z-average and PdI across the plate for visual hit identification.
Application Note 2: Thermal Stability Screening via Melting Point (Tm) Determination
Objective: Identify buffer conditions or ligands that stabilize a target protein by measuring its aggregation temperature. Protocol:
- Plate Setup: Dispense identical protein samples into a row of wells. Fill adjacent wells with different buffer additives, ligands, or formulation excipients.
- Temperature Ramp Program: Program a temperature gradient (e.g., 20°C to 80°C at a rate of 0.5°C/min). The DLS reader will perform sequential measurements at each well as the plate heats.
- Measurement: The instrument monitors the scattered light intensity or calculated size at each temperature step. As the protein unfolds and aggregates, size and scattering intensity increase sharply.
- Analysis: Plot aggregate count rate or apparent size vs. temperature. The inflection point or midpoint of the transition is reported as the aggregation temperature (Tagg). Higher Tagg indicates greater stabilization.
- Output: Table of Tagg values for each condition; rank formulations by stabilizing effect.
The Scientist's Toolkit: Research Reagent Solutions
Table 2: Essential Materials for High-Throughput DLS Screening
| Item | Function & Importance | Example Product/Brand |
|---|---|---|
| Ultra-Low Volume 384-Well Plates | Minimizes sample consumption (as low as 2-5 µL per well). Clear, flat bottom ensures optimal laser path and light scattering. | Corning 384-Well Low Volume Round Bottom Plates, Greiner µClear |
| High-Quality Protein Filters | Essential for removing dust and pre-existing aggregates before loading samples into plates, preventing artefacts. | 0.1 µm or 0.02 µm PVDF or ANOTOP syringe filters. |
| Precision Liquid Handling System | Enables accurate, reproducible dispensing of µL volumes of precious protein samples and buffers across high-density plates. | Hamilton Microlab STAR, Tecan D300e Digital Dispenser. |
| Validated Size Standards | Nano- and protein-size standards (e.g., monodisperse latex beads, BSA) for routine verification of instrument performance and accuracy. | NIST-traceable polystyrene nanospheres (e.g., 60 nm). |
| DLS-Compatible Buffer Components | Use of filtered, ultrapure buffers and reagents. Avoid viscous agents or large micelles at concentrations that generate significant background signal. | Molecular biology-grade Tris, NaCl, etc. Filter through 0.02 µm filter. |
| DLS Plate Reader with Temperature Control | Integrated system combining microplate handling, precise temperature control (Peltier), laser, and detector for automated, high-throughput DLS. | Wyatt DynaPro Plate Reader III, Malvern Panalytical Spectris APEX. |
Experimental Protocols
Protocol 1: Standard Monodispersity Check for a Purified Protein
Objective: Determine the hydrodynamic size and polydispersity of a purified protein sample.
- Clean Equipment: Thoroughly clean the cuvette or microplate well with filtered solvent (e.g., ethanol, then filtered water). Use a dust-free environment.
- Prepare Sample: Centrifuge protein solution at >15,000 x g for 10 minutes at 4°C. Carefully pipette the supernatant. Filter through a 0.1 µm (or 0.02 µm for smaller proteins) centrifugal filter.
- Load Sample: Pipette minimum required volume (e.g., 45 µL for a cuvette, 5 µL for a low-volume well) into the clean vessel. Avoid introducing bubbles.
- Run Measurement: Place in instrument equilibrated to 20°C. Set to acquire 10-15 measurements of 10 seconds each.
- Analyze: Use cumulants analysis to obtain Z-average and PdI. Examine the intensity size distribution plot for peak shape and the presence of minor large-diameter peaks indicating aggregates.
Protocol 2: High-Throughput Ligand Binding Screen via Stability Shift
Objective: Screen a library of small molecules for binding to a target protein by detecting ligand-induced thermal stabilization.
- Prepare Master Mix: Prepare a solution of target protein in assay buffer at 1 mg/mL.
- Dispense Ligands: Using a non-contact dispenser, transfer 20 nL of each compound (in DMSO) from a source library plate to a 384-well low-volume assay plate. Include DMSO-only control wells.
- Add Protein: Dispense 20 µL of the protein master mix into all wells. Final protein concentration is ~1 mg/mL; final DMSO is 0.1%.
- Centrifuge: Briefly centrifuge plate (1000 x g, 1 min) to settle liquid and remove bubbles.
- Program Run: Load plate into DLS reader. Program a method to measure size at 25°C (baseline), then ramp temperature from 25°C to 80°C at 0.5°C/min, taking a DLS measurement every 1-2°C.
- Data Processing: Software calculates Tagg for each well. Identify hits as compounds that increase Tagg by >2°C over the DMSO control average.
Visualizations
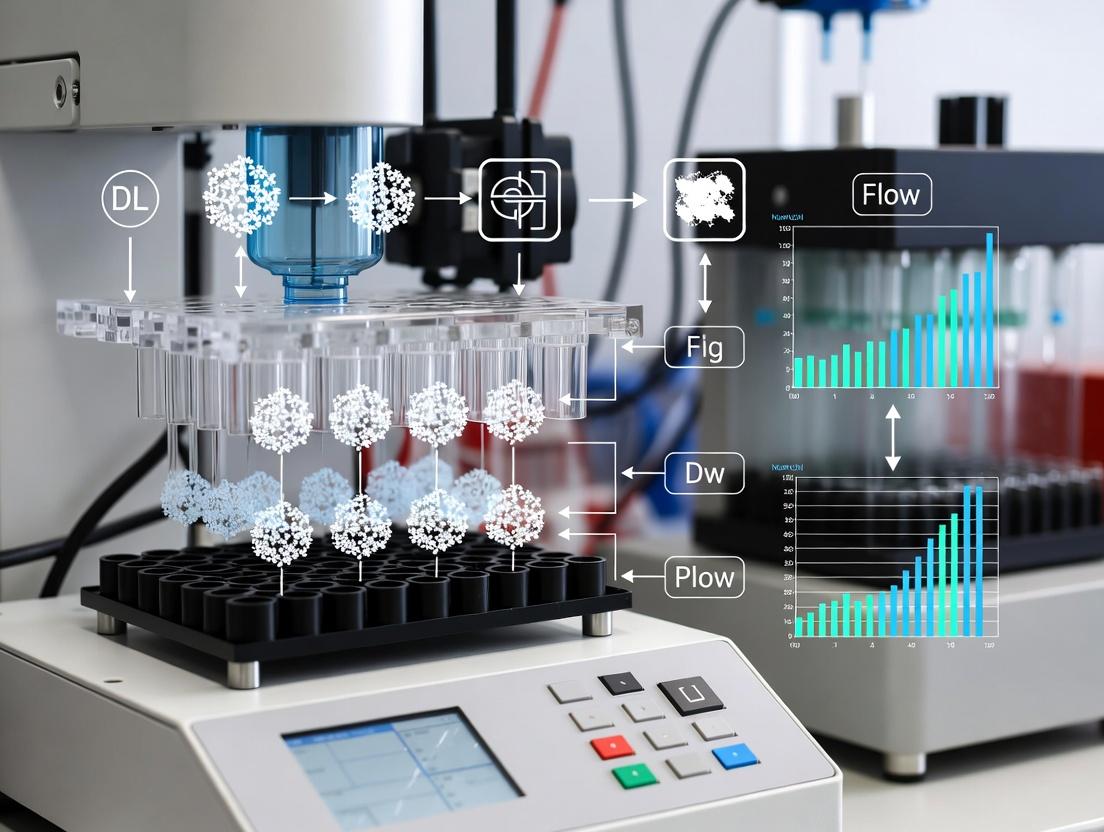
DLS Measurement Workflow from Sample to Result
DLS Thermal Shift Assay Protocol Flow
The transition from traditional cuvette-based Dynamic Light Scattering (DLS) to automated microplate readers represents a pivotal evolution in biophysical characterization. This shift, framed within a thesis on high-throughput protein screening, addresses the critical need for rapid, multi-parameter assessment of protein stability, aggregation, and size distribution in drug discovery. This document details application notes and protocols leveraging this technological advancement.
Application Notes & Quantitative Data
Application Note 1: High-Throughput Protein Formulation Screening Objective: Rapidly identify optimal buffer conditions that minimize protein aggregation for 96 unique formulations. Experimental Design: A monoclonal antibody (1 mg/mL) was dispensed into a 96-well plate with varying pH, ionic strength, and excipient conditions. Hydrodynamic radius (Rh) and polydispersity index (PDI) were measured using a high-throughput DLS plate reader. Results Summary: Key findings on formulation stability are tabulated below.
Table 1: DLS Plate Reader Output for Top Formulation Candidates
| Formulation ID | pH | Key Excipient | Rh (nm) | PDI | % Intensity >100 nm |
|---|---|---|---|---|---|
| F12 | 6.5 | 10% Sucrose | 5.2 ± 0.1 | 0.05 ± 0.01 | < 0.1 |
| F33 | 7.2 | 5% Sorbitol | 5.4 ± 0.2 | 0.08 ± 0.02 | 0.5 |
| F58 | 8.0 | 150mM NaCl | 6.1 ± 0.3 | 0.15 ± 0.05 | 12.4 |
| F72 | 5.5 | 0.01% PS80 | 5.3 ± 0.2 | 0.06 ± 0.01 | < 0.1 |
Application Note 2: Aggregation Kinetics Under Thermal Stress Objective: Quantify time-dependent aggregation for 48 samples in parallel to determine apparent Tagg. Experimental Design: Protein samples were subjected to a thermal ramp from 25°C to 80°C at 0.5°C/min in a temperature-controlled DLS plate reader. Rh and scattering intensity were monitored in real-time for each well. Results Summary: The apparent aggregation temperature (Tagg), defined as a 10% increase in Rh, was automatically calculated.
Table 2: Aggregation Temperature (Tagg) for Protein Variants
| Protein Variant | Mutation | Apparent Tagg (°C) | Max Rh at 80°C (nm) |
|---|---|---|---|
| Wild-Type | -- | 62.1 ± 0.5 | 45.2 |
| V12A | Stabilizing | 68.4 ± 0.3 | 8.7 |
| L55P | Destabilizing | 52.7 ± 0.8 | >1000 |
| K89R | Neutral | 61.8 ± 0.4 | 48.1 |
Detailed Experimental Protocols
Protocol 1: High-Throughput Formulation Screen via DLS Plate Reader
I. Materials & Reagent Setup
- Protein Solution: Purified protein at 5-10 mg/mL in a reference buffer.
- Buffer & Excipient Stock Solutions: Prepare concentrated stocks for pH buffers, salts, sugars, surfactants.
- Microplate: 96-well or 384-well clear-bottom, low-protein-binding plate (e.g., CORNING 3540).
- Sealing Tape: Optically clear, adhesive sealing film.
- DLS-Enabled Plate Reader: Equipped with a multi-angle or back-scatter DLS detector and temperature control.
II. Procedure
- Plate Layout: Design a plate map assigning buffer conditions to wells. Include triplicates of a reference formulation control.
- Dispensing: Using a liquid handler, first dispense 90 µL of each unique buffer/excipient formulation into the assigned wells.
- Protein Addition: Add 10 µL of the master protein stock to each well, achieving a final volume of 100 µL and target protein concentration (e.g., 1 mg/mL). Mix via gentle pipetting or plate shaking.
- Sealing: Apply optically clear sealing tape to prevent evaporation.
- Centrifugation: Centrifuge the plate at 1000 x g for 2 minutes to remove air bubbles.
- DLS Measurement:
- Load plate into the pre-equilibrated (20°C) DLS plate reader.
- Set acquisition parameters: 3-5 measurements per well, 5-second integration time per measurement.
- For each well, the instrument software automatically calculates and reports intensity-weighted mean Rh, PDI, and size distribution profiles.
- Data Analysis: Export data. Plot Rh vs. PDI for all formulations. Identify optimal candidates (lowest Rh and PDI).
Protocol 2: Real-Time Aggregation Kinetics Assay
I. Materials
- As per Protocol 1, with samples prepared in desired buffer.
- DLS plate reader with precise thermal control (Peltier or incubator).
II. Procedure
- Sample Preparation: Prepare protein samples at 0.5-2 mg/mL in a clear-bottom plate. Seal as in Protocol 1.
- Instrument Setup:
- Load plate.
- Set temperature protocol: Equilibrate at 25°C for 5 minutes, then ramp to 80°C at a rate of 0.5°C/min.
- Set DLS to perform a measurement cycle (e.g., 1-minute intervals) at each well after every 1°C increase.
- Automated Run Initiation: Start the programmed method. The instrument will sequentially measure each well at each temperature step.
- Data Analysis:
- Software typically extracts Rh and total scattering intensity (count rate) vs. temperature.
- Plot these parameters. Tagg is determined as the temperature at which Rh or count rate deviates significantly from the native baseline (e.g., 10% increase).
Visualizations
Title: High-Throughput DLS Plate Reader Workflow
Title: Protein Aggregation Pathway & DLS Detection
The Scientist's Toolkit: Key Research Reagent Solutions
| Item | Function & Rationale |
|---|---|
| Low-Binding Microplates (e.g., CORNING Non-Binding Surface) | Minimizes protein adsorption to well walls, ensuring accurate concentration and DLS measurement. |
| Optically Clear Sealing Films | Prevents evaporation during extended thermal runs, which would alter concentration and cause artifacts. |
| Liquid Handling Robots (e.g., via Integra Assist Plus) | Enables precise, reproducible dispensing of µL volumes for large formulation screens, critical for accuracy. |
| Standardized Protein Size Ladder (e.g., monodisperse polystyrene nanobeads) | Essential for daily validation and calibration of DLS plate reader performance across the plate. |
| Stabilization Cocktail Library | Pre-mixed stocks of common excipients (sugars, amino acids, surfactants) for rapid formulation matrix assembly. |
| Multi-Parameter Analysis Software | Proprietary or third-party software capable of batch processing DLS data from hundreds of wells and calculating trends. |
Application Notes
Dynamic Light Scattering (DLS) in a plate reader format has become an indispensable tool for high-throughput screening in protein therapeutic development. The core metrics—hydrodynamic radius (Rh), polydispersity index (PDI), and intensity distribution—provide rapid, label-free insights into protein stability, aggregation propensity, and batch-to-batch consistency. Within the thesis on leveraging DLS plate readers for high-throughput protein screening, these metrics form the primary data triad for early-stage developability assessment. Rh offers a size-based fingerprint of the dominant species, PDI quantifies sample homogeneity critical for formulation, and the intensity distribution reveals sub-populations of aggregates or fragments that could impact immunogenicity. This approach enables the parallel analysis of hundreds of protein variants or formulation conditions, accelerating the identification of lead candidates with optimal biophysical properties.
The following table summarizes typical benchmark values and interpretation guidelines for key DLS metrics in protein screening contexts.
Table 1: Interpretation of DLS Metrics for Monoclonal Antibody Screening
| Metric | Ideal Range (Monodisperse) | Caution Range | Problem Range | Key Interpretation |
|---|---|---|---|---|
| Rh (nm) | 5-10 nm (for mAbs) | +/- 15% from control | >20% increase or multimodal distribution | Indicates native size. Increase suggests aggregation or unfolding. |
| PDI | <0.1 | 0.1 - 0.2 | >0.2 | Measure of size distribution width. Lower PDI indicates high homogeneity. |
| Peak Ratio (Intensity Distribution) | Single dominant peak (>95% intensity) | Secondary peak <5% intensity | Secondary peak >10% intensity | Identifies subvisible aggregates (larger Rh) or fragments (smaller Rh). |
Table 2: Example High-Throughput Screening Results for 96 Formulation Conditions
| Formulation Condition | Average Rh (nm) | Average PDI | % Wells with Aggregates (Peak >10nm) | Stability Score (1-5) |
|---|---|---|---|---|
| Histidine Buffer, pH 6.0 | 9.2 ± 0.3 | 0.05 ± 0.02 | 2% | 5 |
| Phosphate Buffer, pH 7.4 | 9.5 ± 0.4 | 0.08 ± 0.03 | 5% | 4 |
| Acetate Buffer, pH 5.0 | 10.1 ± 1.2 | 0.22 ± 0.10 | 45% | 2 |
| With 250mM Sucrose | 9.1 ± 0.2 | 0.04 ± 0.01 | 0% | 5 |
Experimental Protocols
Protocol 1: High-Throughput Protein Stability Screening via DLS Plate Reader
Objective: To simultaneously assess the thermal stability of 96 protein variants or formulations by measuring changes in Rh, PDI, and intensity distribution.
Materials: (See "The Scientist's Toolkit" below) Method:
- Sample Preparation: Dilute purified protein variants to a standard concentration (e.g., 1 mg/mL) in their respective formulation buffers using a liquid handler. Ensure minimal introduction of dust or bubbles.
- Plate Loading: Transfer 40-50 µL of each sample to a clean, low-volume, optically clear 96-well or 384-well plate. Centrifuge the plate at 1000 x g for 2 minutes to remove bubbles and settle particles.
- Instrument Calibration: Perform a quick calibration using a standard latex bead sample (e.g., 60 nm) according to the manufacturer's instructions.
- Baseline Measurement: Load the plate into the pre-equilibrated DLS plate reader. Set the temperature to 25°C. Allow a 5-minute equilibration period. Acquire DLS measurements for each well (typical acquisition: 3-5 reads of 10 seconds each).
- Stress Application: Ramp the plate temperature to a stressed condition (e.g., 55°C) at a defined rate (e.g., 1°C/min). Hold for 10 minutes.
- Post-Stress Measurement: Acquire DLS measurements again at the stressed temperature.
- Cooling & Recovery Measurement: Cool the plate back to 25°C and acquire a final set of measurements.
- Data Analysis: For each well, extract the Rh and PDI from the intensity-based size distribution. Analyze the intensity distribution plots for the appearance of secondary peaks, particularly at higher Rh values indicating aggregation. Calculate the ratio of the main peak intensity before and after stress.
Protocol 2: Aggregation Kinetics Monitoring
Objective: To monitor the time-dependent formation of protein aggregates under stressed conditions.
Method:
- Prepare samples as in Protocol 1, step 1.
- Load the plate and set the DLS reader to a constant stress temperature (e.g., 40°C or 45°C).
- Program the instrument to take automated measurements from each well at fixed time intervals (e.g., every 5 minutes for 24 hours).
- Export the Rh, PDI, and full intensity distribution for each time point.
- Plot Rh and PDI vs. time. The time-point at which PDI exceeds 0.2 or Rh shows a sharp increase indicates the onset of aggregation.
Visualizations
High-Throughput DLS Screening Workflow
Decision Logic for DLS Metric Interpretation
The Scientist's Toolkit
Table 3: Essential Research Reagent Solutions for HT-DLS Protein Screening
| Item | Function & Importance in HT-DLS |
|---|---|
| Low-Volume, Clear Bottom Microplates | 96- or 384-well plates with minimal meniscus and optical clarity are essential for accurate, automated light scattering measurements. |
| Pre-Filtered Buffers & Solutions | All buffers must be filtered through 0.02 µm or 0.1 µm filters to remove dust particles that cause scattering artifacts. |
| Latex Size Standards | Nanoparticles of known size (e.g., 60 nm) are used for daily instrument validation and performance qualification. |
| Liquid Handling Robot | Enables precise, reproducible dispensing of protein samples and formulations into microplates, critical for throughput and accuracy. |
| Stabilizing Excipients Library | A pre-arrayed collection of sugars (sucrose), surfactants (PS80), and salts for formulation screening to identify stabilizers. |
| Sealing Films & Plate Spinners | Non-evaporative seals and plate centrifuges remove bubbles and prevent sample loss during thermal stressing. |
| Data Analysis Software | Specialized software capable of batch-processing hundreds of DLS correlograms to extract Rh, PDI, and distribution plots. |
The Critical Role of DLS in Early-Stage Biotherapeutic Development
Dynamic Light Scattering (DLS) has become an indispensable analytical technique in early-stage biotherapeutic development. Operating within high-throughput DLS plate readers, this technology enables researchers to rapidly screen and characterize protein candidates for critical attributes like aggregation, oligomeric state, and hydrodynamic size. This is crucial for identifying developable leads, as early detection of instability or unwanted self-association can de-prioritize problematic molecules, saving substantial time and resources. These application notes detail protocols and data interpretation for integrating DLS plate readers into a high-throughput protein screening workflow.
Table 1: DLS Size Thresholds for Lead Candidate Triage
| Parameter | Acceptable Range | Caution Range | Reject Range | Significance |
|---|---|---|---|---|
| Hydrodynamic Diameter (Monomer) | 3-10 nm* | 10-15 nm | >15 nm | Indicates correct folding; larger size may suggest misfolding or non-native oligomer. |
| Polydispersity Index (PDI) | < 0.15 | 0.15 - 0.25 | > 0.25 | Measure of sample homogeneity. Low PDI is critical for monodisperse therapeutic candidates. |
| % Intensity in Aggregates | < 2% | 2% - 10% | > 10% | Early indicator of aggregation propensity, a key developability risk. |
| Z-Average (d.nm) | Within 20% of theoretical | 20-40% deviation | >40% deviation | Overall mean size. Significant deviation from theoretical warrants investigation. |
*Varies by protein molecular weight.
Table 2: High-Throughput DLS Plate Reader Comparative Metrics
| Instrument Model | Minimum Sample Volume | Well Plate Format | Measurement Time per Well | Temperature Control Range | Aggregation Detection Sensitivity |
|---|---|---|---|---|---|
| SpectraMax iD5 (Molecular Devices) | 2 µL | 96, 384, 1536 | < 30 seconds | 4°C - 45°C | < 0.1% (for large aggregates) |
| DynaPro Plate Reader III (Wyatt) | 4 µL | 96, 384, 1536 | ~ 1 minute | 0°C - 65°C | < 0.5% |
| ZetaSizer Plate Reader (Malvern) | 5 µL | 96, 384 | ~ 2 minutes | 0°C - 120°C | < 0.1% |
Experimental Protocols
Protocol 1: High-Throughput Monomeric Purity and Aggregation Screen
Objective: Rapidly screen 96 purified protein variants for monomeric hydrodynamic radius (Rh) and aggregate content. Materials: DLS-compatible clear-bottom 96-well plate, sealing tape, purified protein samples (>0.5 mg/mL), formulation buffer. Procedure:
- Sample Preparation: Dilute all protein variants to a standard concentration (e.g., 1 mg/mL) in a filtered formulation buffer (e.g., PBS, 0.22 µm filtered). Centrifuge at 15,000 x g for 10 minutes to remove dust/large particles.
- Plate Loading: Pipette 10 µL of each clarified supernatant into individual wells. Include buffer-only controls in at least 6 wells for baseline measurement.
- Plate Sealing: Carefully apply optically clear, non-permeable sealing tape to prevent evaporation.
- Instrument Setup: Load plate into DLS plate reader. Set temperature to 25°C. Define measurement parameters: 5 acquisitions per well, duration 5 seconds each.
- Data Acquisition: Run the high-throughput measurement protocol. The system automatically positions each well under the laser/detector.
- Data Analysis: Software calculates Z-average, PDI, and size distribution by intensity. Compare sample Rh to buffer control. Flag samples where >2% of scattered light intensity comes from particles >100 nm.
Protocol 2: Thermal Stability Assessment via Temperature Ramp DLS
Objective: Determine the apparent melting temperature (Tm) and aggregation onset temperature (Tagg) of lead candidates. Materials: As in Protocol 1, DLS plate reader with precise temperature control. Procedure:
- Sample Loading: Prepare protein samples at 0.5-1 mg/mL in formulation buffer. Load 15 µL into designated wells.
- Temperature Program: Program a thermal ramp from 20°C to 80°C at a rate of 0.5°C/minute, with a DLS measurement taken every 1-2°C.
- Data Collection: The instrument monitors Rh and scattering intensity at each temperature step.
- Analysis: Plot Rh and total scattering intensity vs. temperature. The inflection point in the Rh curve indicates Tm (unfolding). A sharp increase in scattering intensity indicates Tagg (aggregation onset). Candidates with a larger gap (Tagg - Tm) are typically more developable.
Visualization
Diagram 1: DLS in Early Biotherapeutic Screening Workflow
Diagram 2: DLS Data Interpretation for Protein States
The Scientist's Toolkit: Essential Research Reagent Solutions
Table 3: Key Materials for High-Throughput DLS Screening
| Item | Function | Key Consideration |
|---|---|---|
| DLS-Compatible Microplate (e.g., Corning #4515) | Holds samples for automated reading. Low fluorescence and ultra-clear bottom minimize background scatter. | Must be compatible with instrument autoloader. Black walls reduce cross-talk. |
| Optically Clear Sealing Tape (e.g., Thermo Fisher #AB0558) | Seals plate to prevent evaporation, which can artifactually increase concentration and induce aggregation. | Non-permeable and low-adhesion for easy removal without sample loss. |
| 0.22 µm Filtered Formulation Buffer (e.g., PBS, Histidine buffer) | Standardizes solvent conditions and removes particulate contaminants that interfere with DLS measurements. | Always filter and degas buffers before use. Include in plate as negative controls. |
| Size Standard Nanoparticles (e.g., 2 nm, 50 nm gold standards) | Validates instrument performance and calibration before screening runs. | Use monodisperse standards with known size and low PDI. |
| Protein Stabilization Positive Control (e.g., BSA at 10 mg/mL) | Acts as a technical control for assay consistency and sample handling. | Should yield consistent, known Rh and PDI across plates. |
| Aggregation-Inducing Negative Control (e.g., Heat-stressed antibody) | Provides a positive signal for aggregate detection algorithms. | Useful for setting threshold values for % aggregation. |
In the context of high-throughput protein screening for drug discovery, the integration of Dynamic Light Scattering (DLS) technology into microplate readers represents a paradigm shift. This combination enables the rapid analysis of protein size, aggregation, and stability directly in multi-well plates, overcoming critical limitations of traditional standalone DLS systems and size-exclusion chromatography (SEC). This document details the quantitative advantages and provides standardized protocols for leveraging DLS plate readers in screening campaigns.
Comparative Performance Data
Table 1: Quantitative Comparison of DLS Plate Reader vs. Traditional Methods
| Parameter | Traditional DLS (Cuvette-based) | Size-Exclusion Chromatography (SEC) | DLS Plate Reader (HT) |
|---|---|---|---|
| Sample Throughput | 4-12 samples/hour | 1-2 samples/hour | 96-384 samples/hour |
| Minimum Sample Volume | 50-120 µL | 50-100 µL | 2-10 µL |
| Aggregation Detection Sensitivity | ~0.1% (w/w) | ~1-5% (w/w) | ~0.01% (w/w) |
| Typical Measurement Time | 2-5 minutes/sample | 15-30 minutes/sample | 1-2 minutes/sample |
| Automation Compatibility | Low (manual loading) | Medium (autosampler) | High (robotic plate handling) |
| Sample Consumption per 96-well Plate | ~5-12 mL (extrapolated) | ~5-10 mL (extrapolated) | < 1 mL |
Key Application Notes
High-Throughput Protein Stability Screening
- Principle: Monitor changes in hydrodynamic radius (Rh) and polydispersity index (PdI) as a function of temperature, pH, or excipient concentration to identify optimal formulation conditions.
- Advantage: A single 96-well plate can generate full thermal melt profiles for 48 different formulations in duplicate in under 2 hours, compared to days using differential scanning calorimetry (DSC) or manual DLS.
Rapid Aggregation Kinetics
- Principle: Time-based measurements of Rh and % intensity from large particles to quantify aggregation onset and kinetics under stress conditions (e.g., shaking, repeated freeze-thaw).
- Advantage: Enables real-time monitoring of dozens of samples in parallel, providing statistically robust kinetic data with minimal sample consumption.
Label-Free Binding Affinity (via Size Shift)
- Principle: Detect the increase in Rh upon protein-ligand or protein-protein complex formation. Suitable for fragments, peptides, or small molecules.
- Advantage: Offers a fast, label-free alternative to surface plasmon resonance (SPR) or isothermal titration calorimetry (ITC) for primary screening, using orders of magnitude less protein.
Detailed Experimental Protocols
Protocol 1: High-Throughput Thermal Stability Screen
Objective: To determine the apparent melting temperature (Tm) of a protein across 96 different buffer conditions.
Materials:
- DLS-capable microplate reader (e.g., Wyatt Technology's DynaPro Plate Reader, Malvern Panalytical's Plate Reader Plus).
- Black 384-well plate with optically clear bottom.
- Pre-formulated buffer solutions in a source plate.
- Target protein stock solution.
Procedure:
- Sample Preparation: Using a liquid handler, transfer 5 µL of each buffer condition into the assay plate. Add 5 µL of protein stock to each well for a final volume of 10 µL (final protein concentration ~1 mg/mL). Centrifuge plate at 1000 x g for 1 minute to remove bubbles.
- Instrument Setup: Load method. Set temperature gradient from 25°C to 80°C with a ramp rate of 0.5°C/minute. Define DLS measurement at each 1°C interval (3 acquisitions of 5 seconds each per well).
- Data Acquisition: Start the run. The instrument automatically moves from well to well, measuring Rh and PdI at each temperature step.
- Analysis: Use instrument software to plot Rh vs. Temperature. The Tm is identified as the inflection point where Rh increases sharply due to unfolding/aggregation. Data is exported as a 96-well Tm heat map.
Protocol 2: Aggregation Kinetics Under Mechanical Stress
Objective: To quantify the rate of sub-visible particle formation induced by orbital shaking.
Materials:
- DLS plate reader with in-situ shaking capability.
- 96-well half-area microplate.
- Protein formulation(s) of interest.
- Sealing tape.
Procedure:
- Plate Setup: Pipette 30 µL of protein sample into desired wells. Seal plate securely with optically clear tape.
- Method Programming: Create a kinetic loop: a) DLS measurement (10 acquisitions of 3 seconds), b) Orbital shake at 800 rpm for 2 minutes. Repeat loop for 50 cycles (~4 hours total).
- Run: Execute the method. The instrument alternately measures and stresses the samples.
- Analysis: Plot the "% Intensity from >100nm species" parameter vs. time for each well. Calculate the aggregation rate constant from the initial linear slope.
Visualizations
Diagram Title: High-Throughput Thermal Stability Screening Workflow
Diagram Title: Protein Aggregation Pathway Under Stress
The Scientist's Toolkit
Table 2: Essential Research Reagent Solutions for DLS Plate Reader Screening
| Item | Function & Rationale |
|---|---|
| Low-Volume 384-Well Plates | Optically clear, flat-bottom plates designed for 2-10 µL measurements. Minimize sample consumption and meniscus effects on the laser beam. |
| Pre-Formulated Buffer Libraries | Commercially available sets of buffers spanning a range of pH, ionic strength, and common excipients. Enable systematic screening of solution conditions. |
| Non-Fluorescent Sealing Films | Prevent evaporation during long thermal ramps or kinetic runs without interfering with the incident laser or scattered light signal. |
| High-Purity Water (HPLC Grade) | Essential for preparing buffers and dilutions. Contaminating particles can cause significant background noise in DLS measurements. |
| Protein Standard (e.g., BSA) | A monodisperse protein of known size (Rh ~3.5 nm for BSA). Used for daily instrument validation and performance qualification. |
| Liquid Handling Robotics | Automated pipetting systems (e.g., Beckman Coulter Biomek) ensure precise, reproducible sample dispensing at microliter volumes across entire plates. |
DLS Plate Reader Protocols: Step-by-Step Methods for Protein Stability and Aggregation Screening
Optimized Sample Preparation for 96-Well and 384-Well Plate Formats
Within the context of a high-throughput protein screening research thesis utilizing a Dynamic Light Scattering (DLS) plate reader, optimized sample preparation is paramount. This protocol details methodologies for preparing protein samples in 96-well and 384-well microplate formats, ensuring data reproducibility, minimizing sample waste, and maximizing throughput for biophysical characterization, including aggregation propensity, size distribution, and stability studies.
Key Research Reagent Solutions
| Item | Function in DLS Sample Prep |
|---|---|
| Ultra-Low Protein Binding Plates | Minimizes nonspecific adsorption of protein to well walls, critical for low-concentration samples. |
| Pre-Filtered, Particle-Free Buffers | Reduces background scattering from particulate contaminants in buffer salts and excipients. |
| Non-Detergent Sulfobetaine (NDSB) Additives | Enhances protein solubility and stability without interfering with DLS measurements. |
| Precision Sealing Films (Optically Clear) | Prevents evaporation during measurement; must be compatible with plate reader optics. |
| Automated Liquid Handlers (e.g., Positive Displacement) | Ensues precise, reproducible dispensing of low-volume (2-20 µL) samples in 384-well format. |
| Microplate Centrifuge with Plate Rotors | Removes air bubbles post-dispensing, which are catastrophic for DLS measurements. |
| In-line 0.1 µm or 0.02 µm Syringe Filters | For final buffer filtration immediately prior to plate filling to eliminate dust. |
| Validated Protein Standards (e.g., BSA, Lysozyme) | For routine calibration and quality control of DLS plate reader performance. |
Quantitative Comparison: 96-Well vs. 384-Well Format
| Parameter | 96-Well Format | 384-Well Format | Considerations for DLS |
|---|---|---|---|
| Typical Working Volume | 50 - 200 µL | 10 - 50 µL | Minimum volume must cover detector path; check instrument spec. |
| Protein Sample Required (per condition) | 100 - 400 µL | 20 - 100 µL | 384-well enables 4x more conditions with same sample stock. |
| Plate Footprint | ~128 mm x 86 mm | ~128 mm x 86 mm | Same footprint increases labware density. |
| Recommended Well Type | Round Bottom | Round Bottom | Promotes consistent meniscus, reduces optical artifacts. |
| Evaporation Risk | Lower | Higher (due to SA:V) | Sealing is critical for 384-well. |
| Liquid Handling Complexity | Moderate (manual possible) | High (automation recommended) | Pipetting errors have magnified impact in low volumes. |
| Typical Throughput (Samples/Day) | 96 - 288 | 384 - 1,536 | Maximizes DLS plate reader utility. |
Core Experimental Protocols
Protocol 1: Buffer Preparation and Filtration for DLS
Objective: Prepare particle-free buffer to minimize background signal.
- Prepare the desired buffer (e.g., PBS, Tris-HCl, Histidine) using high-purity reagents and Milli-Q water (18.2 MΩ·cm).
- Filter the entire buffer volume through a 0.1 µm (or 0.02 µm for sub-10 nm proteins) bottle-top vacuum filter into a clean, dedicated glass flask.
- Aliquot filtered buffer into single-use, sterile tubes to avoid repeated openings.
- Store at 4°C for up to 2 weeks. Centrifuge at 16,000 x g for 10 min immediately before plate filling.
Protocol 2: Protein Sample Preparation and Plate Loading (384-Well)
Objective: Prepare a gradient of protein concentration or formulation in a 384-well plate. Materials: Filtered buffer, protein stock, automated liquid handler, low-binding 384-well round-bottom plate, optical sealing film, plate centrifuge.
- Dilution Series: In a separate low-binding V-bottom plate, prepare a 2x serial dilution of protein in filtered buffer. Final volume per dilution: 60 µL.
- Plate Loading: Using a positive-displacement automated liquid handler, transfer 25 µL of each dilution into 4 replicate wells of the 384-well assay plate (Columns 1-4 for dilution 1, etc.).
- Buffer Controls: In designated wells (e.g., last column), dispense 25 µL of filtered buffer only (no protein).
- Sealing: Apply an optically clear, adhesive sealing film using a roller to ensure uniform, bubble-free adhesion.
- Centrifugation: Centrifuge the sealed plate at 500 x g for 2 minutes at 4°C to pull liquid to well bottom and remove microbubbles.
- Equilibration: Allow plate to equilibrate to DLS plate reader temperature (e.g., 20°C) for 15 minutes before measurement.
Protocol 3: DLS Plate Reader Quality Control Procedure
Objective: Validate system performance prior to sample run.
- Buffer Baseline: Measure 5 buffer-only wells. The measured hydrodynamic radius (Rh) should be < 1 nm and intensity (kcps) low and consistent (< 5% CV).
- Standard Measurement: Measure a well containing a monodisperse protein standard (e.g., BSA at 1 mg/mL in filtered PBS). The reported Rh should be within 10% of the known value (e.g., ~3.5 nm for BSA).
- Plate Homogeneity Check: Perform a single-measurement scan across the entire plate in buffer wells. The intensity CV should be < 8%.
Visualized Workflows and Pathways
Title: High-Throughput DLS Sample Prep Workflow
Title: DLS Plate Reader QC Decision Tree
Standard Operating Procedure (SOP) for High-Throughput Thermal Stability Assays
Within the context of high-throughput protein screening for drug discovery and biophysical characterization, thermal stability assays are a cornerstone technique. The integration of Dynamic Light Scattering (DLS) plate reader technology enables the simultaneous, label-free assessment of protein aggregation, melting temperature (Tm), and size distribution across 96- or 384-well plates. This SOP outlines a standardized protocol for conducting high-throughput thermal stability assays using a DLS plate reader, providing a robust method for screening buffer conditions, ligand binding, and protein construct stability.
Key Research Reagent Solutions
| Item | Function |
|---|---|
| DLS-Compatible Microplate | Black, clear-bottom, low-evaporation 96- or 384-well plates designed to minimize background scattering and meniscus effects. |
| Protein Purification Buffer | Standard buffer (e.g., 20 mM HEPES, 150 mM NaCl, pH 7.5) for protein storage and baseline measurements. |
| Ligand/Compound Library | Small molecules, nucleotides, or other binding partners screened for stabilizing/destabilizing effects. |
| Fluorescent Dye (Optional) | SYPRO Orange or similar environmentally sensitive dye for complementary differential scanning fluorimetry (DSF) validation. |
| Sealing Film | Optically clear, adhesive seal to prevent evaporation during thermal ramping. |
Experimental Protocol
Sample Preparation
- Protein Buffer Exchange: Dialyze or desalt the target protein into a standard, low-particle buffer. Centrifuge at 15,000 x g for 10 minutes at 4°C to remove aggregates.
- Plate Setup: In a DLS-compatible plate, prepare 50 µL samples per well. Include:
- Test Samples: Protein (0.5-2 mg/mL) in screening buffers or with ligands (typically 10-100 µM final concentration).
- Reference Control: Protein in standard buffer alone.
- Buffer Blank: Buffer only for background subtraction.
- Sealing: Apply an optically clear sealing film carefully to avoid bubbles.
DLS Plate Reader Configuration & Run
- Instrument Calibration: Perform daily calibration using a standard of known size and low polydispersity (e.g., 100 nm polystyrene beads).
- Parameter Setup:
- Temperature Ramp: Define a gradient from 20°C to 80°C (or higher). A standard ramp rate is 0.5°C/min.
- Measurement Interval: Set DLS acquisitions at every 1°C increment.
- Acquisition Time: 3-5 measurements per well per temperature point, with each measurement being 3-10 seconds.
- Laser Power/Auto-attenuation: Set to achieve an optimal scattering intensity (KCps) for the protein concentration.
- Run Initiation: Load plate, start the thermal melt protocol, and monitor initial time points for sample integrity.
Data Analysis
- Background Subtraction: Subtract the scattering intensity and size profile of the buffer blank from all sample wells.
- Tm Determination: Plot the aggregation count rate or hydrodynamic radius (Rh) vs. temperature. The Tm is identified as the inflection point (first derivative peak) where irreversible aggregation begins.
- ΔTm Calculation: For ligand screening, calculate ΔTm (Tm(ligand) - Tm(apo)) for each condition. A positive ΔTm indicates a stabilizing interaction.
Table 1: Representative Thermal Stability Screening Data for Model Protein (Protein X, 1 mg/mL)
| Condition | Tm (°C) | ΔTm (°C) | Rh at 25°C (nm) | Onset Temp of Aggregation (°C) | Interpretation |
|---|---|---|---|---|---|
| Reference Buffer | 52.1 ± 0.3 | - | 4.2 ± 0.2 | 49.5 | Baseline stability |
| + 1% DMSO (Vehicle) | 51.8 ± 0.4 | -0.3 | 4.3 ± 0.3 | 49.1 | No vehicle effect |
| + Ligand A (10 µM) | 56.4 ± 0.2 | +4.3 | 4.1 ± 0.1 | 53.8 | Strong stabilizer |
| + Ligand B (100 µM) | 50.2 ± 0.5 | -1.9 | 4.8 ± 0.4 | 47.5 | Destabilizer/aggregator |
| Buffer pH 6.0 | 48.7 ± 0.6 | -3.4 | 4.2 ± 0.2 | 46.0 | Sub-optimal pH |
Table 2: Key DLS Plate Reader Instrument Parameters for Assay
| Parameter | Typical Setting | Purpose/Rationale |
|---|---|---|
| Protein Concentration | 0.5 - 2 mg/mL | Optimizes signal-to-noise; avoids intermolecular interference. |
| Sample Volume | 50 µL (96-well) | Ensures proper meniscus and laser path alignment. |
| Temperature Ramp Rate | 0.5 °C / min | Allows for quasi-equilibrium measurements; standard for DSF. |
| DLS Measurement per Temp | 3-5 acquisitions | Provides statistical robustness for Rh calculation. |
| Data Quality Threshold | PDI < 0.7 | Filters out samples with high polydispersity at starting temp. |
Workflow and Pathway Visualizations
Title: High-Throughput Thermal Shift Assay Workflow
Title: Protein Thermal Denaturation & Ligand Stabilization
Screening for Aggregation Propensity Under Stress Conditions (pH, Ionic Strength)
Within the broader thesis on high-throughput protein screening using a DLS plate reader, assessing aggregation propensity under stress conditions is a critical analytical step in early-stage biotherapeutic development. This application note details protocols for high-throughput screening of protein formulations under varied pH and ionic strength stresses, enabling rapid identification of stable candidate formulations and degradation pathways.
The Scientist's Toolkit: Essential Research Reagent Solutions
| Item | Function/Brief Explanation |
|---|---|
| DLS-Enabled Microplate Reader | Instrument capable of dynamic light scattering measurements in a multi-well plate format for high-throughput size analysis. |
| UV-Transparent, Low-Volume 384-Well Plates | Plates with minimal protein adsorption, suitable for DLS measurements and enabling screening with limited sample volumes. |
| Protein Purification Kit | For buffer exchange into a defined starting buffer (e.g., histidine, succinate) to ensure consistent initial conditions. |
| Concentrated Buffer Stock Solutions | For precise, high-throughput pH adjustment across a matrix (e.g., pH 3.0-8.0). Common buffers: citrate, phosphate, histidine. |
| Concentrated Salt Stock Solutions | For creating ionic strength gradients (e.g., 0-500 mM NaCl) while maintaining target pH. |
| Fluorescent Dye (e.g., Thioflavin T, SYPRO Orange) | For complementary, orthogonal detection of amyloid fibrils or non-native aggregates via fluorescence. |
| Automated Liquid Handling System | Enables rapid and precise dispensing of protein, buffers, and salts to construct complex stress condition matrices. |
| Data Analysis Software (HT-DLS & Stability Index) | Software for automated processing of DLS correlation functions, polydispersity index (PdI) calculation, and aggregation kinetics. |
Table 1: Representative Aggregation Data for Monoclonal Antibody X under pH Stress
| pH Condition | Initial Z-Avg (d.nm) | Z-Avg after 24h at 40°C (d.nm) | Polydispersity Index (PdI) after 24h | Stability Index (SI)* |
|---|---|---|---|---|
| 5.0 | 10.2 | 10.5 | 0.05 | 0.99 |
| 5.5 | 9.8 | 11.0 | 0.08 | 0.95 |
| 6.0 | 10.1 | 10.8 | 0.06 | 0.97 |
| 6.5 | 9.9 | 250.5 | 0.45 | 0.15 |
| 7.0 | 10.3 | >1000 | 0.80 | 0.02 |
*SI = (Initial Intensity / Final Intensity) or similar metric; lower indicates more aggregation.
Table 2: Aggregation Propensity under Combined pH and Ionic Strength Stress
| Condition (pH / [NaCl]) | Time to >50nm Aggregates (hours) | Dominant Aggregate Size (nm) at Endpoint |
|---|---|---|
| 5.0 / 0 mM | >48 | 12 |
| 5.0 / 150 mM | >48 | 11 |
| 5.0 / 500 mM | 36 | 85 |
| 6.5 / 0 mM | 24 | 320 |
| 6.5 / 150 mM | 8 | >1000 |
| 6.5 / 500 mM | 4 | >1000 |
Experimental Protocols
Protocol 1: High-Throughput Sample Preparation for pH/Ionic Strength Matrix
Objective: Prepare a matrix of protein samples across a range of pH and ionic strength conditions in a 384-well plate.
- Protein Solution: Dialyze or buffer-exchange the target protein into a low-ionic strength buffer (e.g., 10 mM histidine, pH 6.0). Concentrate to 2x the desired final screening concentration (typically 1-2 mg/mL).
- Buffer/Salt Stocks: Prepare 10x concentrated buffer stocks spanning target pH range (e.g., pH 4.0, 5.0, 6.0, 7.0, 8.0). Prepare 5M NaCl stock.
- Plate Setup: Using an automated liquid handler, dispense 10 µL of the appropriate 10x buffer stock into each well of a 384-well plate according to the planned matrix.
- Ionic Strength Adjustment: Add calculated volumes of 5M NaCl and DI water to each well to achieve the final target ionic strength (e.g., 0, 50, 150, 500 mM NaCl) in a total volume of 45 µL.
- Protein Addition: Add 5 µL of the 2x protein solution to each well, achieving final desired protein concentration and 1x buffer concentration. Seal plate and mix by gentle centrifugation.
- Initial Measurement: Immediately load plate into DLS reader for t=0 measurement.
Protocol 2: DLS Plate Reader Measurement for Aggregation Kinetics
Objective: Monitor the change in hydrodynamic radius (Z-Average) and PdI over time under stress.
- Instrument Calibration: Perform calibration using a standard latex bead of known size according to manufacturer instructions.
- Method Setup: Configure the plate reader method:
- Temperature: Set to stress condition (e.g., 40°C) and allow plate to equilibrate for 5 minutes.
- Measurement Parameters: Set number of acquisitions per well (e.g., 5-10), acquisition duration (e.g., 3-5 seconds), and automatic attenuation adjustment.
- Scan Pattern: Define pattern to measure all sample wells.
- Kinetic Loop: Set repeated measurements at defined intervals (e.g., every 30 minutes for 24-48 hours).
- Data Acquisition: Start the kinetic run. Software will automatically collect correlation functions.
- Data Processing: Use integrated software to analyze correlation functions, calculate Z-Average (d.nm) and PdI for each well at each time point. Export data for further analysis.
Protocol 3: Data Analysis and Stability Index Calculation
Objective: Derive a quantitative Stability Index (SI) to rank formulation conditions.
- Data Triangulation: For each well, plot Z-Average and PdI versus time.
- Identify Aggregation Onset: Determine the time point (T-onset) where Z-Average increases >20% from baseline and PdI exceeds 0.2.
- Calculate Stability Index (SI): A common metric is:
SI = (Scattering Intensity at t=0) / (Scattering Intensity at t-final). Alternatively, useSI = 1 / (Z-Avg at t-final - Z-Avg at t=0). Normalize SI values from 0 (complete aggregation) to 1 (no aggregation). - Generate Heat Maps: Plot SI values or T-onset times in a matrix (pH vs. Ionic Strength) to identify stable regions.
Visualized Workflows and Relationships
Diagram Title: High-Throughput DLS Screening Workflow
Diagram Title: Stress-Induced Aggregation Pathway to DLS Signal
Within the broader thesis on utilizing Dynamic Light Scattering (DLS) plate readers for high-throughput protein screening, formulation screening represents a critical, early-stage analytical bottleneck. The stability of biotherapeutic proteins (e.g., monoclonal antibodies, enzymes, vaccines) is profoundly influenced by their formulation environment. Incompatible excipients or suboptimal buffer conditions can induce aggregation, fragmentation, or chemical degradation, compromising therapeutic efficacy and safety. A high-throughput DLS plate reader enables rapid, parallel assessment of protein colloidal stability (hydrodynamic radius, aggregation propensity) across hundreds of formulation conditions in a 96- or 384-well plate format. This application note details integrated protocols for excipient and buffer compatibility studies, leveraging the DLS plate reader to de-risk formulation development and accelerate the identification of stable lead formulations.
Key Research Reagent Solutions & Essential Materials
Table 1: Scientist's Toolkit for Formulation Screening Studies
| Item | Function & Relevance |
|---|---|
| High-Throughput DLS Plate Reader | Instrument capable of performing automated, temperature-controlled DLS measurements in standard microplate formats. Provides intensity-based size distribution and aggregation index. |
| UV-Transparent Microplates (e.g., 96-well, 384-well) | Plates with optical-quality bottoms for DLS and simultaneous Static Light Scattering (SLS) or fluorescence detection. Essential for minimizing background scattering. |
| Protein of Interest (POI) | The therapeutic protein (e.g., mAb at 1-10 mg/mL) in a starting buffer. Should be of high purity to minimize interference from contaminants. |
| Excipient Library | A curated collection of buffers, sugars (sucrose, trehalose), surfactants (PS80, PS20), amino acids (arginine, histidine), salts, and antioxidants. Often prepared as concentrated stock solutions. |
| Liquid Handling Robot | Enables precise, rapid, and reproducible dispensing of protein and excipient solutions for plate setup, crucial for high-throughput screening. |
| Microplate Centrifuge | For gentle degassing of plates post-dispensing to remove air bubbles, which are major artifacts in DLS measurements. |
| Plate Seals | Optically clear, adhesive seals to prevent evaporation and contamination during long-term stability studies. |
| Reference Standards | Latex/nanosphere size standards (e.g., 5 nm, 100 nm) for periodic instrument validation and performance qualification. |
Experimental Protocols
Protocol 3.1: High-Throughput Excipient Compatibility Screening
Objective: To rapidly identify excipients that minimize protein aggregation and maintain native hydrodynamic radius across a broad matrix of conditions.
Materials: POI stock, excipient library stocks, UV-transparent 96-well plate, DLS plate reader, liquid handler.
Procedure:
- Plate Design: Map the microplate. Reserve columns 1-2 for controls: buffer blanks (negative control) and stressed protein (positive aggregation control). Use remaining wells for test formulations.
- Formulation Preparation: Using a liquid handler, first dispense calculated volumes of excipient stock solutions into wells to achieve desired final concentrations (e.g., 10 mM buffers, 0.01% surfactants, 250 mM sugars).
- Protein Dispensing: Dilute the POI stock into each well to achieve the target protein concentration (typically 1 mg/mL for screening). Mix gently via plate shaking.
- Plate Preparation: Centrifuge the plate at 1000 x g for 5 minutes to remove air bubbles. Seal with an optically clear film.
- DLS Measurement: Load plate into the DLS reader pre-equilibrated at 25°C. Program the reader to measure each well with an appropriate number of reads (e.g., 5-10 reads of 5 seconds each).
- Data Acquisition: Record the Z-Average hydrodynamic diameter (d.nm), the polydispersity index (PdI) or %Polydispersity, and the aggregation percentage (derived from the intensity size distribution).
- Analysis: Compare results against controls. Identify formulations yielding a monomodal peak near the expected size, low PdI (<0.2), and minimal aggregation.
Protocol 3.2: Buffer pH & Ionic Strength Profiling
Objective: Systematically evaluate the impact of pH and ionic strength on protein colloidal stability.
Materials: POI stock, buffer series (e.g., citrate, phosphate, histidine, acetate across pH 4.0-8.0), salt solutions (NaCl), DLS plate reader.
Procedure:
- Buffer Preparation: Prepare a matrix of buffers covering a pH range (e.g., 4.0, 5.0, 5.5, 6.0, 6.5, 7.0, 7.5, 8.0) at two ionic strengths (e.g., 15 mM and 150 mM, adjusted with NaCl).
- Plate Setup: Dispense buffers into a 96-well plate. Use one row per pH condition.
- Protein Addition: Add POI to each well to a final concentration of 2 mg/mL. Include buffer-only blanks.
- Incubation & Measurement: Seal plate, incubate at 40°C for 24-48 hours in the plate reader chamber (accelerated stability study). Perform DLS measurements at T=0, 24h, and 48h.
- Stability Metric: Calculate the "Stability Score" or "Aggregation Onset Time" based on the increase in Z-Average or aggregation percentage over time.
Data Presentation & Analysis
Table 2: Exemplar Data from High-Throughput Excipient Screen (T=0, 25°C)
| Formulation # | Buffer | Additive 1 | Additive 2 | Z-Avg (d.nm) | PdI | % Aggregates | Notes |
|---|---|---|---|---|---|---|---|
| F1 | Histidine, pH 6.0 | 250 mM Sucrose | 0.02% PS80 | 10.2 | 0.05 | 0.2 | Optimal |
| F2 | Phosphate, pH 7.4 | - | 0.01% PS20 | 10.5 | 0.08 | 0.5 | Acceptable |
| F3 | Acetate, pH 5.0 | - | - | 11.1 | 0.25 | 5.8 | Unstable |
| F4 | Citrate, pH 5.5 | 150 mM Arg-HCl | - | 10.8 | 0.15 | 1.2 | Acceptable |
| Control (Buffer) | Histidine, pH 6.0 | - | - | - | - | - | Baseline |
| Control (Stressed) | - | - | - | 152.5 | 0.45 | 35.0 | Aggregated |
Table 3: Buffer pH/Ionic Strength Stability Summary (After 48h at 40°C)
| pH | Ionic Strength (mM) | Z-Avg Initial (nm) | Z-Avg Final (nm) | Δ Aggregation (%) | Stability Rank |
|---|---|---|---|---|---|
| 5.0 | 15 | 10.5 | 12.8 | +8.5 | Low |
| 5.0 | 150 | 10.6 | 45.2 | +32.1 | Very Low |
| 6.0 | 15 | 10.2 | 10.3 | +0.3 | High |
| 6.0 | 150 | 10.3 | 10.5 | +0.5 | High |
| 7.4 | 15 | 10.4 | 11.0 | +2.1 | Medium |
| 7.4 | 150 | 10.5 | 15.2 | +12.5 | Low |
Workflow & Pathway Visualizations
Diagram 1: HTS Formulation Screening Workflow
Diagram 2: Aggregation Pathway & Excipient Action
Within the broader thesis on employing Dynamic Light Scattering (DLS) plate readers for high-throughput protein screening in drug development, this document details the critical data analysis workflow for interpreting size distributions and aggregation kinetics. This protocol enables researchers to rapidly assess protein stability, identify optimal formulation conditions, and screen for aggregation-prone candidates early in the biotherapeutic pipeline.
Experimental Protocols
High-Throughput DLS Measurement Protocol
Objective: To simultaneously measure the hydrodynamic size distribution and monitor aggregation kinetics of up to 384 protein samples under varying conditions (pH, ionic strength, temperature, excipients).
Materials:
- DLS-enabled microplate reader (e.g., Wyatt Technology's DynaPro Plate Reader, Malvern Panalytical's Spectris).
- 384-well glass-bottom or low-volume, non-binding microplates.
- Purified protein samples (>0.5 mg/mL).
- Formulation buffers (varied as per experimental design).
- Centrifuge with plate adapters.
- Adhesive plate seals.
Procedure:
- Plate Preparation: Prepare formulation buffers in a master block. Dilute protein stock solutions into each buffer to achieve final desired concentration. Dispense 40-50 µL of each sample into designated wells of the 384-well plate. Include buffer-only controls for baseline correction.
- Plate Clearing: Centrifuge the sealed plate at 1000 × g for 5 minutes to remove air bubbles and settle particulates.
- Instrument Calibration: Perform a daily calibration using a standard of known size and low polydispersity (e.g., 100 nm polystyrene nanospheres).
- Method Setup: In the instrument software, define the plate map, assigning sample identities and experimental groups. Set measurement parameters:
- Temperature: Set to desired stability study temperature (e.g., 25°C or 40°C).
- Number of Reads: 10-20 acquisitions per well.
- Acquisition Duration: 3-10 seconds per read.
- Kinetic Interval: For aggregation time courses, set repeated measurements at defined intervals (e.g., every 5 minutes for 2 hours).
- Data Acquisition: Initiate the automated run. The system will scan each well, collecting autocorrelation functions.
- Initial Processing: Software processes autocorrelation data to generate intensity-weighted size distributions for each well at each time point.
Data Analysis Protocol for Aggregation Kinetics
Objective: To extract kinetic parameters from time-resolved DLS data to quantify aggregation rates.
Procedure:
- Data Export: Export the primary metric for aggregation (e.g., mean or mode of intensity-weighted size distribution, or % intensity > 100 nm) over time for each well into a
.csvfile. - Data Conditioning (in Python/R):
- Subtract the average value of buffer control wells from sample data.
- Normalize size or intensity data to the initial time point (t=0).
- Kinetic Modeling: Fit the normalized aggregation metric (Y(t)) to appropriate models.
- Lag-Time Model (for nucleated aggregation): Fit to a sigmoidal function (e.g.,
Y(t) = Y_min + (Y_max - Y_min) / (1 + exp(-k*(t - t_lag)))wheret_lagis the lag time andkis the apparent growth rate). - Exponential Growth Model: Fit to
Y(t) = Y0 * exp(k*t).
- Lag-Time Model (for nucleated aggregation): Fit to a sigmoidal function (e.g.,
- Parameter Extraction: Extract fitted parameters (lag time, rate constant
k, half-timet_1/2, plateau value) for each sample condition. - Comparative Analysis: Plot extracted parameters (e.g., lag time vs. excipient concentration) to identify stabilizing/destabilizing conditions.
Table 1: Aggregation Kinetic Parameters for Monoclonal Antibody (mAb-A) Under Stress (40°C)
| Formulation Condition | Lag Time (minutes) | Apparent Rate Constant, k (min⁻¹) | Time to 50% Aggregation, t₁/₂ (min) | Final Aggregate Z-Average (nm) |
|---|---|---|---|---|
| pH 5.0, 50 mM NaCl | 45.2 ± 3.1 | 0.12 ± 0.02 | 88.5 ± 4.2 | 420 ± 35 |
| pH 5.0, 150 mM NaCl | 22.5 ± 1.8 | 0.25 ± 0.03 | 55.1 ± 3.0 | 580 ± 50 |
| pH 6.5, 50 mM NaCl | 120.5 ± 10.5 | 0.05 ± 0.01 | 205.3 ± 15.1 | 280 ± 20 |
| pH 6.5, 150 mM NaCl | 85.3 ± 6.7 | 0.08 ± 0.01 | 145.6 ± 9.8 | 350 ± 30 |
| Buffer Control | N/A | N/A | N/A | 10 ± 2 |
Table 2: High-Throughput Screening Summary (Top 5 Stabilizers for mAb-B)
| Excipient (0.1 M) | Initial Z-Avg (nm) | Polydispersity Index (PDI) | Size Increase after 24h at 25°C (%) | Aggregation Score (1=Best) |
|---|---|---|---|---|
| Sucrose | 10.5 ± 0.3 | 0.05 ± 0.01 | 2.5 | 1 |
| L-Arginine HCl | 11.0 ± 0.4 | 0.06 ± 0.02 | 5.1 | 2 |
| Sorbitol | 10.8 ± 0.3 | 0.05 ± 0.01 | 7.3 | 3 |
| Sodium Citrate | 12.1 ± 0.5 | 0.08 ± 0.02 | 10.2 | 4 |
| Glycine | 11.5 ± 0.4 | 0.07 ± 0.01 | 12.5 | 5 |
| No Excipient (Ref) | 12.5 ± 0.6 | 0.10 ± 0.03 | 65.0 | N/A |
Visualizations
DLS Plate Reader Data Analysis Workflow
Protein Aggregation Kinetic Pathways
The Scientist's Toolkit: Research Reagent Solutions
Table 3: Essential Materials for DLS-based Protein Screening
| Item | Function/Benefit | Key Considerations |
|---|---|---|
| DLS-Enabled Microplate Reader | Enables simultaneous, automated DLS measurement of up to 384 samples. Critical for throughput. | Ensure temperature control precision (±0.1°C) and ability to measure low volumes (≥20 µL). |
| Non-Binding, Glass-Bottom Plates | Minimizes protein adsorption to well surfaces, reducing artifacts in size measurement. | Opt for black plates to reduce cross-talk in fluorescence-enabled systems. |
| Size Calibration Standards | Polystyrene or silica nanospheres of known, monodisperse size. Essential for instrument validation. | Use standards close to the expected size of your protein monomers (e.g., 10 nm). |
| Formulation Buffer Library | A pre-prepared set of buffers covering a range of pH, ionic strength, and common excipients. | Enables systematic screening of physicochemical stability. |
| Liquid Handling Robot | Automates plate preparation for complex screening campaigns, improving reproducibility and speed. | Must handle viscous excipient solutions and protein samples without inducing shear stress. |
| Data Analysis Software (Custom Scripts) | Python/R scripts for batch processing of kinetic data, model fitting, and parameter extraction. | Enables consistent, automated analysis of hundreds of datasets from a single plate run. |
| Protein Stabilizers (e.g., Sucrose, Arginine) | Common excipients used to probe and mitigate protein aggregation via preferential exclusion or direct interaction. | Screen at multiple concentrations to identify optimal conditions. |
Optimizing DLS Plate Reader Results: Troubleshooting Common Issues and Best Practices
Within the high-throughput protein screening research enabled by Dynamic Light Scattering (DLS) plate readers, data integrity is paramount. Artifacts such as dust particulates, microbubbles, and solvent evaporation in multi-well plates are major sources of error, corrupting hydrodynamic radius (Rh) measurements and leading to false positives or negatives in aggregation and stability assays. This application note provides protocols and solutions to mitigate these prevalent issues, ensuring robust, publication-quality data.
Artifact Characterization and Impact on DLS Data
DLS plate readers measure fluctuations in scattered light intensity from particles undergoing Brownian motion. Artifacts introduce non-proteinaceous signals that distort autocorrelation functions and derived size distributions.
Table 1: Common Artifacts and Their Quantitative Impact on DLS Measurements
| Artifact Type | Typical Size Range | Effect on Autocorrelation Function | Impact on Reported Rh (Example) | Common Location in Well |
|---|---|---|---|---|
| Dust Particles | 1 - 100+ µm | Introduces slow-decay components, skews distribution to larger sizes. | Can inflate apparent Rh by 50-200% or create false >100 nm peaks. | Well bottom, meniscus, suspended. |
| Microbubbles | 0.5 - 10 µm | Causes erratic, high-intensity spikes; corrupts decay analysis. | Can appear as dominant population in 100 nm - 1 µm range. | Near walls, bottom, or throughout volume. |
| Evaporation Effects | N/A | Increases protein concentration, changes viscosity, alters baseline. | Can cause time-dependent Rh decrease (5-15%) due to conc. increase. | Meniscus, well edges. |
| Condensation on Lid | Droplets > 100 µm | Creates large, sporadic scattering events during plate movement. | Massive false peaks; obscures true sample signal. | Underside of plate seal/lid. |
Experimental Protocols
Protocol 3.1: Pre-Measurement Plate Preparation and Cleaning
Objective: Minimize dust and particle contamination prior to sample loading. Materials: Filtered (0.22 µm) solvent (e.g., buffer), non-linting wipes, compressed air or nitrogen duster, clean laminar flow hood. Procedure:
- Perform all steps in a laminar flow hood or controlled, low-particle environment.
- Blow out each well of the new or reused multi-well plate using a stream of filtered, compressed air or nitrogen gas, held at a 45-degree angle.
- Rinse each well with 200 µL of filtered buffer (or the solvent to be used in the assay). Immediately aspirate completely. Repeat once.
- Invert the clean plate onto a non-linting, low-residue wipe to dry.
- Store the prepared plate in a closed container until use.
Protocol 3.2: Bubble-Free Sample Loading for DLS
Objective: Introduce protein samples without generating microbubbles. Materials: Low-retention, filtered pipette tips, positive displacement pipette (recommended for viscous solutions), plate shaker. Procedure:
- Centrifuge all sample vials briefly (e.g., 30 sec at 2000 x g) to pull liquid to the bottom.
- Set pipette to slow and smooth aspiration speed. Draw sample from the mid-depth of the vial, avoiding the surface meniscus.
- Place the pipette tip against the side of the well wall, just above the intended final liquid level.
- Dispense the sample slowly and steadily down the wall. For a 100 µL sample in a 300 µL well, dispense over 3-4 seconds.
- After all samples are loaded, gently tap the plate sides or place on a low-frequency orbital shaker (200 rpm) for 10 seconds to dislodge any adherent bubbles.
- Visually inspect each well at an angle against a dark background. Flag wells with persistent bubbles.
Protocol 3.3: Evaporation Control During Long-Term Stability Scans
Objective: Maintain constant sample concentration and meniscus shape over hours/days. Materials: Optically clear, adhesive plate seals, plate sealing roller, humidity chamber or controlled-environment plate reader. Procedure:
- After bubble-free loading, gently wipe the top rim of the plate with a clean, dry lint-free wipe to remove any droplets.
- Carefully apply an optically clear, non-permeable adhesive seal. Avoid touching the adhesive center.
- Use a sealing roller to apply firm, even pressure across the entire seal, ensuring a complete bond around each well rim.
- For experiments >4 hours, consider adding a humidity reservoir. Place a dampened, lint-free sponge in an unused well sector or use a plate reader with active humidity control (maintained at >80%).
- Validate evaporation control by measuring the same stable control sample in edge and center wells at time=0 and time=24h. Rh deviation should be <2%.
The Scientist's Toolkit: Research Reagent Solutions
Table 2: Essential Materials for Artifact-Free DLS Plate Assays
| Item | Function & Rationale |
|---|---|
| 0.22 µm Sterile Syringe Filters (PES membrane) | Filters buffers and solvents to remove particles >220 nm, eliminating a primary source of dust artifacts. |
| Low-Protein-Binding, Filtered Pipette Tips | Minimizes sample loss (esp. for low-conc. proteins) and prevents introduction of particulates from the tip itself. |
| Optically Clear, Adhesive Plate Seals (Non-Permeable) | Provides a physical barrier against evaporation and contamination while allowing unimpeded light passage for DLS measurement. |
| Positive Displacement Pipette System | Ideal for viscous samples or surfactants; eliminates air cushion, reducing bubble formation during aspiration/dispensing. |
| High-Purity, Low-Particulate Multi-Well Plates | Plates manufactured for light scattering assays have superior optical quality and lower intrinsic particle counts. |
| Dedicated Plate Sealing Roller | Ensures uniform, bubble-free adhesion of plate seals, preventing localized evaporation at well edges. |
| Compressed Gas Duster with 0.22 µm In-Line Filter | Allows for effective plate cleaning without introducing new contaminants from the gas source. |
Data Analysis & Artifact Identification Workflow
DLS Data QC and Artifact Mitigation Workflow
Meticulous attention to the sources and mitigation of physical artifacts is not merely a preparatory step but a critical component of experimental design in high-throughput DLS screening. Implementing the protocols and utilizing the tools described herein will significantly enhance data reliability, reduce waste of precious protein samples, and increase the success rate in identifying true hits in protein stability and drug discovery campaigns.
Dynamic Light Scattering (DLS) in a plate reader format is a transformative tool for early-stage biopharmaceutical development. Integrated into a broader thesis on high-throughput protein screening, this technology enables the rapid assessment of critical protein solution properties—such as hydrodynamic radius (Rh), polydispersity index (PdI), and aggregation state—across hundreds of conditions. The reliability of this data is fundamentally governed by three key measurement parameters: Acquisition Time, Number of Runs, and Attenuation. Misconfiguration leads to poor data quality, false positives/negatives in aggregation screening, and wasted resources. These application notes provide evidence-based protocols for optimizing these parameters to ensure robust, reproducible results suitable for decision-making in drug development pipelines.
Core Principles & Parameter Definitions
- Acquisition Time: The duration (in seconds) of a single measurement run. Longer times average over more Brownian motion events, improving signal-to-noise but increasing total experiment time.
- Number of Runs: The quantity of repeated measurements per well. Results are averaged across runs, reducing stochastic error and providing statistical confidence (e.g., mean ± standard deviation of Rh).
- Attenuation (or Laser Power/ND Filter): A setting that controls the intensity of the incident laser light reaching the sample. It is crucial for preventing detector saturation from highly scattering samples (e.g., aggregates) and maximizing signal from weakly scattering ones (e.g., monomers at low concentration).
Table 1: Impact of Measurement Parameters on DLS Data Quality
| Parameter | Too Low | Optimal Range (General Guide) | Too High | Primary Effect |
|---|---|---|---|---|
| Acquisition Time | < 5 s | 10 - 30 s (for standard proteins) | > 60 s | Accuracy & Noise: Short times increase variance. Long times offer diminishing returns and risk sample degradation during measurement. |
| Number of Runs | 1 - 3 | 5 - 15 runs | > 20 | Precision & Statistics: Few runs give poor statisics. More runs improve confidence intervals for Rh and PdI. |
| Attenuation | Saturated (e.g., < 10%) | Adjust to achieve 100-600 kcps | Too weak (e.g., > 90%) | Signal Quality: Saturation invalidates data. Weak signal yields poor correlation functions. |
Table 2: Recommended Starting Protocols for Common Sample Types
| Sample Type | Typical Conc. | Suggested Attenuation | Acquisition Time | Number of Runs | Rationale |
|---|---|---|---|---|---|
| Monoclonal Antibody (Stability Screen) | 1 mg/mL | Adjust for ~200 kcps | 15 s | 10 | Balances throughput with reliable detection of small aggregates. |
| Low-Concentration Protein | 0.1 mg/mL | Max Laser (Min Attenuation) | 20-30 s | 12-15 | Maximizes signal from weakly scattering species. |
| Polydisperse/Aggregating Sample | Varies | Start at 50%, adjust to avoid saturation | 10 s | 5-8 | Prevents saturation from large aggregates; initial fast screening. |
| Formulation Buffer Blank | N/A | Same as sample | 10 s | 3 | Essential for background subtraction; fewer runs needed. |
Detailed Experimental Protocols
Protocol 1: Systematic Optimization of Parameters for a New Protein System Objective: Determine the optimal triplet (Acquisition Time, Runs, Attenuation) for an unknown protein sample. Materials: Purified protein, formulation buffer, 384-well glass-bottom plate, DLS-capable plate reader. Procedure:
- Sample Preparation: Prepare protein at 1 mg/mL in formulation buffer. Centrifuge at 15,000 x g for 10 minutes to remove dust. Load 40 µL into 5 replicate wells.
- Attenuation Calibration:
- Set acquisition time to 10 s, runs to 3.
- Perform a scan across the attenuation range (e.g., 10%, 30%, 50%, 70%, 90%).
- Target: Identify the setting where the measured count rate is between 100-600 kilocounts per second (kcps). Record this as the optimal attenuation.
- Acquisition Time & Runs Optimization:
- Fix attenuation to the optimal value from step 2.
- Perform measurements using a matrix of conditions: Acquisition Time (5, 10, 20, 30 s) x Number of Runs (3, 5, 10, 15).
- Analyze the output for Rh and PdI. Calculate the coefficient of variation (CV%) for Rh across the 5 replicate wells for each condition.
- Selection Criteria: Choose the parameter set that yields a CV% for Rh < 5% and a PdI value with an error margin < 0.02, while minimizing total measurement time (Acquisition Time x Runs).
Protocol 2: High-Throughput Aggregation Screening of Formulations Objective: Reliably identify aggregated formulations in a 96- or 384-well plate. Materials: Protein stock, formulation excipients, plate reader. Procedure:
- Parameter Pre-Set: Using Protocol 1, establish fixed parameters for your protein. Example: Attenuation for 200 kcps, 10 s acquisition, 8 runs per well.
- Plate Setup: Dispense formulation buffers. Add protein via dilution or dispensing. Include positive (heated) and negative (stable) controls.
- Measurement: Run the pre-configured method. The plate reader automatically measures each well.
- Quality Control: Flag any well where the recorded count rate was saturated (>800 kcps) or where the correlation function fit error is above a threshold (e.g., > 1%). Re-measure flagged wells with higher attenuation or longer acquisition time.
- Analysis: Plot Z-Average (Rh) vs. PdI per formulation. Aggregated samples show increased Rh and PdI.
The Scientist's Toolkit: Essential Research Reagent Solutions
Table 3: Key Materials for High-Throughput DLS Screening
| Item | Function & Importance |
|---|---|
| Ultra-Low Volume, Glass-Bottom Microplates (e.g., 384-well) | Minimizes sample volume (≤ 40 µL). Glass bottom ensures optimal laser transmission and reduces background scattering vs. plastic. |
| Pre-Slit, Sterile, PCR-Free Plate Seals | Prevents evaporation during measurement (critical for temperature-controlled studies) without introducing dust or fibers. |
| 0.02 µm or 0.1 µm Anopore/Syringe Filters | For critical filtration of all buffers immediately before use to remove particulate contamination, the primary source of artifacts in DLS. |
| Certified DLS Size Standard (e.g., 100 nm Polystyrene Nanospheres) | Essential for daily instrument validation and performance qualification (PQ). Confirms accuracy and precision of measurement. |
| Stable, Monodisperse Protein Control (e.g., BSA or a mAb) | Used as a system suitability standard to optimize parameters and verify biological sample handling protocol integrity. |
Visualization of Workflows & Relationships
Title: DLS Parameter Optimization Workflow
Title: From Parameters to Decisions in Protein Screening
Within the context of high-throughput protein screening using a Dynamic Light Scattering (DLS) plate reader, the presence of polydisperse or aggregated samples presents a significant challenge. Accurate interpretation of data from such heterogeneous systems is critical for assessing protein stability, formulation, and drug candidate viability in early-stage development.
Challenges in DLS Data Interpretation
Polydispersity Index (PDI) values from DLS measurements provide the primary indicator of sample homogeneity. High PDI (>0.2) suggests a non-uniform population of particles, which can arise from protein aggregation, oligomerization, or the presence of contaminants.
Table 1: DLS Data Interpretation Guide for Polydisperse Samples
| PDI Range | Sample Interpretation | Recommended Action for Screening |
|---|---|---|
| 0.00 - 0.05 | Monodisperse, highly homogeneous | Proceed with high confidence. |
| 0.05 - 0.2 | Near-monodisperse, moderate homogeneity | Acceptable for screening; note variability. |
| 0.2 - 0.5 | Polydisperse, significant aggregation/heterogeneity | Flag for further analysis; consider filtering. |
| >0.5 | Highly polydisperse, heavily aggregated | Exclude from primary screen; requires remediation. |
Application Notes for DLS Plate Reader Screening
Pre-Screening Sample Preparation Protocol
Objective: Minimize artifactual aggregation prior to DLS measurement in a 384-well plate format.
Protocol:
- Buffer Exchange: Use Zeba Spin Desalting Columns (40K MWCO) to exchange protein samples into a matched, filtered (0.1 µm) formulation buffer. Centrifuge at 1,500 x g for 2 minutes.
- Centrifugation: Pre-clear all samples by centrifugation at 16,000 x g for 10 minutes at 4°C to pellet large aggregates.
- Plate Loading: Transfer the top 80% of the supernatant to a non-binding, black-walled, clear-bottom 384-well plate. Use a minimum volume of 40 µL per well.
- Plate Sealing: Seal the plate with a low-evaporation, optically clear seal.
- Equilibration: Allow the plate to equilibrate to the DLS plate reader temperature (typically 20°C or 25°C) for 15 minutes prior to measurement.
High-Throughput DLS Measurement & Deconvolution Workflow
Objective: Acquire and interpret data from polydisperse samples to distinguish oligomeric states from nonspecific aggregation.
Protocol:
- Instrument Setup: Configure the high-throughput DLS plate reader (e.g., Wyatt Technology’s DynaPro Plate Reader II) with the following settings: Laser wavelength: 829 nm; Measurement angle: 158°; Number of acquisitions: 10 per well; Acquisition duration: 3-5 seconds each.
- Data Collection: Run the plate reader software to collect autocorrelation functions for each well automatically.
- Size Distribution Analysis: Use the instrument’s software (e.g., DYNAMICS) to perform a non-negative least squares (NNLS) or CONTIN algorithm analysis on the autocorrelation data. This deconvolutes the intensity-weighted distribution of hydrodynamic radii (Rh).
- Volume/Number Distribution Transformation: Apply the Mie scattering correction to convert intensity-weighted size distributions to volume- or number-weighted distributions. This step is crucial for visualizing the true proportion of monomers vs. aggregates.
- Data Flagging: Automatically flag wells where the calculated PDI exceeds the user-defined threshold (e.g., 0.25) or where a secondary peak >10% of the main peak intensity is detected.
Table 2: Common Aggregate Signatures in DLS
| Hydrodynamic Radius (Rh) Peak | Likely Species | Implication for Protein Screen |
|---|---|---|
| 2 - 10 nm | Monomeric/ native protein | Ideal candidate. |
| Multiples of monomeric Rh (e.g., 2x, 3x) | Defined oligomer (dimer, trimer) | May be biological; requires orthogonal validation. |
| Broad peak > 100 nm | Non-specific aggregation | Likely indicative of instability; candidate for reformulation or exclusion. |
| Multiple distinct peaks | Polydisperse mixture | Sample heterogeneity; requires purification or advanced analysis. |
Advanced Data Interpretation Strategies
Integrating DLS with Orthogonal Techniques
For samples flagged as polydisperse, employ a tiered follow-up strategy:
- Size-Exclusion Chromatography coupled with MALS (SEC-MALS): Provides absolute molecular weight and confirms oligomeric state.
- Microfluidic Diffusional Sizing (MDS): Measures size distributions under native conditions, complementary to DLS.
- Negative Stain Electron Microscopy: Visualizes aggregate morphology.
Utilizing Stability Metrics in Screening
Track changes in PDI and Rh over time or under stress conditions (e.g., temperature ramp) within the plate reader. A sharp increase in PDI is a more sensitive indicator of onset of aggregation than a shift in mean Rh.
Title: DLS Plate Reader Decision Workflow for Protein Screening
Title: Protein Aggregation Pathways Under Stress
The Scientist's Toolkit: Research Reagent Solutions
Table 3: Essential Materials for High-Throughput DLS Screening
| Item | Function & Rationale |
|---|---|
| Non-Binding 384-Well Plates (e.g., Corning #3540) | Minimizes protein adsorption to well walls, preventing artifactual loss and aggregate formation. |
| Optically Clear, Low-Evaporation Seals | Prevents sample dehydration during measurement and temperature equilibration. |
| Zeba Spin Desalting Columns | Rapid buffer exchange to ensure optimal solvent conditions and remove small molecule aggregates. |
| 0.1 µm Ultrafiltration Membranes | For filtering buffers to remove particulate contaminants that interfere with DLS measurements. |
| Formulation Buffer Additives (e.g., Trehalose, Polysorbate 20) | Stabilizers to suppress protein aggregation during screening. |
| NIST-Traceable Nanosphere Size Standards (e.g., 50 nm gold nanoparticles) | For regular calibration and validation of DLS plate reader performance. |
| High-Speed Microplate Centrifuge | For pre-clearing samples immediately before loading to remove pre-existing aggregates. |
Best Practices for Sample Concentration and Buffer Selection
Within the context of high-throughput protein screening using a Dynamic Light Scattering (DLS) plate reader, proper sample preparation is paramount. Accurate determination of hydrodynamic radius, aggregation state, and overall sample quality hinges on optimizing protein concentration and selecting compatible buffers. This protocol details best practices to ensure reliable, reproducible data for drug discovery research.
Key Parameters for DLS Sample Preparation
Table 1: Recommended Protein Concentration Ranges for DLS Plate Readers
| Protein Size (kDa) | Optimal Concentration Range (mg/mL) | Minimum Volume (µL) | Key Consideration |
|---|---|---|---|
| < 20 kDa | 0.5 - 2.0 | 20 | Signal-to-noise at low end |
| 20 - 100 kDa | 0.2 - 1.0 | 20 | Balance of signal and intermolecular interactions |
| > 100 kDa | 0.1 - 0.5 | 25 | Avoids viscosity artifacts |
| Monoclonal Antibodies | 0.5 - 2.0 | 20 | Standard screening range |
| Viral Vectors/AAV | 1e12 - 1e13 vg/mL | 25 | Particle concentration critical |
Table 2: Buffer Component Effects on DLS Measurements
| Buffer Component | Typical Concentration | Impact on DLS Measurement | Recommendation |
|---|---|---|---|
| Salts (NaCl, KCl) | 50 - 200 mM | Reduces electrostatic interactions, can improve sizing accuracy. | Use consistent ionic strength; avoid >300 mM to minimize scattering background. |
| Detergents (e.g., Tween-20) | 0.01 - 0.05% v/v | Can prevent surface adsorption; micelles (~5 nm) contribute to signal. | Include in sample and reference buffer; characterize micelle size separately. |
| Reducing Agents (DTT, TCEP) | 0.5 - 5 mM | Prevents disulfide aggregation; minimal direct scattering effect. | Use fresh; TCEP is more stable for long runs. |
| Glycerol/Sucrose | 0 - 10% w/v | Increases viscosity; requires viscosity correction in software. | Keep <5% for accurate temperature control; note concentration precisely. |
| HIS/Phosphate Buffers | 10 - 50 mM | Maintains pH; low scattering background is ideal. | Filter all buffers (0.1 µm) before use to remove dust. |
| Chelators (EDTA) | 0.1 - 1 mM | Removes divalent cations that may cause aggregation. | Recommended for metalloproteins or impurity mitigation. |
Experimental Protocols
Protocol 1: Initial Sample Qualification and Concentration Scouting
Objective: Determine the optimal protein concentration for high-throughput DLS screening. Materials: Purified protein, assay buffer (filtered through 0.1 µm), 384-well DLS-compatible plate, sealing tape, DLS plate reader. Procedure:
- Prepare a 2x stock solution of the protein at the maximum concentration to be tested (e.g., 4 mg/mL).
- Perform a 1:2 serial dilution in the assay buffer across a plate row, creating a concentration range (e.g., 2, 1, 0.5, 0.25 mg/mL). Include buffer-only wells for background.
- Dispense 25 µL of each dilution into designated wells. Use a plate centrifuge at 500 x g for 1 minute to remove bubbles.
- Seal the plate with optically clear, non-destructive sealing tape.
- Load plate into the DLS reader pre-equilibrated to 25°C.
- Run measurement with settings: 5 measurements per well, 3-second acquisition each.
- Analyze the intensity autocorrelation function and derived hydrodynamic radius (Rh). The optimal concentration yields a stable, reproducible Rh with a low polydispersity index (<20%) and a sufficient scattering intensity (typically >5x buffer background).
Protocol 2: Buffer Compatibility Screening
Objective: Identify buffer conditions that minimize aggregation and maximize protein stability for screening. Materials: Protein stock, 96-well deep-well block for buffer prep, 10X buffer stock solutions, DLS plate. Procedure:
- Prepare a matrix of 8 different candidate buffers in the deep-well block (e.g., varying pH from 6.0 to 8.0, with/without 150 mM NaCl, with/without 0.01% Tween-20).
- Dilute the protein stock into each buffer condition to a final target concentration (from Protocol 1). Incubate at 4°C for 30 minutes.
- Transfer 25 µL of each sample to the DLS plate in triplicate.
- Centrifuge and seal as in Protocol 1.
- Measure using the DLS plate reader.
- Perform a thermal ramping experiment (optional but informative): ramp from 20°C to 60°C at 0.5°C/minute, measuring DLS every 2°C. The onset of aggregation increase indicates thermal instability.
- Select the buffer yielding the lowest polydispersity and most consistent Rh over time and temperature.
Visualizations
Diagram 1: High-Throughput DLS Screening Workflow
Diagram 2: Buffer Component Impact on Protein State
The Scientist's Toolkit: Research Reagent Solutions
Table 3: Essential Materials for DLS-based Protein Screening
| Item | Function & Rationale |
|---|---|
| DLS-Compatible Microplate (384-well) | Optically clear, flat-bottom plates with minimal well-to-well crosstalk, designed for low-volume (20-50 µL) measurements. |
| Non-Fluorescent, Optical Seal Tape | Prevents evaporation and contamination during measurement without interfering with the laser path or generating background signal. |
| 0.1 µm Ultrafiltration Devices | For critical buffer clarification to remove dust and particulates that are major sources of DLS artifacts. |
| Liquid Handling Robot (or 8/12-channel pipette) | Enables reproducible, high-throughput plate setup for serial dilutions and buffer matrix preparation. |
| Pre-formulated Buffer Stocks | Consistent, filtered, pH-verified stocks (e.g., HEPES, Tris, PBS at various pH/ionic strength) reduce preparation variability. |
| Stable Reducing Agent (e.g., TCEP) | Maintains cysteine residues in reduced state more reliably than DTT over long screening runs. |
| Non-ionic Detergent (e.g., Tween-20) | Reduces non-specific protein binding to plate walls and pipette tips, critical for low-concentration samples. |
| Protein Standards (e.g., BSA, Lysozyme) | Monodisperse proteins of known hydrodynamic radius for periodic validation of instrument performance and data processing. |
| Viscosity Standard (e.g., Sucrose solutions) | For calibrating/verifying temperature-dependent viscosity corrections in the DLS software. |
| Plate Centrifuge with Microplate Rotor | For gently removing air bubbles from wells post-dispensing, which are catastrophic for DLS measurement. |
Instrument Calibration and Maintenance for Consistent High-Throughput Performance
Within the context of a high-throughput protein screening research program utilizing Dynamic Light Scattering (DLS) plate readers, consistent instrument performance is non-negotiable. DLS plate readers combine the size characterization capabilities of DLS with the high-throughput (HT) capacity of microplate readers, enabling rapid assessment of protein aggregation, stability, and biomolecular interactions. This application note provides detailed protocols and calibration standards to ensure data integrity across long-term screening campaigns, a cornerstone for reliable thesis findings in drug discovery.
Core Principles of DLS Plate Reader Calibration
Calibration validates the instrument's accuracy, precision, and sensitivity. The two primary calibration modes are:
- Intensity Calibration: Uses a standard of known, stable scattering intensity (e.g., a sealed toluene or purified water cuvette) to normalize the photomultiplier tube (PMT) or avalanche photodiode (APD) detector response.
- Size Calibration: Uses monodisperse nanoparticles of certified diameter (e.g., 60nm or 100nm polystyrene or gold standards) to verify the accuracy of hydrodynamic radius (Rh) measurements.
Current Standards & Acceptable Ranges (Summarized from Manufacturer & ASTM Guidelines):
| Calibration Type | Standard Material | Target Value | Acceptable Range | Measurement Parameter |
|---|---|---|---|---|
| Intensity | Toluene (Filtered, Spectral Grade) | Known Count Rate (e.g., 300 kcps) | ±5% of expected value | Scattering Intensity |
| Size | Polystyrene Nanospheres (e.g., NIST-traceable 60nm) | 60 nm | 58 - 62 nm | Hydrodynamic Radius (Rh) |
| Size | Protein Standard (e.g., Bovine Serum Albumin) | ~3.5 nm (Monomer) | 3.4 - 4.0 nm | Hydrodynamic Radius (Rh) |
| Positional | Fluorescent or Scattering Well Plate | N/A | CV < 2% across all wells | Inter-well Intensity Consistency |
Detailed Calibration Protocols
Protocol 2.1: Weekly Performance Qualification (PQ) Using Nanosphere Standards
Objective: To verify the instrument's size measurement accuracy and precision. Materials:
- DLS plate reader.
- NIST-traceable polystyrene nanosphere standard (e.g., 60nm ± 1nm).
- Low-protein-binding 384-well or 96-well microplate (preferably the same type used in screening).
- Particle-free buffer (e.g., 0.02µm filtered PBS or the buffer used in assays).
- Piper and filtered tips.
Procedure:
- Dilution: Dilute the nanosphere stock in filtered buffer to a final concentration recommended by the instrument manufacturer (typically resulting in an intensity of 200-500 kcps).
- Loading: Pipette 40 µL (for a 384-well plate) or 100 µL (for a 96-well plate) of the diluted standard into a minimum of 12 wells, distributed across the plate (e.g., corners and center).
- Measurement: Run the DLS measurement using the standard HT-DLS protocol (e.g., 3-5 reads of 5 seconds each per well).
- Analysis: Calculate the mean Rh and polydispersity index (PdI) for each measured well.
- Acceptance Criteria: The mean Rh across all wells must be within the certified range (e.g., 58-62nm). The inter-well Coefficient of Variation (CV) for Rh should be < 3%. The mean PdI should be < 0.05.
Protocol 2.2: Daily Intensity System Suitability Test (SST)
Objective: To monitor detector stability and laser performance. Materials:
- Sealed, stable intensity reference (e.g., a manufacturer-provided solid-state scatterer or a permanently sealed cuvette with a stable suspension).
- Clean microplate.
Procedure:
- Place the intensity reference in the designated well or holder.
- Perform a 10-second intensity measurement.
- Record the mean scattering intensity (in kcps).
- Acceptance Criteria: The measured intensity must fall within a pre-established control range (e.g., ±10% of the historical mean). Plot results on a control chart.
Preventive Maintenance Schedule
Adherence to a strict maintenance schedule prevents downtime and data drift.
| Task | Frequency | Key Action | Purpose |
|---|---|---|---|
| Laser/Optics Inspection | Monthly | Visual check for dust; follow mfr. guidance for cleaning. | Prevents intensity loss and artifacts. |
| Plate Stage Alignment | Quarterly | Run positional calibration protocol using a reference plate. | Ensures consistent focal point across all wells. |
| Software Updates & Backup | As released | Install updates; back up methods and calibration files. | Maintains compatibility and security. |
| Full Performance Validation | Biannually | Execute full intensity & size calibration with traceable standards. | Comprehensive system qualification. |
Visualizing the Calibration-Data Workflow
Diagram Title: DLS Reader Calibration and Screening Workflow
The Scientist's Toolkit: Essential Research Reagent Solutions
| Item | Function in DLS Plate Reader Experiments |
|---|---|
| NIST-Traceable Polystyrene Nanospheres (e.g., 60nm) | Gold standard for validating size measurement accuracy and instrument precision. |
| BSA (Bovine Serum Albumin) Monomer Standard | Protein-specific size control to confirm instrument performance for biological samples. |
| Low-Protein-Binding Microplates (e.g., COC/PS) | Minimizes sample adsorption to well walls, ensuring accurate concentration measurements. |
| 0.02 µm Syringe Filters & Filtered Buffer | Removes dust and particulate contamination, the primary source of artifacts in DLS. |
| Sealed Intensity Reference Cuvette | Provides a stable scattering signal for daily detector and laser performance validation. |
| Protein Stabilization Buffer (e.g., with Polysorbate 20) | Prevents protein aggregation during extended plate reader runtime, reducing false positives. |
| Automated Liquid Handling System | Ensures precise, reproducible sample and standard loading across 384/96-well plates. |
| Data Analysis Software with Batch Processing | Enables rapid, automated analysis of hundreds of DLS autocorrelation functions for HT screening. |
DLS Plate Reader Validation: Comparative Analysis with SEC-MALS, AUC, and NanoDSF
Correlating DLS Hydrodynamic Radius with SEC-MALS and Analytical Ultracentrifugation (AUC) Data
Application Notes
Within a high-throughput protein screening research thesis, a Dynamic Light Scattering (DLS) plate reader serves as a primary tool for rapid hydrodynamic radius (Rh) assessment. However, orthogonal methods are required to validate DLS data, deconvolute complex populations, and obtain absolute molecular parameters. Correlation with Size Exclusion Chromatography coupled to Multi-Angle Light Scattering (SEC-MALS) and Analytical Ultracentrifugation (AUC) provides a comprehensive view of protein size, molar mass, and conformation.
Key Correlative Data: Table 1: Comparison of Core Techniques for Protein Characterization
| Technique | Key Parameter(s) Measured | Typical Sample Throughput | Key Advantage for Screening | Primary Limitation |
|---|---|---|---|---|
| DLS Plate Reader | Hydrodynamic Radius (Rh), Polydispersity Index (PDI) | High (96/384-well) | Speed, minimal sample prep, stability assessment | Cannot resolve mixtures >~3:1 size ratio. |
| SEC-MALS | Absolute Molar Mass (Mw), Rh (via viscometry), Conformation | Medium (a few per day) | Separation-based, mass and size for each eluting species. | Potential column interactions, dilution. |
| AUC (Sedimentation Velocity) | Sedimentation Coefficient (s), Molar Mass (Mw), Shape (f/f0) | Low (1-2 experiments/day) | Solution-state, no matrix, high resolution of mixtures. | Low throughput, data analysis complexity. |
Table 2: Expected Correlation of Parameters Across Techniques for a Monoclonal Antibody
| Sample State | DLS (Rh, nm) | SEC-MALS (Rh, nm) | SEC-MALS (Mw, kDa) | AUC (s20,w, S) | AUC (Mw, kDa) | Inference |
|---|---|---|---|---|---|---|
| Monomer | 5.4 ± 0.3 | 5.5 ± 0.2 | 147 ± 3 | 6.5 ± 0.1 | 148 ± 2 | Good correlation confirms native state. |
| Aggregated | 10.8 (main peak) | 10.5 (eluting peak) | ~440 (eluting peak) | Multiple species (e.g., 9.2S, 12.5S) | Multimodal distribution | DLS shows size increase; SEC-MALS/AUC quantify aggregate mass & identity. |
| Denatured | 7.1 ± 0.5 | 6.8 ± 0.3 (with change in conformation plot) | 150 ± 4 | 4.8 ± 0.2 | 149 ± 3 | Increased Rh & decreased s indicate unfolded, extended conformation. |
Experimental Protocols
Protocol 1: High-Throughput DLS Screening on a Plate Reader
- Sample Preparation: In a 384-well glass-bottom plate, dispense 40 µL of purified protein per well (concentration range: 0.5-2 mg/mL in a suitable buffer). Include buffer-only controls.
- Instrument Setup: Equilibrate DLS plate reader to 20°C. Configure software for the correct plate type and measurement position within each well.
- Measurement Parameters: Set number of acquisitions to 10-15 per well, duration of 2-5 seconds each. Use an automated attenuation selection.
- Data Collection: Run the plate. Software automatically calculates intensity-weighted Rh distribution and PDI for each well.
- Primary Analysis: Wells with PDI >0.25 for a monodisperse protein indicate potential aggregation or sample heterogeneity, flagging them for orthogonal analysis.
Protocol 2: Orthogonal Validation via SEC-MALS
- System Equilibration: Equilibrate an HPLC system with in-line MALS, dRI, and optional viscometer (VISC) detector. Use a suitable SEC column (e.g., Superdex 200 Increase) with filtered, degassed mobile phase (e.g., PBS, pH 7.4) until stable baseline.
- Sample Injection: Centrifuge DLS-flagged samples at 14,000 x g for 10 min. Inject 50-100 µL of supernatant.
- Chromatography: Run isocratic elution at 0.5-0.75 mL/min.
- Data Analysis: Use software (e.g., Astra, OMNISEC) to determine absolute molar mass from MALS/dRI, and hydrodynamic radius from intrinsic viscosity (via VISC) or from the MALS signal using the conformation plot (Rg vs. Mw).
Protocol 3: Conformational & Interaction Analysis via AUC (Sedimentation Velocity)
- Sample & Cell Assembly: Prepare protein samples at appropriate loading concentrations (e.g., 0.2, 0.5, 1.0 mg/mL) in matched buffer. Load 420 µL of reference buffer and 400 µL of sample into a dual-sector charcoal-filled Epon centerpiece. Assemble cell with quartz windows.
- Instrument Setup: Install rotor (e.g., An-50 Ti) with cells into the ultracentrifuge. Equilibrate at 20°C under vacuum.
- Centrifugation: Run at 42,000 rpm. Radial absorbance (280 nm) and/or interference data are collected continuously.
- Data Modeling: Analyze data using software (e.g., SEDFIT). Model the sedimentation coefficient distribution [c(s)] to determine the number, proportion, and s-value of species. Integrate with DLS Rh and SEC-MALS Mw to compute shape factors (f/f0).
Visualizations
High-Throughput Protein Screening Validation Workflow
Data Correlation Logic for Protein Characterization
The Scientist's Toolkit: Research Reagent Solutions
Table 3: Essential Materials for Correlative Protein Analysis
| Item | Function in Context |
|---|---|
| Glass-Bottom 384-Well Plates | Minimize background light scattering for DLS plate reader measurements. |
| Size-Exclusion Chromatography (SEC) Column | Separates protein monomers, fragments, and aggregates based on hydrodynamic volume. |
| MALS Detector | Provides absolute molar mass measurement independent of elution time. |
| Online Differential Refractometer (dRI) | Measures concentration for MALS and SEC-MALS calculations. |
| Analytical Ultracentrifuge & Cells | Enables solution-state separation and analysis based on sedimentation velocity. |
| Charcoal-Filled Epon Centerpieces | Standard centerpiece for AUC, inert and compatible with most protein buffers. |
| Stable, High-Purity Buffer Components | Essential for all techniques to avoid artifacts from aggregates or interfering scatterers. |
| Protein Standards (e.g., BSA, Thyroglobulin) | For calibrating SEC retention time, validating DLS performance, and AUC s-value calibration. |
Dynamic Light Scattering (DLS) in a plate reader format has become a cornerstone for high-throughput protein screening in drug discovery. It provides rapid, label-free analysis of protein size, aggregation state, and oligomerization directly in solution. These Application Notes delineate the scenarios where DLS plate readers are the optimal choice and where integrating complementary techniques is essential for robust characterization.
Quantitative Strengths and Limitations of DLS Plate Readers
Table 1: Key Performance Metrics and Comparative Context for DLS Plate Readers
| Parameter | DLS Plate Reader Strength (Optimal Use Case) | Quantitative Performance | Limitation / Need for Complementary Technique |
|---|---|---|---|
| Size Range | Monomeric proteins, small oligomers, aggregates. | Optimal: 0.3 nm – 10 μm (hydrodynamic diameter). | Limited resolution for polydisperse samples (>2-3 populations). |
| Concentration | Medium to high purity, moderate concentration. | Typical: 0.1 – 100 mg/mL (protein-dependent). | Low concentration (<0.1 mg/mL) requires high sample brightness. |
| Throughput | Primary screening of stability, aggregation propensity. | 96- or 384-well plates; <1 min/well. | N/A (Core strength). |
| Sample Volume | Minimal reagent consumption. | As low as 2-5 μL per well. | N/A (Core strength). |
| Size Resolution | Distinguishing monomer from large aggregates. | Excellent for monomodal vs. bimodal (aggregated) distributions. | Poor for resolving similar-sized species (e.g., dimer vs. trimer). |
| Information Gained | Hydrodynamic radius (Rh), aggregation index, polydispersity. | Provides Rh and % intensity from aggregates. | No molecular weight, shape, or exact stoichiometry. |
Detailed Experimental Protocols
Protocol 1: High-Throughput Protein Thermal Stability Screening (DLS-Excels)
Objective: Rapid identification of buffer conditions or ligands that stabilize a protein against aggregation induced by thermal stress. Workflow:
- Sample Preparation: Dispense 50 μL of purified target protein (1 mg/mL in PBS) into columns 2-11 of a 96-well glass-bottom DLS microplate. Use column 1 for buffer blanks and column 12 for a positive control (BSA).
- Ligand/Buffer Addition: Using an acoustic liquid handler, add 50 nL of small molecule compounds from a 10 mM library stock to designated wells. For buffer screens, pre-mix protein with different buffers.
- DLS Plate Reader Setup: Equilibrate plate reader stage to 25°C. Set laser to appropriate wavelength (e.g., 830 nm). Configure measurement parameters: 3 measurements/well, 10 seconds each.
- Thermal Ramp Measurement: Program a thermal gradient from 25°C to 70°C at a rate of 0.5°C/min, with a DLS measurement at every 1°C increment.
- Data Analysis: Plot the intensity-weighted mean particle size or aggregation intensity (%) vs. temperature. The melting temperature (Tm) is defined as the inflection point where aggregate formation accelerates. Identify conditions/ligands that raise the Tm or suppress aggregate formation.
Protocol 2: Integrating SEC-MALS with DLS for AAV Capsid Characterization (Complementary Technique)
Objective: Accurately determine the empty/full capsid ratio and absolute size of Adeno-Associated Virus (AAV) vectors, where DLS alone is insufficient. Workflow:
- Primary DLS Screen (Plate Reader): Perform a rapid DLS measurement on 5 μL of AAV samples (1e13 vg/mL) across multiple purification fractions. Identify fractions with a monomodal, low-polydispersity size distribution (~25 nm Rh).
- Complementary SEC-MALS Analysis: Inject 50 μL of the pre-screened sample onto an HPLC system with a size-exclusion column (e.g., Zenix SEC-300) equilibrated in formulation buffer.
- Online Multi-Detector Array: The eluent passes through in series: a. UV/RI Detectors: For protein and nucleic acid concentration. b. Multi-Angle Light Scattering (MALS): Provides absolute molecular weight of particles in each eluting peak. c. DLS Detector (Inline): Provides hydrodynamic radius (Rh) for each peak.
- Data Correlation: Use ASTRA or equivalent software to deconvolute signals. The MALS-derived molecular weight definitively identifies empty capsids (Mw ~3.6 MDa) and full capsids (Mw ~4.7 MDa). The SEC resolves aggregates, and the inline DLS confirms Rh.
Visualization Diagrams
Diagram 1: Decision Workflow for DLS vs. Complementary Techniques
Diagram 2: Multi-Technique AAV Characterization Workflow
The Scientist's Toolkit: Research Reagent Solutions
Table 2: Essential Materials for High-Throughput DLS Screening
| Item | Function & Description |
|---|---|
| Ultra-Low Volume DLS Microplates | Glass-bottom, non-binding 96- or 384-well plates. Minimizes sample volume (2-5 µL) and reduces surface adsorption. |
| Acoustic Liquid Handler | Enables precise, non-contact transfer of nL volumes of compound libraries or buffers directly into assay plates, minimizing dilution. |
| Stable Protein Standards | Monodisperse proteins (e.g., BSA, lysozyme) of known size. Essential for daily validation of instrument performance and laser alignment. |
| SEC Columns for Biologics | High-resolution columns (e.g., Zenix, AdvanceBio) for separating monomers, oligomers, and aggregates prior to MALS/DLS detection. |
| Multi-Detector SEC System | Integrated HPLC system with UV, RI, MALS, and DLS detectors. The gold-standard complement for absolute protein characterization. |
| Buffers with Nanofiltration | Buffers filtered through 0.02 µm filters to eliminate dust/particulates, which are major sources of noise in DLS measurements. |
Application Notes
Within the broader thesis on utilizing DLS plate readers for high-throughput protein screening, this case study demonstrates a validated, multi-instrument protocol for assessing monoclonal antibody (mAb) stability under thermal stress. The objective was to correlate hydrodynamic radius (Rₕ) measurements from a high-throughput DLS plate reader with polydispersity index (PdI) and intensity data from a traditional cuvette-based DLS instrument, as well as subvisible particle counts from microflow imaging (MFI). This cross-platform validation is critical for establishing robust, high-throughput workflows for early-stage biotherapeutic developability assessments.
The mAb (IgG1) was subjected to a thermal stress at 55°C for varying durations (0, 1, 3, 7 days). Stability was monitored by measuring aggregation propensity and particle formation.
Table 1: Summary of Stability Metrics Across Platforms
| Stress Time (Days) | DLS Plate Reader (Rₕ, nm) | Cuvette DLS (Rₕ, nm) | Cuvette DLS (PdI) | MFI (>1µm particles/mL) |
|---|---|---|---|---|
| 0 (Control) | 5.4 ± 0.2 | 5.5 ± 0.3 | 0.05 ± 0.02 | 5,200 ± 800 |
| 1 | 5.8 ± 0.3 | 5.9 ± 0.2 | 0.08 ± 0.03 | 12,500 ± 2,100 |
| 3 | 6.9 ± 0.4 | 7.1 ± 0.5 | 0.15 ± 0.04 | 45,300 ± 5,700 |
| 7 | 12.3 ± 1.8* | 18.5 ± 3.2* | 0.42 ± 0.08* | 312,000 ± 41,000* |
*Indicates significant change from control (p < 0.01).
Key Findings: The high-throughput DLS plate reader showed excellent correlation (R² = 0.98) with cuvette-based Rₕ measurements for early stress timepoints. A marked increase in Rₕ and PdI at Day 7, corroborated by a sharp rise in subvisible particles, confirmed the formation of large aggregates. The plate reader enabled the simultaneous analysis of 96 conditions in under 30 minutes, offering a throughput advantage for screening formulations or multiple mAbs in parallel.
Experimental Protocols
Protocol 1: Sample Preparation and Thermal Stress
- Buffer Exchange: Dialyze the monoclonal antibody (2 mg/mL) into a standard formulation buffer (e.g., 20 mM Histidine-HCl, 150 mM NaCl, pH 6.0).
- Aliquoting: Dispense 200 µL of the mAb solution into sterile, low-protein-binding microcentrifuge tubes.
- Stress Induction: Place sample tubes in a calibrated thermal block or incubator set to 55.0°C ± 0.5°C.
- Time-Point Harvesting: At predetermined intervals (0, 1, 3, 7 days), remove triplicate samples and immediately place them on ice or at 4°C to halt further aggregation.
Protocol 2: High-Throughput DLS Analysis on a Plate Reader
- Plate Loading: Transfer 40 µL of each stressed sample and controls into a black-walled, clear-bottom 384-well microplate suitable for DLS. Centrifuge the plate at 1000 × g for 2 minutes to remove air bubbles.
- Instrument Setup: Power on the DLS-enabled plate reader (e.g., Wyatt Technology’s DynaPro Plate Reader). Set the instrument temperature to 25°C and allow equilibration for 15 minutes.
- Acquisition Parameters: In the control software, define the measurement area per well. Set laser power to auto-optimize. Configure each well for 10 acquisitions of 2 seconds each.
- Data Collection: Run the plate measurement. The software automatically calculates the intensity-weighted Rₕ distribution and average Rₕ for each well.
- Analysis: Export the mean Rₕ and derived count rate (DCR) for all wells. Perform statistical analysis on triplicate samples.
Protocol 3: Correlative Cuvette-Based DLS and MFI Analysis
- Cuvette DLS:
- Dilute 50 µL of each stressed sample with 450 µL of filtered formulation buffer (0.02 µm filtered) to a final volume of 500 µL.
- Load the diluted sample into a disposable, low-volume, optical quality polystyrene cuvette.
- Insert the cuvette into the DLS instrument (e.g., Malvern Panalytical Zetasizer Ultra) equilibrated at 25°C.
- Run measurements in triplicate using the "Protein Analysis" preset. Record the Z-average Rₕ and the PdI.
- Microflow Imaging (MFI):
- Gently invert each stressed sample 5 times to ensure homogeneity without introducing bubbles.
- Load the sample into a 1 mL syringe and prime the MFI flow cell (e.g., ProteinSimple MFI 5200) according to manufacturer instructions.
- Analyze 0.5 mL of the sample at a flow rate of 0.1 mL/min. Use the instrument software to count and size particles ≥1 µm and ≥10 µm.
- Report results as particles per mL.
Visualizations
Diagram Title: Cross-Platform Stability Assessment Workflow
Diagram Title: mAb Aggregation Pathway Under Thermal Stress
The Scientist's Toolkit
Table 2: Key Research Reagent Solutions & Essential Materials
| Item | Function in Protocol |
|---|---|
| Monoclonal Antibody (IgG1) | The therapeutic protein analyte whose stability profile is being characterized. |
| Histidine-HCl Formulation Buffer | Provides a stable, physiologically relevant pH environment for the mAb during stress. |
| Low-Protein-Binding Microtubes | Minimizes surface adsorption of protein, preventing sample loss and spurious aggregation. |
| 384-Well DLS Microplate | Specialized plate with optical-quality bottom and black walls to minimize cross-talk for plate reader DLS. |
| Disposable DLS Cuvettes | Ensures no carryover contamination between samples for cuvette-based DLS measurements. |
| 0.02 µm Syringe Filter | Used to filter buffers to remove background particulates that interfere with DLS and MFI baselines. |
| MFI Calibration Standards | Polystyrene beads of known size (e.g., 1µm, 10µm) to validate and calibrate the MFI instrument sizing. |
| High-Throughput DLS Plate Reader | Instrument that performs dynamic light scattering measurements directly in microplate wells for parallel screening. |
| Cuvette-Based DLS Instrument | Traditional DLS system providing detailed size distribution and polydispersity index (PdI) metrics. |
| Microflow Imaging (MFI) System | Provides direct visual counting and sizing of subvisible particles (1-100µm) in the solution. |
Dynamic Light Scattering (DLS) is a cornerstone technique for assessing protein size, aggregation, and stability. Traditional DLS instruments offer deep, detailed analysis but are low-throughput. The advent of DLS plate readers bridges this gap, enabling high-throughput screening (HTS) in early-stage biopharmaceutical development. This Application Note positions the DLS plate reader within the biophysical toolbox, contrasting its throughput capabilities with the analytical depth of standalone systems, and provides protocols for integration into protein screening workflows.
The Biophysical Toolbox: Throughput vs. Depth Spectrum
The choice of biophysical technique involves a trade-off between the number of samples analyzed (throughput) and the richness of information obtained (depth). DLS plate readers occupy a unique middle ground.
Table 1: Comparative Analysis of Biophysical Techniques for Protein Screening
| Technique | Approx. Samples/Day (Throughput) | Key Information (Depth) | Primary Use in Screening |
|---|---|---|---|
| DLS Plate Reader | 96 - 384 | Hydrodynamic radius (Rh), aggregation propensity, polydispersity index (PDI) | Rapid stability assessment, formulation screening, buffer optimization |
| Standalone DLS/NanoDSF | 10 - 20 | Detailed Rh distribution, melting temperature (Tm via NanoDSF), thermal aggregation onset | In-depth stability profiling, lead candidate characterization |
| SEC-MALS | 20 - 40 | Absolute molar mass, aggregate quantification, separation-based analysis | Confirmatory analysis, purity and aggregation check |
| SPR/BLI | 50 - 100 | Binding kinetics (ka, kd), affinity (KD) | Affinity screening, epitope binning |
| DSF (Sypro Orange) | 500+ | Thermal shift (ΔTm) | Primary HTS for thermal stability, ligand binding |
Application Protocols
Protocol 1: High-Throughput Protein Conformational Stability Screen
Objective: Identify buffer conditions that maximize protein stability and minimize aggregation. Materials: See "The Scientist's Toolkit" below. Workflow:
- Plate Preparation: In a 96-well or 384-well low-volume plate, dispense 40 µL of each buffer condition (varying pH, salt, excipients) per well.
- Protein Addition: Add 10 µL of the target protein (final concentration 0.5-2 mg/mL) to each well. Mix gently via plate shaking (500 rpm, 1 minute).
- Centrifugation: Centrifuge the plate at 1000 × g for 2 minutes to remove bubbles and settle droplets.
- DLS Measurement: Load plate into DLS plate reader. Set instrument method: 5 measurements per well, 3-second acquisition each, temperature equilibration to 25°C.
- Data Analysis: Review mean Rh and %PDI for each well. Stable, monodisperse samples will show a tight Rh distribution and %PDI < 0.2 (or < 0.1 for mAbs). Map conditions by Rh and PDI to identify optimal formulations.
Protocol 2: Ligand-Induced Aggregation/Stabilization Screening
Objective: Rapidly screen small molecule or fragment libraries for compounds that induce or suppress protein aggregation. Workflow:
- Prepare a master mix of target protein in a physiologically-relevant buffer.
- Using an acoustic dispenser or pintool, transfer nanoliter volumes of compounds from a library stock plate into an assay plate.
- Dispense 45 µL of the protein master mix into each well. Final compound concentration typically 10-100 µM.
- Incubate plate for 30-60 minutes at room temperature.
- Centrifuge plate (1000 × g, 2 min) and load into DLS reader.
- Analysis: Compare the intensity-weighted size distribution and %PDI of protein+compound wells to a protein-only control. "Hits" are compounds causing a significant increase in aggregate signal (large particle size) or a decrease in PDI (stabilization).
Visualizations
Diagram 1: Biophysical Technique Selection Workflow
(Title: Decision Tree for Biophysical Method Selection)
Diagram 2: DLS Plate Reader Screening Workflow
(Title: High-Throughput DLS Screening Protocol Steps)
The Scientist's Toolkit: Key Research Reagent Solutions
| Item | Function in DLS Screening |
|---|---|
| Low-Volume 384-Well Plates (e.g., Corning 3540) | Minimizes sample consumption (as low as 5-10 µL). Optically clear bottom and low protein binding. |
| Molecular Grade Bovine Serum Albumin (BSA) | Used for instrument calibration and as a stable, monodisperse control sample (Rh ~3.5 nm). |
| Pre-Filtered, Particle-Free Buffers | Essential for reducing background scatter from dust or aggregates in buffer components. |
| Nonionic Surfactant (e.g., Polysorbate 20/80) | Standard excipient to prevent surface adsorption and non-specific aggregation during screening. |
| NIST-Traceable Nanosphere Size Standards | For absolute validation of instrument sizing performance (e.g., 60nm polystyrene beads). |
| Acoustic Liquid Handling System | Enables precise, non-contact transfer of library compounds for aggregation screens, minimizing carryover. |
| Automated Plate Sealer & Centrifuge | Ensures consistent sample preparation by removing bubbles that interfere with light scattering. |
Integrating DLS Data with Orthogonal Methods for a Holistic Protein Characterization Strategy
In high-throughput protein screening for biopharmaceutical development, dynamic light scattering (DLS) plate readers provide rapid, initial assessment of protein size, aggregation, and polydispersity. However, a holistic characterization strategy requires integrating DLS data with orthogonal methods to confirm identity, assess stability, and quantify activity. This application note details protocols for a multi-attribute analytical workflow, framed within a thesis on leveraging high-throughput DLS for early-stage protein therapeutic screening.
The Need for Orthogonal Confirmation
DLS excels at detecting oligomers and subvisible particles but lacks chemical specificity. Integrating with methods like SEC, DSF, and SPR provides a comprehensive profile critical for lead selection and formulation development.
Table 1: Complementary Techniques for DLS Data Integration
| Technique | Primary Output | Complementary Role to DLS | Throughput |
|---|---|---|---|
| Size Exclusion Chromatography (SEC) | Hydrodynamic radius (Rh) by elution time, % monomer/aggregate | Quantifies soluble aggregates; validates DLS size distribution. | Medium |
| Differential Scanning Fluorimetry (DSF) | Melting temperature (Tm), protein thermal stability | Correlates aggregation onset (from DLS) with thermal unfolding. | High (plate-based) |
| Surface Plasmon Resonance (SPR) | Binding kinetics (ka, kd), affinity (KD) | Confirms that native conformation (implied by DLS monodispersity) is functionally active. | Medium |
| Microfluidic Diffusional Sizing (MDS) | Hydrodynamic radius, binding constants | Provides orthogonal size measurement in solution, no membrane interactions. | Medium-High |
| Mass Photometry | Molecular mass, oligomeric state distribution | Directly counts and sizes single particles, validating DLS aggregation data. | Medium |
Experimental Protocols
Protocol 1: High-Throughput DLS Screening with Thermal Stress
Objective: Identify thermally stable protein variants/formulations. Materials: DLS plate reader (e.g., Wyatt DynaPro Plate Reader, Malvern Panalytical), 384-well plate, purified protein samples, formulation buffers. Procedure:
- Sample Preparation: Dispense 40 µL of protein solution (0.5-2 mg/mL) per well in a 384-well plate. Include buffer blanks.
- DLS Baseline Measurement: Set instrument temperature to 25°C. Acquire 5-10 measurements per well (3-5 seconds each). Record intensity-weighted size distribution, polydispersity index (PdI), and % intensity of main peak.
- Thermal Ramp Stress: Increase temperature from 25°C to 70°C at a rate of 0.5°C/min, with DLS measurements taken at 2°C intervals.
- Data Analysis: Plot Rh and % aggregates vs. temperature. The inflection point in aggregate growth approximates the aggregation temperature (Tagg).
- Sample Selection: Select candidates with low initial PdI (<0.2) and high Tagg for downstream analysis.
Protocol 2: Orthogonal SEC Validation of DLS Aggregation State
Objective: Quantify monomeric and soluble aggregate fractions. Materials: HPLC/UPLC system with SEC column (e.g., Waters ACQUITY UPLC, Tosoh TSKgel), mobile phase (PBS + 200 mM NaCl), DLS-screened samples. Procedure:
- SEC Method: Equilibrate column with mobile phase at 0.5 mL/min. Set UV detection to 280 nm.
- Calibration: Inject protein standards to create retention time vs. log(MW) calibration curve.
- Sample Run: Inject 10 µL of DLS-screened sample. Run for 15 minutes.
- Integration: Integrate peak areas for monomer, dimer, and higher-order aggregates.
- Correlation: Compare % aggregate from SEC (area under curve) with % intensity from DLS main peak. Note: DLS overweights larger particles; trends, not absolute values, should align.
Protocol 3: DSF for Correlating Thermal Stability with Aggregation
Objective: Determine protein melting temperature (Tm) and correlate with DLS Tagg. Materials: Real-time PCR instrument, SYPRO Orange dye, 96-well PCR plate, DLS-screened samples. Procedure:
- Plate Setup: Mix 10 µL protein sample (0.2 mg/mL) with 10 µL of 20X SYPRO Orange dye in PCR plate wells.
- Thermal Denaturation: Ramp temperature from 25°C to 95°C at 1°C/min, monitoring fluorescence (excitation/emission ~470/570 nm).
- Data Analysis: Fit fluorescence vs. temperature data to a Boltzmann sigmoidal curve. Derive Tm as the inflection point.
- Holistic Analysis: Plot Tm (from DSF) vs. Tagg (from DLS Protocol 1). Stable candidates show high Tm and Tagg with minimal (<10°C) separation.
Protocol 4: SPR for Functional Validation of Monodisperse Samples
Objective: Confirm binding functionality of samples selected for monodispersity in DLS. Materials: SPR instrument (e.g., Cytiva Biacore), CMS sensor chip, ligand, DLS-validated analyte, running buffer. Procedure:
- Ligand Immobilization: Activate carboxylated sensor chip surface with EDC/NHS. Inject ligand in appropriate buffer to achieve ~100-500 RU. Deactivate with ethanolamine.
- Kinetic Run: Use multi-cycle kinetics. Inject DLS-screened analyte samples at 5 concentrations (e.g., 1-100 nM) at 30 µL/min for 120s association, followed by 300s dissociation.
- Data Processing: Double-reference sensorgrams. Fit to a 1:1 Langmuir binding model to derive association (ka) and dissociation (kd) rate constants, and equilibrium dissociation constant (KD).
- Correlation: Confirm samples with optimal DLS profiles (low PdI, high monomer) yield robust, high-affinity binding kinetics.
Visualizing the Integrated Workflow
Diagram Title: Integrated Protein Characterization Workflow
Diagram Title: Protein Instability Pathway & Detection Methods
The Scientist's Toolkit: Research Reagent Solutions
Table 2: Essential Materials for Integrated Characterization
| Item | Function & Relevance to DLS Integration |
|---|---|
| DLS Plate Reader (e.g., Wyatt DynaPro) | Enables high-throughput size and aggregation screening of 384-well samples; primary tool for initial triage. |
| SEC Column (e.g., Tosoh TSKgel SuperSW mAb HR) | Separates monomer from aggregates for quantitative validation of DLS aggregation alerts. |
| SEC-MALS Detector | Adds multi-angle light scattering to SEC for absolute molecular weight, orthogonal to DLS Rh. |
| SYPRO Orange Dye | Environment-sensitive fluorophore for DSF; reports thermal unfolding independent of aggregation. |
| SPR Sensor Chip (e.g., Cytiva Series S CMS) | Gold surface for immobilizing target ligand to test binding function of DLS-screened analytes. |
| Formulation Buffer Library | Diverse buffers (varying pH, salts, excipients) for screening stability conditions in DLS/DSF. |
| MicroCal PEAQ-DSC | Provides detailed thermodynamic stability data (ΔH, Tm) orthogonal to DLS/DSF. |
| Mass Photometry Instrument | Directly images and sizes single molecules in solution, confirming DLS oligomerization data. |
| U/HPLC System | Platform for automated, reproducible SEC analysis of DLS-identified candidate samples. |
Conclusion
DLS plate readers have revolutionized high-throughput protein screening by providing rapid, label-free insights into hydrodynamic size, aggregation, and stability—critical parameters in biotherapeutic development. This synthesis of foundational principles, robust methodologies, optimization strategies, and comparative validation underscores DLS as an indispensable, front-line tool. Its integration into automated workflows accelerates formulation development and candidate selection. Future directions point toward even higher-throughput microplate formats, advanced data analytics with machine learning for predictive stability modeling, and tighter integration with automated liquid handling and downstream assays. As the demand for biologics grows, DLS plate reader technology will remain central to building quality by design into the drug development pipeline, ultimately contributing to safer and more effective therapies.