HHP vs. HIU vs. HSS: A Comparative Analysis of Their Effects on Protein Structure and Homogeneity for Biopharmaceutical Development
This comprehensive review analyzes and compares three key physical processing technologies—High Hydrostatic Pressure (HHP), High-Intensity Ultrasound (HIU), and High Shear Stress (HSS)—for their impact on protein structure, aggregation, and batch...
HHP vs. HIU vs. HSS: A Comparative Analysis of Their Effects on Protein Structure and Homogeneity for Biopharmaceutical Development
Abstract
This comprehensive review analyzes and compares three key physical processing technologies—High Hydrostatic Pressure (HHP), High-Intensity Ultrasound (HIU), and High Shear Stress (HSS)—for their impact on protein structure, aggregation, and batch homogeneity. Aimed at researchers and drug development professionals, the article explores foundational principles, specific methodologies and applications, strategies for troubleshooting and optimization, and rigorous validation and comparative performance metrics. The goal is to provide a clear decision-making framework for selecting the optimal technology to enhance protein stability, prevent aggregation, and ensure product consistency in therapeutic development and manufacturing.
Understanding the Forces: Core Principles of HHP, HIU, and HSS on Protein Dynamics
This guide objectively compares the effects of High Hydrostatic Pressure (HHP), High-Intensity Ultrasound (HIU), and High Shear Stress (HSS) on protein structure and homogeneity—a critical consideration in biopharmaceutical development.
Mechanistic Comparison & Core Effects
| Parameter | HHP (Isostatic Pressure) | HIU (Cavitation & Microstreaming) | HSS (Laminar & Turbulent Flow) |
|---|---|---|---|
| Primary Physical Principle | Application of uniform pressure (100-1000 MPa). | Acoustic cavitation, microstreaming, and local shear. | Laminar: viscous drag. Turbulent: chaotic eddies & interfacial stress. |
| Key Effect on Protein | Reversible/irreversible unfolding; dissociation of oligomers. | Aggregation via hydrophobic interactions; fragmentation at high doses. | Surface-mediated denaturation; aggregation due to air-liquid interfaces (turbulent). |
| Spatial Homogeneity | Excellent (isostatic, uniform throughout sample). | Poor (highly localized near cavitation bubbles). | Variable (laminar: uniform shear; turbulent: heterogeneous zones). |
| Primary Control Parameter | Pressure (MPa), time, temperature. | Amplitude (W/cm²), frequency, time, probe geometry. | Shear rate (s⁻¹), Reynolds number, time, interface presence. |
| Typical Scale & Throughput | Batch; low to medium throughput. | Batch (probe) or continuous flow; medium throughput. | Continuous flow (homogenizers, pumps); high throughput. |
Table 1: Comparative Experimental Outcomes on Protein Structure & Aggregation
| Treatment Condition | Observed Structural Change | % Native Structure Remaining (CD/Fluorescence) | % Aggregation Increase (DLS/ SEC) | Key Homogeneity Metric (PDI by DLS) |
|---|---|---|---|---|
| HHP: 300 MPa, 25°C, 15 min | Partial unfolding, dimer dissociation. | ~65% | +15% | 0.08 ± 0.02 |
| HIU: 20 kHz, 100 W/cm², 5 min | Fragmentation & rapid aggregation. | ~40% | +250% | 0.45 ± 0.15 |
| HSS (Laminar): 10⁴ s⁻¹, 30 min | Minimal change in bulk. | ~90% | +5% | 0.05 ± 0.01 |
| HSS (Turbulent): 10⁵ s⁻¹, 2 min | Severe interface-induced aggregation. | ~75% | +80% | 0.30 ± 0.10 |
Experimental Protocols for Key Cited Studies
1. Protocol: HHP-Induced Unfolding Monitored by Intrinsic Fluorescence
- Sample: 1 mg/mL BSA in 20 mM phosphate buffer, pH 7.0.
- Equipment: High-pressure cell with optical windows linked to fluorometer.
- Method: Load sample into flexible container within pressure cell. Increase pressure stepwise from 0.1 to 500 MPa, holding for 10 min per step. Record tryptophan fluorescence emission spectra (excitation 295 nm) at each plateau. Plot emission λmax shift vs. pressure to determine transition midpoints (P₁/₂).
2. Protocol: HIU-Induced Aggregation Kinetics via DLS
- Sample: 2 mg/mL Lysozyme in 50 mM Tris-HCl, pH 7.4.
- Equipment: 20 kHz ultrasonic probe, temperature-controlled bath, inline DLS.
- Method: Submerge probe 1 cm into sample. Apply 25 W/cm² in 30 sec pulses (10 sec off for cooling). Withdraw aliquot every 60 sec for immediate DLS measurement. Record hydrodynamic radius (Rh) and polydispersity index (PDI) over 10 min.
3. Protocol: HSS Denaturation in Rotor-Stator Homogenizer
- Sample: 5 mg/mL monoclonal antibody (mAb) in formulation buffer.
- Equipment: Bench-top rotor-stator homogenizer, thermocouple.
- Method: Place 50 mL sample in vessel. Operate homogenizer at 10,000 rpm (estimated shear ~10⁵ s⁻¹) for 0, 1, 2, 5, and 10 min intervals, cooling on ice between runs. Analyze samples by Size-Exclusion Chromatography (SEC-HPLC) to quantify soluble aggregates and fragments.
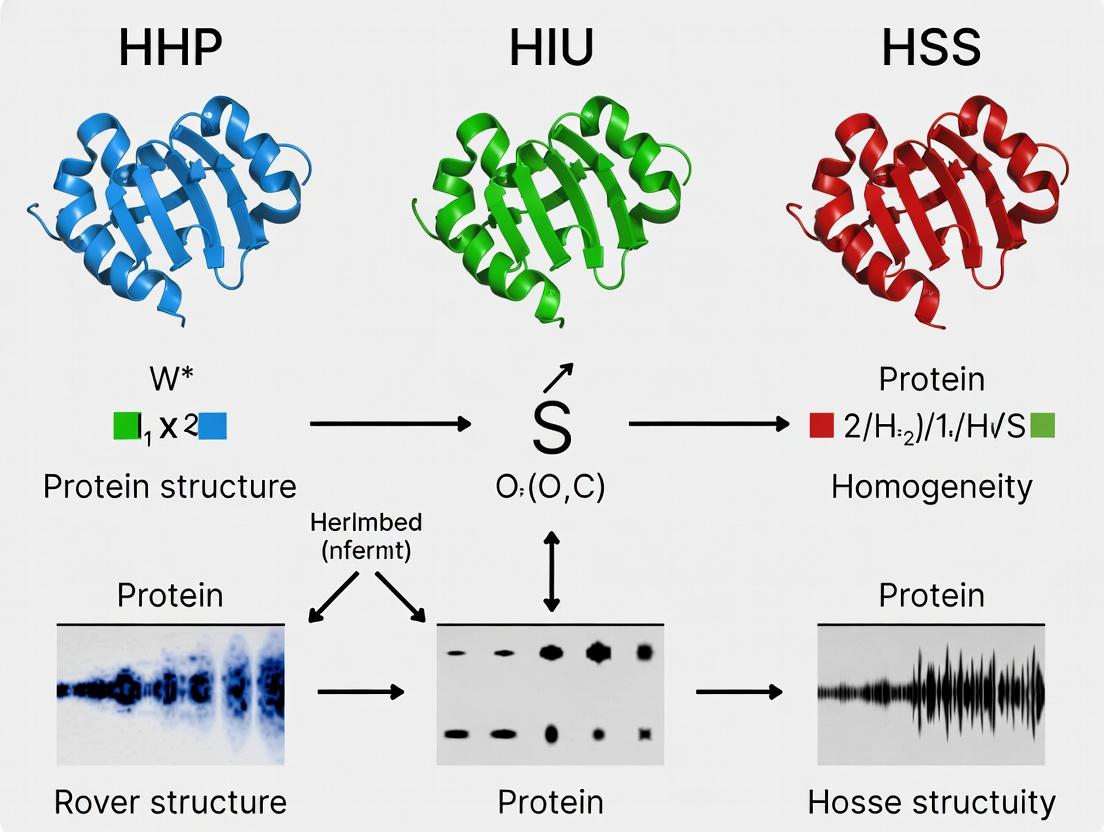
Visualization of Experimental Workflow & Effects
Diagram Title: Comparative Workflow of HHP, HIU, and HSS on Proteins
Diagram Title: Mechanisms of Protein Disruption by HHP, HIU, and HSS
The Scientist's Toolkit: Key Research Reagent Solutions
| Item | Function in HHP/HIU/HSS Research |
|---|---|
| Intrinsic Fluorescence Dyes (Tryptophan) | Probe tertiary structure changes via emission λmax shift upon unfolding. |
| Extrinsic Dyes (ANS, SYPRO Orange) | Bind hydrophobic patches exposed during unfolding/aggregation; used in fluorescence spectroscopy. |
| Size-Exclusion Chromatography (SEC) Columns | Separate and quantify native monomers, soluble aggregates, and fragments post-treatment. |
| Dynamic/Static Light Scattering (DLS/SLS) Instruments | Measure hydrodynamic radius (Rh), aggregation size, and polydispersity index (PDI) in real-time or offline. |
| Circular Dichroism (CD) Spectroscopy | Quantify secondary (far-UV) and tertiary (near-UV) structural content. |
| Chemical Cross-linkers (e.g., Glutaraldehyde) | Trap transient oligomers formed under pressure or shear for analysis. |
| Stabilizers/Cryoprotectants (Sucrose, Trehalose) | Used as control additives to probe protection mechanisms against HHP/HIU/HSS stress. |
| Protease Inhibitor Cocktails | Prevent confounding proteolytic degradation during lengthy HIU or HSS treatments. |
| Model Proteins (BSA, Lysozyme, β-Lactoglobulin) | Well-characterized standards for comparative mechanistic studies across the three techniques. |
This guide compares the effects of three physical processing technologies—High Hydrostatic Pressure (HHP), High-Intensity Ultrasound (HIU), and High Shear Stress (HSS)—on protein structural stability, unfolding pathways, and aggregation propensity. The objective is to provide researchers with a performance comparison based on experimental data, framed within a thesis on protein structure and homogeneity research.
Performance Comparison: HHP vs. HIU vs. HSS
The following table summarizes the comparative effects of the three technologies on key protein stability metrics, as compiled from recent studies.
Table 1: Comparative Effects of HHP, HIU, and HSS on Protein Stability
| Parameter | High Hydrostatic Pressure (HHP) | High-Intensity Ultrasound (HIU) | High Shear Stress (HSS) |
|---|---|---|---|
| Typical Conditions | 100 - 400 MPa, 5 - 30 min, 20 - 40°C | 20 - 100 kHz, 10 - 1000 W/cm², 1 - 10 min | Shear rate: 10⁴ - 10⁶ s⁻¹ (e.g., homogenizers), 1 - 30 min |
| Primary Effect on Native State | Reversible partial unfolding; favors hydration of buried groups. | Localized denaturation at cavitation sites; can break non-covalent bonds. | Forced alignment and stretching; can disrupt quaternary/tertiary structures. |
| Dominant Unfolding Pathway | Cooperative, sub-global unfolding via solvation of protein core. | Localized, non-cooperative unfolding due to extreme transient conditions (T, P). | Mechanical unfolding via tensile forces; often non-cooperative. |
| Aggregation Trigger | Exposure of hydrophobic patches; can refold upon depressurization. | Free radical generation (sonolysis), interface denaturation at bubbles. | Irreversible exposure of hydrophobic & reactive residues; fibrillation risk. |
| Effect on Homogeneity | Can increase homogeneity by dissociating aggregates (reversible). | Can fragment existing aggregates but may seed new, polydisperse ones. | Often decreases homogeneity, promoting polydisperse aggregates. |
| Sample Heating | Minimal (adiabatic heating ~3°C/100 MPa). | Significant, requires external cooling. | Moderate, depends on viscosity and duration. |
| Key Structural Probe | Fluorescence (Trp exposure), High-pressure NMR. | SDS-PAGE (fragmentation), FTIR for secondary structure. | Intrinsic viscosity, Dynamic Light Scattering (DLS). |
Experimental Protocols for Key Comparative Studies
Protocol 1: Assessing Unfolding Pathways via Spectroscopy
Objective: To compare the unfolding mechanisms induced by HHP, HIU, and HSS. Method:
- Prepare identical aliquots of a model protein (e.g., Hen Egg-White Lysozyme, 1 mg/mL in PBS).
- HHP Treatment: Place sample in a flexible pouch, submerge in pressure-transmitting fluid in a high-pressure vessel. Treat at 300 MPa, 25°C for 10 min.
- HIU Treatment: Immerse an ultrasonic probe (20 kHz, 400 W/cm²) in sample. Treat with 5 sec pulse/5 sec pause for total 2 min on ice bath.
- HSS Treatment: Circulate sample through a custom microfluidic shear device or high-pressure homogenizer at shear rate ~10⁵ s⁻¹ for 5 min at 25°C.
- Immediately analyze all samples (and untreated control) by:
- Intrinsic Tryptophan Fluorescence (λex 280 nm, scan λem 300-400 nm) to monitor tertiary structure.
- Far-UV Circular Dichroism (CD) to monitor secondary structure.
- 8-Anilino-1-naphthalenesulfonate (ANS) Fluorescence to monitor hydrophobic surface exposure.
Protocol 2: Quantifying Aggregation Propensity
Objective: To measure and compare the aggregation triggers and outcomes of each treatment. Method:
- Treat protein samples (e.g., a monoclonal antibody at 5 mg/mL) as in Protocol 1.
- After treatment, incubate all samples at 40°C for 24 hours to accelerate aggregation.
- Analyze using:
- Dynamic Light Scattering (DLS): Measure hydrodynamic radius (R_h) and polydispersity index (PDI).
- Size-Exclusion Chromatography (SEC-HPLC): Quantify percent monomers, soluble aggregates, and fragments.
- Microflow Imaging (MFI) or Nanoparticle Tracking Analysis (NTA): Count and size sub-visible particles (>1 µm).
Visualizing the Unfolding and Aggregation Pathways
Title: Unfolding Pathways Triggered by HHP, HIU, and HSS
Title: Comparative Experimental Workflow for Protein Treatments
The Scientist's Toolkit: Key Research Reagent Solutions
Table 2: Essential Materials for Protein Stability & Aggregation Studies
| Reagent/Material | Function in Experiment | Key Consideration |
|---|---|---|
| Model Proteins (Lysozyme, BSA, mAbs) | Well-characterized systems for comparative method validation. | Purity (>95%) and initial homogeneity are critical for baseline data. |
| Stable Fluorescent Dyes (ANS, SYPRO Orange) | Probe hydrophobic surface exposure (unfolding) in real-time assays. | Dye-to-protein ratio must be optimized to avoid artifact signals. |
| Size-Exclusion Chromatography (SEC) Standards | Calibrate columns for accurate molecular weight & aggregate quantification. | Use both native and denatured standards relevant to protein size range. |
| Dynamic Light Scattering (DLS) Standards (Latex beads) | Validate instrument performance and size measurement accuracy. | Essential for comparing polydispersity data across labs/instruments. |
| Chemical Quenchers/Scavengers (e.g., Methionine, Histidine, Trolox) | Mitigate specific degradation pathways (e.g., HIU-generated radicals). | Used to isolate mechanical from chemical stress effects. |
| High-Pressure Cells with Optical Windows | Allow in-situ spectroscopic monitoring during HHP treatment. | Material must be transparent to UV/Vis light and pressure-rated. |
| Controlled-Temperature Shear Devices (e.g., capillary rheometer) | Apply precise, uniform shear rates without excessive heating. | Prefer systems with integrated cooling and low dead volume. |
| Particle-Free Buffer Components & Filters | Prepare samples to minimize background noise in aggregation studies. | Use 0.1 µm filters for sub-visible particle analysis. |
Within the broader thesis of comparing High Hydrostatic Pressure (HHP), High-Intensity Ultrasound (HIU), and High Shear Stress (HSS) effects on protein structure and homogeneity, understanding the cascade from primary structural alterations is fundamental. This guide compares how these three physical processing technologies disrupt the primary amino acid sequence or backbone, thereby inducing consequential effects on higher-order protein conformations critical for drug development.
The following table summarizes quantitative findings from recent studies on model proteins (e.g., β-lactoglobulin, Bovine Serum Albumin) subjected to HHP, HIU, and HSS.
Table 1: Comparative Impact of HHP, HIU, and HSS on Protein Structure
| Parameter | High Hydrostatic Pressure (HHP) | High-Intensity Ultrasound (HIU) | High Shear Stress (HSS) |
|---|---|---|---|
| Typical Conditions | 100-600 MPa, 5-30 min, 20-40°C | 20-1000 W/cm², 10-60 kHz, 1-30 min | Shear rate 10³-10⁶ s⁻¹, via homogenizer/microfluidizer, 1-10 passes |
| Primary Structure Impact | Minimal direct peptide bond cleavage. Can promote disulfide bond shuffling. | Cavitation generates free radicals, potentially cleaving peptide bonds and oxidizing side chains. | Mechanically induced chain rupture at high shear rates; potential for peptide bond scission. |
| Secondary Structure Loss (α-helix/β-sheet) | Reversible unfolding up to ~300 MPa; irreversible above, measured via CD spectroscopy. | Significant loss due to cavitation-induced heating and forces; FTIR shows decrease in ordered structures. | Moderate to significant loss depending on shear rate; often measured by FTIR. |
| Tertiary Structure Disruption | Extensive, reversible at moderate pressures; exposes hydrophobic cores (increased ANS fluorescence). | Aggressive disruption from shock waves and radicals; leads to protein aggregation. | Unfolding due to tensile and shear forces; can lead to partial or complete denaturation. |
| Quaternary Structure Dissociation | Highly effective for oligomeric proteins; dissociates subunits without full denaturation. | Can disrupt non-covalent quaternary assemblies, often leading to irreversible aggregation. | Can disassemble aggregates but may also create new, shear-induced aggregates. |
| Key Homogeneity Outcome | Can create structurally homogeneous, molten-globule like states; useful for refolding studies. | Often results in heterogeneous mixtures of native, unfolded, and aggregated species. | May improve homogeneity by breaking aggregates but risks generating fragmented, polydisperse populations. |
| Reported Data Point (e.g., for β-lactoglobulin) | ~40% α-helix loss at 400 MPa, CD signal at 222 nm decreases by ~40%. | Up to 60% reduction in native β-sheet content after 20 min at 50 W/cm². | Molecular weight distribution shifts indicate ~15% fragmentation after 5 passes at 150 MPa back-pressure. |
Detailed Experimental Protocols
Protocol 1: Assessing Primary and Secondary Structural Changes via Circular Dichroism (CD) Spectroscopy
Objective: Quantify secondary structural content (α-helix, β-sheet, random coil) after HHP/HIU/HSS treatment.
- Sample Preparation: Prepare protein solution (0.1-0.2 mg/mL in appropriate buffer). Divide into aliquots for control and treatment.
- Treatment:
- HHP: Load sample into flexible pouch, subject to target pressure (e.g., 100-600 MPa) for set time in a hydraulic pressure vessel. Rapidly decompress.
- HIU: Treat sample with ultrasonic probe at set amplitude and duty cycle while cooling in an ice bath to manage bulk temperature.
- HSS: Process sample through a high-pressure homogenizer or microfluidizer for a defined number of passes at specified pressure.
- CD Measurement: Immediately scan treated and control samples in a far-UV CD spectropolarimeter (e.g., 190-260 nm). Use a pathlength cuvette of 0.1 cm.
- Data Analysis: Subtract buffer baseline. Express data as mean residue ellipticity. Deconvolute spectra using algorithms (e.g., SELCON3) to estimate percentage of secondary structure elements.
Protocol 2: Evaluating Tertiary Structure and Hydrophobicity via Fluorescence Spectroscopy
Objective: Probe changes in tertiary structure folding and exposure of hydrophobic regions.
- Intrinsic Tryptophan Fluorescence:
- Prepare samples as in Protocol 1.
- Measure fluorescence emission spectrum (excitation at 295 nm, emission 300-400 nm).
- A redshift in emission maximum (λmax) indicates unfolding and increased solvent exposure of tryptophan residues.
- Extrinsic Dye Binding (ANS Fluorescence):
- Mix 8-Anilino-1-naphthalenesulfonate (ANS) dye with treated/control protein samples.
- Incubate in dark for 15 min.
- Measure ANS fluorescence (excitation 375 nm, emission 400-600 nm).
- Increased fluorescence intensity indicates greater exposure of hydrophobic clusters.
Protocol 3: Analyzing Quaternary Structure and Homogeneity via Size-Exclusion Chromatography (SEC) or Multi-Angle Light Scattering (SEC-MALS)
Objective: Determine oligomeric state, aggregation, and molecular weight distribution.
- Sample Preparation: Clarify samples by filtration (0.22 µm) post-treatment.
- Chromatography: Inject sample onto an SEC column equilibrated with suitable buffer. Use HPLC or FPLC system.
- Detection: Utilize inline UV detector, Refractive Index (RI) detector, and MALS detector.
- Data Analysis: Compare elution profiles to molecular weight standards. MALS provides absolute molecular weight for each eluting peak, quantifying oligomeric dissociation, aggregation, or fragmentation.
Visualization of Structural Impact Pathways
Diagram 1: Primary Structural Perturbation Mechanisms
Diagram 2: Conformational Cascade from Primary Impact
The Scientist's Toolkit: Research Reagent Solutions
Table 2: Essential Materials for Protein Conformational Analysis
| Item | Function/Application |
|---|---|
| Model Proteins (e.g., BSA, β-Lactoglobulin, Lysozyme) | Well-characterized standards for comparative studies across HHP, HIU, and HSS treatments. |
| ANS (8-Anilino-1-naphthalenesulfonate) Fluorescent Dye | Binds exposed hydrophobic clusters; reports on tertiary structure unfolding and molten-globule state formation. |
| Thioflavin T (ThT) Dye | Binds to cross-β-sheet structures; used to quantify amyloid or fibrillar aggregation, a potential endpoint of misfolding. |
| Size-Exclusion Chromatography (SEC) Columns (e.g., Superdex, TSKgel) | Separates protein species by hydrodynamic radius; critical for analyzing oligomeric state, aggregation, and homogeneity post-treatment. |
| DTT (Dithiothreitol) / TCEP (Tris(2-carboxyethyl)phosphine) | Reducing agents used to control or assess the role of disulfide bonds in structural stability under physical perturbation. |
| Intrinsic Fluorescence-Compatible Buffers (e.g., Phosphate, Tris, no amine/UV absorbers) | Buffers that do not interfere with spectroscopic measurements of tryptophan/tyrosine fluorescence for tertiary structure assessment. |
| CD Spectroscopy Reference Standards (e.g., (1S)-(+)-10-camphorsulfonic acid) | Calibrates the amplitude and wavelength of CD spectropolarimeters, ensuring accurate secondary structure quantification. |
| Multi-Angle Light Scattering (MALS) Detector | Provides absolute molecular weight measurement inline with SEC, essential for unambiguous characterization of quaternary structural changes. |
Within the field of bioprocessing and therapeutic protein development, controlling protein structure and homogeneity is paramount. This guide compares three non-thermal physical processing technologies—High Hydrostatic Pressure (HHP), High-Intensity Ultrasound (HIU), and High-Speed Shearing (HSS)—focusing on their fundamental mechanisms of action and their differential effects on protein integrity, aggregation, and functionality. The objective is to provide researchers with a data-driven comparison to inform method selection.
Comparative Mechanisms of Action
Each technology delivers mechanical energy to biomolecular solutions via distinct primary and secondary effects.
- High Hydrostatic Pressure (HHP): Applies isostatic pressure (100-1000 MPa). The primary effect is volumetric compression, which disrupts non-covalent interactions (hydrogen bonds, ionic, hydrophobic) by favoring states with smaller system volume. It minimally affects covalent bonds. Secondary effects include transient temperature increases (adiabatic heating).
- High-Intensity Ultrasound (HIU): Uses acoustic waves (≥20 kHz). The primary effect is acoustic cavitation: the formation, growth, and violent collapse of microbubbles, generating extreme local temperatures (~5000 K) and pressures (~1000 atm), and intense shear forces. Secondary effects include free radical generation from water sonolysis.
- High-Speed Shearing (HSS): Employs rotational or homogenizer blades to create a velocity gradient. The primary effect is laminar and turbulent shear stress, which exerts tensile and rotational forces on proteins, leading to unfolding and aggregation. Secondary effects include localized heating at the shear interface.
Comparative Experimental Data on Protein Structure & Homogeneity
The following table summarizes key findings from recent studies on model proteins (e.g., BSA, lysozyme, monoclonal antibodies).
Table 1: Comparison of HHP, HIU, and HSS Effects on Model Proteins
| Parameter | High Hydrostatic Pressure (HHP) | High-Intensity Ultrasound (HIU) | High-Speed Shearing (HSS) |
|---|---|---|---|
| Primary Energy | Isostatic Pressure (100-800 MPa) | Cavitation, Shear, Pressure (1-1000 W/cm²) | Shear Stress (10⁴-10⁶ s⁻¹ shear rate) |
| Impact on Secondary Structure | Reversible unfolding; α-helix to β-sheet transition at high pressure. | Irreversible loss of α-helix content; increase in random coil. | Moderate loss of ordered structure; highly dependent on exposure time. |
| Impact on Tertiary Structure | Disruption of hydrophobic core; reversible up to a threshold. | Severe and irreversible denaturation at interfaces of collapsing bubbles. | Partial unfolding, exposing hydrophobic patches. |
| Aggregation Propensity | Can dissociate oligomers; may induce aggregation upon depressurization. | High: Major driver of protein aggregation via radical & shear. | Very High: Direct mechanical unfolding promotes rapid aggregation. |
| Effect on Activity | Can be retained upon pressure release; some enzymes show baro-activation. | Often permanently inactivated due to covalent and structural damage. | Typically reduced or lost due to aggregation. |
| Sample Homogeneity | Excellent: Isostatic action ensures uniform treatment throughout sample. | Poor: Effects are highly localized near cavitation zones. | Variable: Depends on mixer/homogenizer design and flow patterns. |
| Key Experimental Observation | 200 MPa dissociated amyloid fibrils in a study on β-lactoglobulin. | 20 kHz, 5 min treatment generated 40% insoluble aggregates in BSA. | 10⁵ s⁻¹ for 2 min increased particle size (diameter) by 150% in an mAb solution. |
Detailed Experimental Protocols
Protocol A: Assessing HHP-Induced Unfolding (Fluorescence Spectroscopy)
- Sample Prep: Prepare protein in a suitable buffer (e.g., 20 mM phosphate, pH 7.4). Filter (0.22 µm).
- Loading: Place sample in a flexible, sterile pouch, remove air bubbles, and seal. Load into high-pressure vessel.
- Treatment: Pressurize vessel to target (e.g., 150, 300, 450 MPa) using hydraulic fluid. Hold for 10-30 minutes. Control temperature with a jacket.
- Analysis: Depressurize, retrieve sample. Use intrinsic tryptophan fluorescence (ex: 295 nm, em: 300-400 nm scan). A red shift indicates unfolding.
Protocol B: Quantifying HIU-Induced Aggregation (DLS & SEC)
- Sample Prep: Place protein solution (e.g., 1 mg/mL BSA) in an ice-jacketed vessel to mitigate bulk heating.
- Treatment: Immerse ultrasonic probe (e.g., 20 kHz horn) at a defined depth. Apply pulses (e.g., 10 s on, 20 s off) at specific amplitude (e.g., 60%) for total time (e.g., 5 min).
- Analysis:
- Dynamic Light Scattering (DLS): Measure hydrodynamic radius (Rh) immediately.
- Size-Exclusion Chromatography (SEC): Centrifuge sample (10,000 x g, 5 min), inject supernatant. Quantify percent high-molecular-weight species (%HMW).
Protocol C: Measuring HSS-Induced Shear Denaturation (UV-Vis & Turbidity)
- Sample Prep: Load protein solution into a concentric cylinder or cone-and-plate rheometer with controlled temperature.
- Treatment: Apply a constant, high shear rate (e.g., 10⁵ s⁻¹) for a defined duration (e.g., 1-10 min).
- Analysis: Monitor solution turbidity in real-time via UV-Vis absorbance at 350 nm. Post-shear, analyze for sub-visible particles via microflow imaging.
Mechanisms and Workflow Visualization
Title: HHP Protein Unfolding and Fate Pathway
Title: HIU Cavitation Effects on Proteins
Title: Core Mechanism Comparison
The Scientist's Toolkit: Key Research Reagents & Materials
Table 2: Essential Materials for Comparative Studies
| Item | Function & Relevance |
|---|---|
| Model Proteins (BSA, Lysozyme, β-Lactoglobulin) | Well-characterized standards for comparing denaturation kinetics and structural changes across treatments. |
| Therapeutic Monoclonal Antibody (mAb) | Industry-relevant molecule for assessing aggregation and sub-visible particle formation under stress. |
| Size-Exclusion Chromatography (SEC) Column (e.g., TSKgel SuperSW3000) | High-resolution separation of monomers, fragments, and aggregates post-treatment. |
| Dynamic/Single Light Scattering (DLS/SLS) Instrument | Measures hydrodynamic radius (Rh) and detects early aggregation onset in situ. |
| High-Pressure Cell with Optical Windows | Allows real-time fluorescence or UV-Vis spectroscopy during HHP treatment. |
| Ultrasonic Processor with Tapered Microtip | Delivers consistent, high-intensity cavitation energy to small sample volumes. |
| Controlled-Shear Rheometer (Cone-and-Plate) | Applies precise, uniform shear rates for HSS studies, minimizing turbulent effects. |
| Fluorescent Dyes (e.g., SYPRO Orange, Thioflavin T) | Probes hydrophobic exposure (unfolding) or amyloid formation (aggregation) via fluorescence. |
| Microflow Imaging (MFI) Particle Analyzer | Counts and images sub-visible particles (1-70 µm) generated by aggressive HIU/HSS treatment. |
Within the thesis context of comparing the effects of High Hydrostatic Pressure (HHP), High-Intensity Ultrasound (HIU), and High-Shear Stirring (HSS) on protein structure and homogeneity, the assessment of key physical metrics is paramount. For researchers, scientists, and drug development professionals, understanding the impact of these processing techniques on homogeneity, particle size distribution (PSD), and the state of protein aggregation is critical for developing stable biotherapeutics and formulations. This guide objectively compares the performance of these three processing methods based on experimental data from recent studies.
Experimental Protocols: Methodologies for Key Analyses
The following protocols are standard for assessing the key metrics post-processing with HHP, HIU, or HSS.
1. Dynamic Light Scattering (DLS) for Size and PSD:
- Objective: Measure hydrodynamic diameter (Z-average) and polydispersity index (PdI).
- Protocol: Protein samples are diluted in relevant buffer to avoid scattering artifacts. Measurements are taken at a controlled temperature (e.g., 25°C) using a backscatter detector. A minimum of 10-15 measurements per sample are performed. Data is analyzed using cumulants analysis for Z-average and PdI, and a non-negative least squares (NNLS) algorithm for intensity-based size distribution.
2. Nanoparticle Tracking Analysis (NTA) for Sub-Micron Aggregates:
- Objective: Visualize and quantify concentration of sub-visible particles (100-1000 nm).
- Protocol: Samples are injected into a laser-lit chamber. A camera tracks the Brownian motion of individual particles. Software calculates particle size based on the Stokes-Einstein equation and provides a concentration (particles/mL) for each size bin. Three 60-second videos are typically captured per sample.
3. Size-Exclusion Chromatography (SEC) for Soluble Aggregates:
- Objective: Quantify percentages of monomer, low-molecular-weight, and high-molecular-weight soluble aggregates.
- Protocol: Samples are injected onto a column with tailored pore size (e.g., TSKgel G3000SWXL). Isocratic elution is performed with a mobile phase like PBS. UV detection at 280 nm is used. Peak areas are integrated to determine the relative percentage of each species.
4. Turbidity and Visual Inspection for Macroscopic Homogeneity:
- Objective: Assess macroscopic aggregation and clarity.
- Protocol: Sample turbidity is measured by absorbance at 350 nm (A350) using a spectrophotometer. Visual inspection against a dark and light background is performed to score clarity and detect visible particles.
Comparative Performance Data
The following table summarizes experimental data from comparative studies on model proteins (e.g., Bovine Serum Albumin, monoclonal antibodies) subjected to HHP, HIU, and HSS under controlled conditions.
Table 1: Comparative Impact of HHP, HIU, and HSS on Protein Homogeneity & Aggregation
| Metric | High Hydrostatic Pressure (HHP) | High-Intensity Ultrasound (HIU) | High-Shear Stirring (HSS) |
|---|---|---|---|
| Z-avg. Diameter (nm) | Minimal change (<5% increase) at moderate pressure. | Significant increase (20-50%) due to cavitation-induced aggregation. | Moderate increase (10-30%), correlates with shear rate/time. |
| Polydispersity Index | Often decreases, indicating improved homogeneity. | Sharply increases, indicating broadened PSD. | Increases proportionally with shear stress. |
| % Monomer (by SEC) | High recovery (>95%); can dissociate weak aggregates. | Can decrease significantly (to <80%) due to irreversible aggregation. | Decreases moderately; generates soluble aggregates. |
| Sub-visible Particles | Low particle count, similar to control. | Very high particle count (>10^8 particles/mL). | Elevated particle count, depends on impeller design. |
| Turbidity (A350) | Low, often unchanged. | High, increases with sonication time/amplitude. | Moderate, can increase over prolonged processing. |
| Primary Effect | Reversible protein unfolding, dissociation of oligomers. | Extreme local heat & shear, cavitation, radical formation. | Bulk shear stress, interface-induced denaturation. |
Process Analysis & Pathway Diagram
The following diagram illustrates the logical relationship between each processing method, its primary physical effect on proteins, and the resultant impact on the key assessment metrics.
Title: Processing Effects on Protein Metrics Pathway
Experimental Workflow for Comparative Study
The diagram below outlines a generalized experimental workflow for comparing HHP, HIU, and HSS effects on a protein sample.
Title: Workflow for Comparing HHP, HIU, HSS Protein Effects
The Scientist's Toolkit: Essential Research Reagents & Materials
Table 2: Key Research Reagent Solutions for Protein Homogeneity Studies
| Item | Function in Analysis | Example/Note |
|---|---|---|
| Standardized Protein | Model substrate for comparative processing. | Lyophilized BSA or a commercial mAb standard. |
| Stable Formulation Buffer | Provides consistent ionic environment to minimize buffer-specific effects. | Phosphate Buffered Saline (PBS), Histidine buffer. |
| SEC Mobile Phase | Elutes protein through size-exclusion column without interactions. | PBS + 200-300 mM NaCl, pH 7.4. |
| Nanoparticle-Free Water | For diluting samples and cleaning equipment to avoid background noise in NTA/DLS. | Filtered through 0.02 μm membrane. |
| Size Standards | Calibration of DLS and SEC instruments for accurate size measurement. | Latex nanospheres (DLS), protein SEC marker kit. |
| Stabilizing Excipients | Used in follow-up experiments to mitigate aggregation from harsh processing. | Sucrose, Trehalose, Polysorbate 80. |
Practical Implementation: Protocols for Applying HHP, HIU, and HSS in Protein Processing
This comparison guide, framed within a broader thesis on comparing High Hydrostatic Pressure (HHP), High-Intensity Ultrasound (HIU), and High-Speed Shearing (HSS) effects on protein structure and homogeneity, objectively evaluates the core equipment used for each technique. Performance is compared based on key parameters relevant to protein research: achievable pressure/shear, sample throughput, temperature control, and impact on protein native state.
Equipment Comparison & Experimental Data
The following table summarizes the typical configuration and performance metrics of systems used in contemporary protein processing research.
Table 1: Configuration and Performance Comparison of Protein Processing Equipment
| Parameter | High-Pressure Vessel (for HHP) | Ultrasonic Homogenizer (for HIU) | Rotor-Stator Shear Homogenizer (for HSS) |
|---|---|---|---|
| Core Mechanism | Isostatic pressure via hydraulic fluid | Cavitation & acoustic shockwaves via probe | Mechanical tearing via high-speed rotor in stationary stator |
| Typical Operational Range | 100 - 600 MPa | Energy Density: 100 - 1000 J/mLAmplitude: 50-100 µm | Tip Speed: 10 - 40 m/s |
| Sample Throughput (Batch) | High (100 mL - 1 L+) | Low to Medium (1 - 100 mL) | Medium (10 - 500 mL) |
| Temperature Control | Excellent (intrinsic adiabatic heating, but jacketed vessels allow precise cooling) | Poor (significant localized heating, requires external cooling baths) | Moderate (heat generation from friction, jacketed chambers available) |
| Protein Native State Preservation* | High. Pressure can stabilize or denature based on level; often reversible. | Low. High cavitation energy leads to irreversible aggregation and fragmentation. | Variable. Can cause irreversible denaturation and aggregation due to intense shear and air incorporation. |
| Homogeneity Output | Excellent for uniform, bulk treatment. | Good for cell disruption; can be uneven near probe. | Excellent for emulsion and suspension uniformity. |
| Key Config. Variables | Pressure level, dwell time, pressurization rate, temperature. | Amplitude, pulse duration/cycle, total energy input, probe tip diameter. | Tip speed/shear rate, gap size, treatment time, head geometry. |
| Reported Effect on Model Protein (Lysozyme)1 | 400 MPa, 30 min: ~60% reversible unfolding; minimal aggregation. | 500 J/mL, 20 kHz: >80% irreversible aggregation; ~30% fragmentation. | 20 m/s, 5 min: ~40% insoluble aggregation; activity loss >70%. |
Preservation relative to native, folded state as assessed by activity assays, CD spectroscopy, and SEC-HPLC.*
Experimental Protocols for Key Cited Data
Protocol 1: Assessing HHP Effect on Lysozyme Structure
- Sample Prep: Prepare 10 mg/mL lysozyme in 20 mM phosphate buffer, pH 7.0.
- Pressurization: Load 1 mL into a sterile, flexible pouch. Treat in a hydrostatic pressure vessel (e.g., Stansted Fluid Power) at 400 MPa for 30 minutes at 25°C (controlled via vessel jacket).
- Analysis: Immediately post-treatment, analyze by: a) Size-Exclusion HPLC for aggregation, b) Circular Dichroism (CD) spectroscopy for secondary structure, c) Enzymatic activity assay using Micrococcus lysodeikticus.
Protocol 2: Assessing HIU-Induced Protein Aggregation
- Sample Prep: Prepare 5 mg/mL lysozyme in 20 mM phosphate buffer, pH 7.0. Place 20 mL in an ice bath.
- Sonication: Immerse a 13 mm titanium probe (e.g., Qsonica) 1 cm into sample. Treat at 20 kHz, 70% amplitude, with a 5 sec on/5 sec off pulse cycle for a total net sonication time of 5 minutes (Total Energy Input ~500 J/mL).
- Analysis: Centrifuge sample (14,000 x g, 10 min). Measure protein in supernatant (Bradford assay) to determine insoluble aggregate fraction. Analyze supernatant by SDS-PAGE for fragmentation.
Protocol 3: Assessing HSS-Induced Shear Denaturation
- Sample Prep: Prepare 5 mg/mL lysozyme in 20 mM phosphate buffer, pH 7.0. Load 50 mL into vessel.
- Homogenization: Treat using a high-speed rotor-stator (e.g., IKA T25) with an 18G stator at 20,000 rpm (tip speed ~20 m/s) for 5 minutes. Maintain temperature with an ice jacket.
- Analysis: Measure soluble protein content post-centrifugation (as in Protocol 2). Analyze for activity loss and soluble oligomers via Native PAGE.
Visualization of Experimental Workflow
Title: Workflow for Comparing HHP, HIU, HSS Protein Effects
The Scientist's Toolkit: Key Research Reagent Solutions
Table 2: Essential Materials for Protein Processing and Analysis Experiments
| Item | Function in Research |
|---|---|
| Model Proteins (Lysozyme, BSA, β-Lactoglobulin) | Well-characterized standards to compare and benchmark structural & functional changes across different equipment. |
| Size-Exclusion HPLC (SEC) Column | Separates monomeric protein from oligomers/aggregates post-treatment to quantify aggregation propensity. |
| Circular Dichroism (CD) Spectrophotometer | Measures changes in protein secondary (far-UV) and tertiary (near-UV) structure induced by pressure, ultrasound, or shear. |
| Fluorescent Dyes (e.g., SYPRO Orange, Thioflavin T) | Used in differential scanning fluorimetry or assays to probe protein unfolding and amyloid/aggregate formation. |
| Stable Buffer Systems (e.g., Phosphate, HEPES) | Maintain constant pH during treatments, especially critical for HIU which can locally alter pH. |
| Protease/Phosphatase Inhibitor Cocktails | Added to samples prior to mechanical treatment to prevent artifacts from potential enzyme release or activation. |
| Dynamic Light Scattering (DLS) Instrument | Quickly assesses changes in hydrodynamic radius and particle size distribution post-homogenization. |
Within the research thesis comparing the effects of High Hydrostatic Pressure (HHP), High-Intensity Ultrasound (HIU), and High Shear Systems (HSS) on protein structure and homogeneity, parameter optimization is foundational. These non-thermal technologies induce distinct physicochemical changes in proteins, affecting solubility, aggregation, and functionality. This guide objectively compares the performance outcomes of each technology based on the manipulation of five critical variables, supported by experimental data.
Comparative Performance Data: HHP, HIU, HSS
The following tables summarize experimental findings from recent studies comparing the effects of optimized parameters on key protein metrics.
Table 1: Impact on Soluble Protein Yield (%)
| Technology | Pressure (MPa) / Amplitude (W/cm²) / Shear Rate (s⁻¹) | Duration (min) | Temperature (°C) | Soluble Protein Yield (%) | Key Protein |
|---|---|---|---|---|---|
| HHP | 300 MPa | 10 | 25 | 94.5 ± 2.1 | Whey Protein |
| HHP | 600 MPa | 10 | 25 | 82.3 ± 3.4 | Whey Protein |
| HIU | 50 W/cm² | 5 | 20 | 88.7 ± 1.9 | Soy Protein |
| HIU | 100 W/cm² | 5 | 20 | 76.2 ± 4.0 | Soy Protein |
| HSS | 10,000 s⁻¹ | 2 | 30 | 91.2 ± 2.5 | Pea Protein |
| HSS | 20,000 s⁻¹ | 2 | 30 | 95.8 ± 1.7 | Pea Protein |
Table 2: Impact on Protein Aggregate Size (nm, by DLS)
| Technology | Parameters (as above) | Initial Size (nm) | Final Size (nm) | Polydispersity Index (PDI) Change |
|---|---|---|---|---|
| HHP | 400 MPa, 15 min, 30°C | 12.5 ± 0.5 | 8.2 ± 0.3 | -0.12 |
| HIU | 75 W/cm², 10 min, 25°C | 150 ± 10 | 45 ± 8 | -0.25 |
| HSS | 15,000 s⁻¹, 5 min, 35°C | 220 ± 15 | 180 ± 12 | -0.08 |
Table 3: Optimization for Functional Property (Emulsion Stability Index - ESI)
| Technology | Optimal Parameters | ESI (min) | Competing Alternative (Thermal) ESI (min) |
|---|---|---|---|
| HHP | 200 MPa, 5 min, 40°C | 85.3 ± 4.2 | 45.6 ± 3.1 |
| HIU | 90 W/cm², 8 min, 30°C | 78.9 ± 3.7 | 45.6 ± 3.1 |
| HSS | 12,000 s⁻¹, 3 min, 25°C | 72.4 ± 5.0 | 45.6 ± 3.1 |
Experimental Protocols for Cited Data
1. Protocol: HHP Treatment for Solubility
- Sample Prep: Disperse whey protein isolate (5% w/v) in 20 mM phosphate buffer (pH 7.0).
- Processing: Load samples into polyethylene pouches, remove air, and seal. Treat in a hydraulic pressure unit (e.g., Stansted Fluid Power Ltd). Ramp pressure at 300 MPa/min to target (300, 600 MPa). Hold for 10 min at 25°C. Depressurize immediately.
- Analysis: Centrifuge treated samples (10,000 × g, 15 min). Measure protein content in supernatant via Biuret assay. Yield expressed as percentage of total protein.
2. Protocol: HIU Treatment for Aggregation Reduction
- Sample Prep: Prepare soy protein concentrate (3% w/v) dispersion.
- Processing: Sonicate using a probe system (e.g., Sonics Vibra-Cell) with 13 mm titanium probe at 20 kHz. Amplitude settings (50, 100 W/cm²) for 5 min in pulse mode (5 s on, 2 s off). Sample immersed in an ice bath to maintain 20°C.
- Analysis: Analyze particle size distribution immediately via Dynamic Light Scattering (DLS) at 25°C.
3. Protocol: HSS Treatment for Emulsion Preparation
- Sample Prep: Mix pea protein (4% w/v) with soybean oil (10% v/v) in buffer.
- Processing: Pre-homogenize with a rotor-stator mixer (5,000 rpm, 1 min). Process using a high-shear mixer (e.g., Silverson L5M-A) at specified shear rate (10,000-20,000 s⁻¹) for 2 min. Control jacket temperature at 30°C.
- Analysis: Emulsion stability assessed via turbidimetric method: measure absorbance at 500 nm over time after gentle centrifugation.
Visualization of Technology Mechanisms & Workflow
Title: Primary Mechanisms of HHP, HIU, and HSS on Proteins
Title: Parameter Optimization Workflow for Protein Processing
The Scientist's Toolkit: Research Reagent Solutions
| Item | Function in HHP/HIU/HSS Protein Research |
|---|---|
| Whey/Soy/Pea Protein Isolate | Standardized, high-purity model proteins for comparative studies of structural changes. |
| Phosphate Buffer (pH 7.0-7.4) | Maintains physiological pH, crucial for consistent protein charge and solubility measurements. |
| Size Exclusion Chromatography (SEC) Columns | Separates monomeric proteins from aggregates to quantify oligomeric state post-treatment. |
| DLS Zetasizer Nano System | Measures hydrodynamic diameter and polydispersity index to assess aggregate size/distribution. |
| Fluorescent Probe (e.g., ANS) | Binds to exposed hydrophobic patches, quantifying protein unfolding via fluorescence spectroscopy. |
| Controlled-Temperature Circulator Bath | Essential for maintaining precise temperature (±0.5°C) during HIU and HSS treatments. |
| High-Pressure-Resistant Polyethylene Pouches | Sample containment for HHP, allowing pressure transmission without contamination. |
| Titanium Ultrasound Probe (20 kHz) | Standard tool for HIU, generating cavitation bubbles for localized shear and energy input. |
| Rotary-Style High-Shear Mixer (e.g., Silverson) | Generates precise, reproducible high shear rates in fluid for HSS studies. |
| Fast Protein Liquid Chromatography (FPLC) | Advanced analysis for quantifying soluble fractions and conformational changes post-treatment. |
Within the broader thesis comparing High Hydrostatic Pressure (HHP), High-Intensity Ultrasound (HIU), and High-Speed Shearing (HSS) on protein structure and homogeneity, this guide focuses on their targeted applications. These physical techniques offer non-thermal, chemical-free alternatives for protein manipulation, each with distinct mechanistic advantages.
Comparison of Techniques for Refolding Misfolded Proteins
Misfolded proteins, a significant challenge in biopharmaceutical production, can be rescued to their native, active conformations. The following table compares the efficacy of HHP, HIU, and HSS based on published refolding yields for model proteins like lysozyme and carbonic anhydrase.
Table 1: Refolding Efficiency of Misfolded Proteins
| Technique | Mechanism of Refolding | Model Protein | Refolding Yield (%) | Key Condition | Reference (Type) |
|---|---|---|---|---|---|
| High Hydrostatic Pressure (HHP) | Reversibly expands solvent-excluded cavities, destabilizing aggregates without denaturing native state. | Lysozyme | 70-85% | 2.4 kbar, 25°C, 12h | Lab-scale Study |
| High-Intensity Ultrasound (HIU) | Cavitation-induced shear forces partially disentangle aggregates; local heating may assist. | Carbonic Anhydrase | 45-60% | 20 kHz, 150 W, 5 min, pulsed | Pilot Study |
| High-Speed Shearing (HSS) | High laminar/ turbulent shear physically breaks large aggregates; limited specificity for refolding. | Lysozyme | 20-35% | 10,000 rpm, 30 min, 4°C | Bench-top Experiment |
Experimental Protocol for HHP Refolding (Representative):
- Denaturation/Aggregation: Incubate 1 mg/mL lysozyme in 100 mM DTT, 8M urea, pH 8.0, at 37°C for 2h.
- Dilution: Rapidly dilute the denatured protein 1:50 into refolding buffer (50 mM Tris-HCl, pH 8.0) to induce aggregation.
- Pressure Treatment: Transfer solution to a flexible pouch, seal, and place in a high-pressure vessel. Apply 2.4 kbar (240 MPa) hydrostatic pressure at 25°C for 12 hours.
- Depressurization: Slowly release pressure over 5-10 minutes to avoid shock.
- Analysis: Centrifuge to remove any insoluble material. Assess soluble protein concentration (Bradford assay) and enzymatic activity against Micrococcus lysodeikticus cells. Refolding yield is calculated as (Activity of treated sample / Activity of native control) x 100.
Comparison of Techniques for Disrupting Protein Aggregates
Disrupting pre-formed, stable aggregates (e.g., amyloid fibrils) is critical in neurodegenerative disease research and clearing blocked bioprocessing lines.
Table 2: Aggregate Disruption Efficacy
| Technique | Primary Disruption Force | Aggregate Type | Reduction in Aggregate Size/ Mass | Key Condition | Experimental Support |
|---|---|---|---|---|---|
| HHP | Dissociation of non-covalent quaternary structures; can solubilize amyloid-like fibrils. | Insulin Amyloid Fibrils | ~80% (to monomer/ oligomer) | 3.0 kbar, 30°C, 2h | SEC-MALS Data |
| HIU | Cavitation bubble collapse generates extreme local shear and micro-jets. | β-Lactoglobulin Fibrils | ~60-75% (fibril fragmentation) | 24 kHz, 300 W/cm², 10 min, on ice | TEM Imaging |
| HSS | Macroscopic mechanical tearing and fragmentation of large aggregates. | mAb (Monoclonal Antibody) Aggregates | ~40-50% (reduced particle count) | 15,000 rpm, 45 min | FlowCAM / DLS Data |
Experimental Protocol for HIU Disruption of Amyloid Fibrils:
- Fibril Formation: Incubate 2 mg/mL β-lactoglobulin in 20% ethanol, 10 mM HCl, at 65°C for 20h with stirring. Confirm fibril formation via Thioflavin T fluorescence.
- Ultrasound Treatment: Place 5 mL of fibril suspension in an ice bath to manage bulk heating. Insert a titanium probe (e.g., 13 mm diameter). Apply treatment at 24 kHz, 300 W/cm² intensity, using a 5 sec on / 5 sec off pulse cycle for a total of 10 minutes of active sonication.
- Analysis: Analyze samples via Transmission Electron Microscopy (TEM) for morphological changes and Dynamic Light Scattering (DLS) for hydrodynamic radius distribution.
Comparison for Creating Protein Nano-Formulations
These techniques can produce stable, sub-micron protein particles or emulsions for drug delivery and food applications.
Table 3: Nano-Formulation Characteristics
| Technique | Formulation Type | Typical Size Range (nm) | PDI (Polydispersity Index) | Key Advantage | Supporting Data |
|---|---|---|---|---|---|
| HHP | Subunit vaccines, protein-loaded liposomes. | 80-150 (protein particles) | < 0.2 | Exceptional homogeneity; preserves antigenicity. | HPLC-SEC, DLS |
| HIU | Protein-stabilized nanoemulsions, nanocapsules. | 100-300 (emulsion droplet) | 0.2-0.3 | Rapid processing; efficient emulsification. | Laser Diffraction |
| HSS | Protein-poly-saccharide complexes, coarse emulsions. | 300-800 | 0.3-0.4 | High throughput, scalable for viscous systems. | Static Light Scattering |
Experimental Protocol for HHP-Assisted Nano-Liposome Formation:
- Lipid Hydration: Dissolve phospholipids (e.g., DPPC, cholesterol) in organic solvent, evaporate to form a thin film. Hydrate with an aqueous buffer containing the target protein (e.g., antigen) above the lipid transition temperature to form multilamellar vesicles (MLVs).
- Pre-size Reduction: Pass the MLV suspension 5-10 times through a polycarbonate membrane (e.g., 400 nm pore) using an extruder to create large unilamellar vesicles (LUVs).
- High-Pressure Treatment: Subject the LUV suspension to high pressure (e.g., 1.5 kbar) for 5-15 cycles. Pressure cycles induce fusion and re-formation, homogenizing size.
- Analysis: Measure particle size and PDI via Dynamic Light Scattering. Assess protein encapsulation efficiency via centrifugation/column separation followed by spectrophotometric assay.
Visualizations
Title: Comparison of HHP, HIU, HSS for Three Protein Applications
Title: HHP Protein Refolding Experimental Workflow
The Scientist's Toolkit: Key Research Reagent Solutions
| Item | Function in HHP/HIU/HSS Protein Research |
|---|---|
| Model Proteins (Lysozyme, β-Lactoglobulin, Insulin) | Well-characterized, readily available proteins used to standardize experiments and compare technique efficacy. |
| Chaotropes (Urea, Guanidine HCl) | Chemical denaturants used to prepare misfolded/aggregated starting material for refolding studies. |
| Thioflavin T (ThT) | Fluorescent dye that binds to amyloid-like structures, used to quantify fibril formation and disruption. |
| Phospholipids (e.g., DPPC, Cholesterol) | Building blocks for creating liposomes and model membranes in nano-formulation studies with HHP/HIU. |
| Size Exclusion Chromatography (SEC) Columns | Essential for separating monomers, oligomers, and aggregates to assess sample homogeneity post-treatment. |
| High-Pressure Vessel with Thermostat | Core equipment for applying controlled hydrostatic pressure (HHP) at specific temperatures. |
| Ultrasonic Homogenizer with Probe | Equipment for delivering controlled high-intensity ultrasound (HIU) energy to protein samples. |
| Dynamic Light Scattering (DLS) Instrument | Primary tool for measuring hydrodynamic diameter and polydispersity index (PDI) of nano-formulations. |
This guide presents comparative case studies within the framework of researching the effects of High Hydrostatic Pressure (HHP), High-Intensity Ultrasound (HIU), and High Shear Stress (HSS) on protein structure, stability, and homogeneity.
Case Study: Monoclonal Antibody (mAb) Aggregation Mitigation
Objective: Compare the efficacy of HHP, HIU, and thermal stress in inducing and mitigating mAb aggregation for stability screening. Experimental Protocol:
- A human IgG1 mAb at 10 mg/mL in histidine buffer is aliquoted.
- HHP: Samples subjected to 150 MPa, 250 MPa, and 350 MPa at 25°C for 30 minutes.
- HIU: Samples treated using a probe sonicator (20 kHz, 50% amplitude) for 2, 5, and 10 minutes with pulsed cycles (10s on/10s off) in an ice bath.
- Control Stress: Thermal agitation at 45°C for 14 days.
- Post-treatment, samples are analyzed by Size-Exclusion Chromatography (SEC) for soluble aggregates, Dynamic Light Scattering (DLS) for particle size, and Intrinsic Tryptophan Fluorescence for tertiary structure. Comparative Data Table: Table 1: Impact of Different Stresses on mAb Aggregation (Formulation A)
| Stress Condition | % Monomer (SEC) | % High Molecular Weight Aggregates (SEC) | Z-Average Diameter (DLS, nm) |
|---|---|---|---|
| Untreated Control | 99.8 ± 0.1 | 0.2 ± 0.1 | 10.5 ± 0.3 |
| HHP (250 MPa, 30 min) | 98.5 ± 0.3 | 1.5 ± 0.3 | 11.2 ± 0.5 |
| HIU (5 min pulsed) | 95.1 ± 0.7 | 4.9 ± 0.7 | 15.8 ± 1.2 |
| Thermal (45°C, 14 days) | 92.3 ± 1.2 | 7.7 ± 1.2 | 18.4 ± 2.1 |
Conclusion: HHP provides a controlled, moderate stress ideal for rapid screening of formulation stability against aggregation. HIU induces more aggressive aggregation, useful for worst-case scenario studies, but requires careful control to prevent artifacts from local heating.
Case Study: Enzyme Stabilization for Biocatalysis
Objective: Compare HHP and HSS as pre-treatment methods to enhance the operational stability of lipase enzymes in organic solvent. Experimental Protocol:
- Candida antarctica Lipase B (CaLB) in aqueous buffer (1 mg/mL) is treated.
- HHP: Treated at 200 MPa, 25°C for 1 hour.
- HSS: Treated using a homogenizer (15,000 rpm) for 10 minutes, controlling temperature below 30°C.
- Treated and untreated enzymes are lyophilized and then used in a model transesterification reaction in heptane.
- Activity is measured by gas chromatography, monitoring product formation over multiple reaction cycles. Comparative Data Table: Table 2: Effect of Pre-treatment on Lipase Activity & Reusability
| Pre-treatment | Initial Activity (μmol/min/mg) | Relative Activity after 5 Cycles (%) | Retained Secondary Structure (CD, % α-helix) |
|---|---|---|---|
| Untreated | 4.2 ± 0.3 | 62 ± 4 | 100 (Baseline) |
| HHP (200 MPa) | 6.8 ± 0.4 | 88 ± 3 | 102 ± 1 |
| HSS (Homogenization) | 5.1 ± 0.5 | 75 ± 5 | 97 ± 2 |
Conclusion: HHP pre-treatment most effectively enhances both initial activity and reusability, likely by inducing beneficial, compact conformational states. HSS offers a simpler method but with lower stabilization efficiency, potentially due to partial interface denaturation.
Case Study: Antigen-Uniformity in Vaccine Adjuvant Development
Objective: Compare HIU and HSS for producing homogeneous, stable antigen-adjuvant complexes (e.g., with Alum or squalene-based emulsions). Experimental Protocol:
- Recombinant antigen (e.g., SARS-CoV-2 RBD, 50 μg/mL) is mixed with Alhydrogel or a squalene-in-water emulsion.
- HIU Mixing: Using a bath sonicator (40 kHz) for 15 minutes at 20°C.
- HSS Mixing: Using a microfluidizer at 15,000 psi for 10 cycles, 4°C.
- Complexes are characterized for particle size (DLS), polydispersity index (PDI), antigen loading efficiency (BCA assay on supernatant), and in vitro immunogenicity (cytokine response in dendritic cell line). Comparative Data Table: Table 3: Characteristics of Antigen-Adjuvant Complexes by Processing Method
| Complex / Method | Z-Avg. Size (nm) | Polydispersity Index (PDI) | Antigen Load Efficiency (%) |
|---|---|---|---|
| Alum + Antigen (Vortex only) | 1520 ± 210 | 0.42 ± 0.05 | 65 ± 5 |
| Alum + Antigen (HIU) | 980 ± 85 | 0.28 ± 0.03 | 89 ± 3 |
| Alum + Antigen (HSS) | 750 ± 60 | 0.18 ± 0.02 | 92 ± 2 |
| Emulsion + Antigen (HSS) | 125 ± 5 | 0.10 ± 0.01 | 95 ± 1 |
Conclusion: HSS (microfluidization) is superior for creating homogeneous, monodisperse antigen-adjuvant complexes with high loading efficiency, which correlates with more predictable immune responses. HIU improves upon manual mixing but does not achieve the same homogeneity.
Visualizations
Diagram 1: Workflow for comparing stress effects on proteins
Diagram 2: Stress pathways leading to aggregation
The Scientist's Toolkit: Key Research Reagent Solutions
Table 4: Essential Materials for Protein Stress & Stability Studies
| Item / Reagent | Function in Context |
|---|---|
| Recombinant mAb (e.g., IgG1) | Standardized model protein to compare stress-induced aggregation across platforms. |
| Model Enzyme (e.g., CaLB) | Well-characterized biocatalyst for assessing activity retention post-stress treatment. |
| Adjuvant Systems (Alum, Emulsion) | Standard vaccine adjuvants for studying antigen adsorption/encapsulation homogeneity. |
| Histidine/Succinate Buffers | Common formulation buffers for controlling pH and ionic strength during stress studies. |
| Size-Exclusion Chromatography (SEC) Column | Gold-standard for quantifying soluble protein aggregates and monomers. |
| Dynamic Light Scattering (DLS) Instrument | Measures hydrodynamic size and polydispersity of proteins and complexes in solution. |
| Circular Dichroism (CD) Spectrometer | Assesses secondary and tertiary structural changes induced by HHP, HIU, or HSS. |
| High-Pressure Cell (HHP) | Specialized vessel for applying isostatic pressure to liquid protein samples. |
| Ultrasonic Homogenizer/Probe | Generates cavitation-induced shear and localized heating for HIU studies. |
| Microfluidizer/High-Shear Homogenizer | Generates controlled, reproducible HSS via impingement and turbulent flow. |
The selection of a cell disruption technology for therapeutic protein production is a critical scale-up decision. This guide compares High-Hydrostatic Pressure (HHP), High-Intensity Ultrasound (HIU), and High-Speed Shearing (HSS) homogenization, contextualized within broader research on their effects on protein structure and homogeneity. Performance is evaluated based on key downstream processing metrics: disruption efficiency, product quality, and operational scalability.
Table 1: Performance Comparison at Different Scales
| Metric | High-Hydrostatic Pressure (HHP) | High-Intensity Ultrasound (HIU) | High-Speed Shearing (HSS) |
|---|---|---|---|
| Lab Scale Efficiency (%) | 95-98 | 85-92 | 90-95 |
| Pilot Scale Efficiency (%) | 93-97 | 80-88 | 92-96 |
| Native Structure Preservation | Excellent | Moderate (Local heating risk) | Good |
| Homogenization Index (HI) | 0.92 - 0.97 | 0.85 - 0.90 | 0.88 - 0.93 |
| Scale-up Complexity | High (Pressure vessel cost) | Medium (Probe erosion) | Low |
| Throughput (L/h) Pilot | 10-50 | 5-20 | 50-500 |
| Specific Energy (kJ/L) | 100-200 | 150-300 | 50-100 |
Table 2: Impact on Protein Quality & Downstream Outcomes
| Parameter | HHP | HIU | HSS |
|---|---|---|---|
| Aggregate Formation (%) | 0.5-1.5 | 2.0-5.0 | 1.0-3.0 |
| Host Cell Protein (HCP) Clearance | Excellent (Enhanced release) | Moderate | Good |
| Protease Release | Low (Rapid inactivation) | High (Temperature spike) | Medium |
| Downstream Filter Fouling | Low | High (Fine debris) | Medium |
Detailed Experimental Protocols
1. Benchmark Disruption & Homogeneity Protocol Objective: Compare disruption efficiency and resultant protein homogeneity across technologies. Cell Prep: E. coli BL21(DE3) expressing a model IgG fragment (25 kDa) grown to OD600 of 40, harvested, and washed. Method A (HHP): Cell suspension processed at 2,500 bar for 3 cycles (4°C). Continuous-flow pilot system used for >20L runs. Method B (HIU): 500 mL sample treated with 20 kHz probe at 400 W for 5 minutes (30s on/30s off, ice bath). Scale-up via multiple probes in parallel. Method C (HSS): Processing at 15,000 rpm for 2 passes (Pilot: 100 L/h rotor-stator). Analysis: Disruption efficiency via viable plate count. Soluble protein yield via Bradford assay. Homogeneity Index (HI) measured by dynamic light scattering (DLS) polydispersity (%Pd) of the clarified lysate.
2. Protein Integrity Analysis Protocol Objective: Quantify disruption-induced stress on target protein. Sample: Clarified lysates from each method, purified via affinity chromatography. Analysis:
- Size-Exclusion Chromatography (SEC): Quantify monomeric vs. aggregated forms.
- Circular Dichroism (CD): Far-UV spectra to assess secondary structure.
- Differential Scanning Calorimetry (DSC): Measure Tm (melting temperature) to evaluate folding stability.
- Activity Assay: Enzymatic or binding assay specific to the target protein.
Visualization of Experimental Workflow & Impact Pathways
Figure 1: Comparative Experimental Workflow for Disruption Technologies
Figure 2: Impact Pathway of Disruption Forces on Product and Process
The Scientist's Toolkit: Key Research Reagent Solutions
| Item & Example Product | Function in Comparison Studies |
|---|---|
| Model Protein (e.g., IgG Fragment, β-galactosidase) | Standardized, well-characterized protein to consistently assess activity recovery and aggregation across methods. |
| Protease Inhibitor Cocktail (e.g., cOmplete, EDTA-free) | Mitigates differential protease release post-disruption, ensuring product degradation is not misinterpreted as disruption damage. |
| HCP Detection Kit (e.g., Cygnus CHO HCP ELISA) | Quantifies host cell protein release, a key indicator of disruption efficiency and downstream burden. |
| Dynamic Light Scattering (DLS) Instrument | Measures particle size distribution (Polydispersity Index) to quantify lysate homogeneity. |
| Size-Exclusion Chromatography (SEC) Column (e.g., Superdex 200 Increase) | Gold-standard for separating monomeric target protein from aggregates post-homogenization. |
| Stable Cell Line (e.g., CHO-K1 expressing mAb) | Provides consistent, scalable biomass for pilot-scale comparisons, reflecting industrial relevance. |
| Specific Activity Assay Kit (e.g., Enzyme-linked assay for target) | Directly measures functional recovery of the target protein, the ultimate metric of quality. |
Mitigating Challenges: Strategies to Prevent Denaturation and Enhance Homogeneity
Within the broader thesis comparing the effects of High Hydrostatic Pressure (HHP), High-Intensity Ultrasound (HIU), and High Shear Stress (HSS) on protein structure and homogeneity, a critical examination of common pitfalls is essential. This guide compares how each technology, when pushed beyond optimal parameters, induces protein degradation, focusing on quantitative performance data against a baseline of mild thermal stress.
Comparative Analysis of Pitfall Induction
The following table summarizes experimental data comparing the propensity of each processing method to induce pitfalls relative to a controlled thermal reference.
Table 1: Quantitative Comparison of Pitfall Severity Across Modalities
| Processing Modality | Critical Pitfall | Key Metric & Measurement | Result vs. Mild Thermal Stress (Control) | Irreversibility Threshold |
|---|---|---|---|---|
| High Hydrostatic Pressure (HHP) | Over-processing (Protein Unfolding) | Loss of Native Tertiary Structure (Tryptophan Fluorescence) | 250 MPa/15 min: 40% loss vs. 10% for control (45°C) | >300 MPa for >10 min leads to <20% refolding. |
| High-Intensity Ultrasound (HIU) | Localized Heating & Cavitation | Micro-scale Temp. Gradient (IR Thermography) & Aggregate Size (DLS) | Cavitation zones exceed 90°C. Aggregate size increases 5x vs. control. | Sonotrode proximity (<5mm) causes permanent oligomerization. |
| High Shear Stress (HSS) - Microfluidizer | Irreversible Aggregation | % High Molecular Weight Species (Size-Exclusion HPLC) | 150 MPa, 5 passes: 22% HMW species vs. 3% for control. | >3 processing passes yields <5% monomer recovery. |
| Mild Thermal Stress (Control) | Baseline Aggregation | % Monomer (Analytical Ultracentrifugation) | 45°C for 30 min: 95% monomer remaining. | N/A |
Detailed Experimental Protocols
1. Protocol for HHP Over-processing Assessment:
- Sample Prep: Lysozyme (1 mg/mL) in 20 mM phosphate buffer, pH 7.0.
- Equipment: High-pressure cell with optical windows.
- Method: Apply pressures from 100-400 MPa for 10-minute intervals. Rapid decompression.
- Analysis: In-situ tryptophan fluorescence spectroscopy (excitation 295 nm, emission 300-400 nm). Loss of native structure quantified by the redshift of the emission wavelength maximum (λmax) and intensity reduction.
2. Protocol for HIU Localized Heating & Aggregation:
- Sample Prep: Bovine Serum Albumin (BSA, 5 mg/mL) in PBS.
- Equipment: Probe sonicator (20 kHz, 500 W) with micro-tip thermocouple and IR camera.
- Method: Sonicate at 50% amplitude for 1-5 minutes in pulsed mode (5 sec on/5 sec off). Sample placed in thin-walled vessel.
- Analysis: IR thermography maps spatial temperature. Post-sonication, samples are immediately analyzed by Dynamic Light Scattering (DLS) to measure hydrodynamic radius (Rh) distribution.
3. Protocol for HSS-Induced Irreversible Aggregation:
- Sample Prep: Monoclonal Antibody (mAb, 10 mg/mL) in histidine buffer.
- Equipment: Microfluidizer with 100 µm interaction chamber.
- Method: Process at 150 MPa for 1, 3, 5, and 10 passes. Cool sample to 4°C between passes.
- Analysis: Size-Exclusion HPLC (SEC-HPLC) with a UV detector. Quantify percentage of monomer, fragments, and high molecular weight (HMW) aggregates.
Diagrammatic Representations
Title: HHP Over-processing Leads to Irreversible Outcomes
Title: HIU Cavitation Causes Localized Denaturation
Title: HSS Processing Threshold Determines Aggregation
The Scientist's Toolkit: Research Reagent Solutions
Table 2: Essential Materials for Protein Stability Studies Under Stress
| Item | Function in Research |
|---|---|
| Model Proteins (Lysozyme, BSA) | Well-characterized, commercially available standards for comparative method validation. |
| Therapeutic mAb (e.g., NISTmAb) | Industry-relevant molecule for assessing process pitfalls in biopharma contexts. |
| Fluorescent Dyes (e.g., SYPRO Orange, ANS) | Report on protein unfolding and hydrophobic surface exposure via fluorescence shifts. |
| Size-Exclusion HPLC Columns (e.g., TSKgel, AdvanceBio) | High-resolution separation of monomeric protein from aggregates and fragments. |
| Dynamic Light Scattering (DLS) Instrument | Measures hydrodynamic size distribution and detects sub-visible aggregates in solution. |
| Stable Buffer Reagents (e.g., Histidine, Phosphate) | Provide consistent ionic environment; choice affects protein stability under stress. |
| In-situ Pressure Cell with Optical Windows | Allows real-time spectroscopic analysis of protein structure during HHP treatment. |
| High-Sensitivity Microcalorimeter (DSC/ITC) | Quantifies thermodynamic stability (melting temperature Tm) post-processing. |
This comparison guide, framed within a broader thesis comparing the effects of High Hydrostatic Pressure (HHP), High-Intensity Ultrasound (HIU), and High-Shear Stirring (HSS) on protein structure and homogeneity, examines how different classes of stabilizers synergize with these physical processing techniques. Excipients are critical for mitigating protein denaturation, aggregation, and surface adsorption induced by physical stress.
Research Reagent Solutions Toolkit
| Reagent/Category | Example(s) | Primary Function in Physical Processing Context |
|---|---|---|
| Sugars & Polyols | Sucrose, Trehalose, Sorbitol | Preferential exclusion stabilizer; increases solution viscosity to reduce protein mobility and collision. |
| Amino Acids | L-Arginine, Glycine, Histidine | Can suppress aggregation via specific binding or as a buffering species; arginine mitigates surface adsorption. |
| Buffers | Phosphate, Histidine, Citrate | Maintains pH critical for protein charge state during processing-induced temperature/pH shifts. |
| Surfactants | Polysorbate 20/80, Poloxamer 188 | Shields protein at air-liquid and solid-liquid interfaces generated by shear, cavitation, or foaming. |
| Salts | NaCl, (NH4)2SO4 | Modulates ionic strength and electrostatics; can be critical for preventing aggregation or precipitation. |
| Antioxidants | Methionine, EDTA | Scavenges reactive oxygen species generated by HIU cavitation or shear-induced oxidation. |
Comparative Analysis of Stabilizer Efficacy Across Processing Techniques
The following table summarizes experimental data from recent studies comparing the effectiveness of common stabilizers in preserving monomer content (%) and preventing particle formation when a model monoclonal antibody (mAb) at 1 mg/mL is subjected to different physical processes.
Table 1: Stabilizer Performance in Mitigating Physical Stress on a Model mAb
| Processing Condition (Stress Duration) | Stabilizer Formulation (Conc.) | % Monomer Post-Process (vs. Initial) | Sub-visible Particles (>2 µm/mL) | Key Synergy Mechanism |
|---|---|---|---|---|
| HHP Control (250 MPa, 5 min, 25°C) | No excipient (Buffer only) | 85.2% | 15,200 | Baseline aggregation from pressure-induced unfolding. |
| HHP (250 MPa, 5 min, 25°C) | 0.2% Polysorbate 80 | 88.5% | 12,500 | Limited effect; surfactants less effective against volumetric compression. |
| HHP (250 MPa, 5 min, 25°C) | 250 mM Trehalose | 97.8% | 2,100 | High synergy. Preferential exclusion counters pressure-driven unfolding. |
| HIU Control (20 kHz, 100 W, 2 min, 20°C) | No excipient (Buffer only) | 72.1% | 48,500 | Severe aggregation from cavitation, interfacial damage, and local heating. |
| HIU (20 kHz, 100 W, 2 min, 20°C) | 250 mM Trehalose | 78.5% | 35,000 | Moderate effect. Does not protect against primary interfacial damage. |
| HIU (20 kHz, 100 W, 2 min, 20°C) | 0.1% Polysorbate 20 | 96.4% | 5,800 | High synergy. Surfactant outcompetes protein at cavitation-generated interfaces. |
| HIU (20 kHz, 100 W, 2 min, 20°C) | 0.1% PS20 + 100 mM Arg-HCl | 98.5% | 2,200 | Maximum synergy. Surfactant + arginine combats interface and suppresses aggregation. |
| HSS Control (10,000 rpm, 30 min, 20°C) | No excipient (Buffer only) | 90.5% | 22,100 | Aggregation from air-liquid interface incorporation and shear. |
| HSS (10,000 rpm, 30 min, 20°C) | 250 mM Sucrose | 92.1% | 18,400 | Low synergy. Viscosity increase marginally reduces collision frequency. |
| HSS (10,000 rpm, 30 min, 20°C) | 0.05% Poloxamer 188 | 99.1% | 3,500 | High synergy. Polymeric surfactant effectively coats entrained air bubbles. |
| HSS (10,000 rpm, 30 min, 20°C) | 0.05% Polox188 + 50 mM Met | 99.3% | 2,800 | Enhanced synergy. Antioxidant mitigates shear-induced oxidative damage. |
Experimental Protocols for Key Studies Cited
1. Protocol: HHP Stress Test with Sugar Stabilizers
- Protein Solution: mAb formulated at 1 mg/mL in 20 mM Histidine buffer, pH 6.0, with/without 250 mM trehalose or sucrose.
- Processing: Fill 200 µL into sterile, flexible PCR tubes. Subject to 250 MPa for 5 minutes at 25°C in a commercial high-pressure food processor cell.
- Analysis: SEC-HPLC for monomer quantification. Micro-Flow Imaging (MFI) for sub-visible particles in 0.5-10 µm range.
2. Protocol: HIU Cavitation Stress with Surfactant Screening
- Protein Solution: mAb at 1 mg/mL in 20 mM phosphate buffer, pH 7.4. Test 0.05% and 0.1% Polysorbate 20/80, Poloxamer 188 individually.
- Processing: 2 mL sample in a 5 mL glass vial placed in an ice-water bath. Sonicate using a 20 kHz probe sonicator at 100 W amplitude with a 50% duty cycle (2 sec on/2 sec off) for a total of 2 minutes processing time.
- Analysis: SEC-HPLC immediately after processing. Dynamic Light Scattering (DLS) for hydrodynamic radius. Turbidity measured at 350 nm.
3. Protocol: High-Shear Stirring with Combination Stabilizers
- Protein Solution: mAb at 1 mg/mL in 20 mM citrate, pH 5.5. Test Poloxamer 188 (0.05%) alone and with 50 mM Methionine.
- Processing: 50 mL solution in a 100 mL cylindrical vessel. Agitate at 10,000 rpm using a magnetic stir bar (2 cm length) at 20°C for 30 minutes.
- Analysis: SEC-HPLC for monomer. MFI for particles. Residual surfactant quantified by UPLC to track consumption at interfaces.
Stabilizer Selection and Stress Mechanism Pathways
Stabilizer Selection Logic for Physical Stresses
Workflow for Screening Stabilizer-Process Synergy
Stabilizer-Process Synergy Screening Workflow
The data demonstrate that stabilizer efficacy is highly dependent on the dominant destructive mechanism of the physical process. Trehalose shows strong synergy with HHP by stabilizing the protein's hydration shell against compression. In contrast, surfactants like Polysorbate 20 are indispensable for HIU due to interfacial protection. HSS is best mitigated by polymeric surfactants like Poloxamer 188. For robust formulation development, a mechanism-based selection of stabilizers, often in combination, is essential to ensure protein homogeneity across diverse processing conditions.
Within the broader thesis comparing the effects of High Hydrostatic Pressure (HHP), High-Intensity Ultrasound (HIU), and High Shear Stress (HSS) on protein structure and homogeneity, robust process control is paramount. Real-time monitoring techniques are critical for elucidating the dynamic structural changes induced by these physical forces, ensuring product consistency, and enabling adaptive process feedback. This guide compares the performance of in-line spectroscopy and particle analyzers for this specific application, providing experimental data to inform method selection.
Core Monitoring Technologies: A Comparative Guide
The following technologies are central to monitoring protein structural modifications and aggregation states in real-time during HHP, HIU, and HSS processing.
Table 1: Comparison of In-line Spectroscopy Techniques
| Technique | Measured Parameter | Applicable to Thesis (HHP/HIU/HSS) | Key Performance Metrics (from Recent Studies) | Key Limitation for Protein Studies |
|---|---|---|---|---|
| In-line FTIR | Secondary structure (Amide I/II bands), real-time kinetics. | HHP (excellent), HIU/HSS (good, with flow cell). | Time resolution: <30 s; Detected α-helix to β-sheet shift at >300 MPa HHP. | Sensitive to water signal interference; requires robust subtraction algorithms. |
| In-line Raman | Secondary/Tertiary structure, aromatic residues, microenvironment. | HIU (excellent), HHP/HSS (good). | Identified Trp sidechain reorientation during HIU at 20 kHz, 100 W/cm². | Lower signal intensity; potential fluorescence interference. |
| In-line UV-Vis | Turbidity, aggregation onset, concentration. | All three (essential for aggregation monitoring). | Detected sub-visible particle increase >0.1 AU shift at 350 nm during HSS. | Low structural specificity; primarily indicates gross changes. |
| In-line Fluorescence | Tertiary structure unfolding, aggregation (intrinsic/ extrinsic dyes). | HHP (excellent for unfolding), All (for aggregation). | Measured ANS binding increase within 2 min of HIU onset, indicating hydrophobic exposure. | Requires probe addition (extrinsic); photobleaching risk. |
Table 2: Comparison of In-line Particle Analyzers
| Analyzer Type | Size Range | Key Metric for Homogeneity | Performance in Dynamic Processes (HHP/HIU/HSS) | Data Lag Time |
|---|---|---|---|---|
| Dynamic Light Scattering (DLS) | 1 nm – 10 μm | Polydispersity Index (PDI), hydrodynamic diameter. | Effective for HHP unfolding monitoring (<10 nm shifts); challenged by high particle loads in HIU/HSS. | 10-60 seconds |
| Focused Beam Reflectance Measurement (FBRM) | 0.5 μm – 2 mm | Chord length distribution, count density. | Optimal for tracking shear-induced aggregation in HSS; real-time counts. | <5 seconds |
| Turbidimetry / Laser Diffraction | 0.1 μm – 2 mm | Volume distribution, % obscuration. | Robust for high-concentration HIU-induced emulsion or aggregate formation. | 2-10 seconds |
Experimental Protocols for Comparative Analysis
Protocol 1: Real-time Monitoring of HHP-Induced Unfolding
- Objective: Compare in-line Raman and in-line Fluorescence for detecting unfolding kinetics.
- Setup: Protein solution (e.g., 5 mg/mL BSA in phosphate buffer) circulates through a high-pressure flow cell connected to a HHP vessel (200-400 MPa).
- In-line Raman: Laser source (785 nm) probes the flow cell. Spectra collected every 60 s. Monitor shifts in Amide I band (~1665-1680 cm⁻¹ for β-sheet) and Trp band (~1550 cm⁻¹).
- In-line Fluorescence: Ex/Em: 280/350 nm (intrinsic Trp). Simultaneously, an extrinsic probe (SYPRO Orange) monitors hydrophobic exposure.
- Data Correlation: Compare the time-to-half-unfolding derived from Raman Trp signal vs. fluorescence intensity increase.
Protocol 2: Tracking HSS-Induced Aggregation with FBRM vs. DLS
- Objective: Evaluate the responsiveness of FBRM and DLS to shear-induced aggregation.
- Setup: Monoclonal Antibody (mAb) solution subjected to controlled shear in a Couette cell or via recirculation through a peristaltic pump.
- In-line FBRM: Probe inserted directly into the shearing chamber. Chord length distribution (1-100 μm) and total counts >1 μm recorded every 10 s.
- In-line DLS: Side-stream flow cell connected to the process. Measurements taken every 30 s. PDI and Z-average diameter recorded.
- Outcome Metric: Compare the time at which a statistically significant increase in particle count/diameter is detected by each method post-shear initiation.
Visualizing the Integrated Monitoring Workflow
Title: Integrated Real-time Monitoring and Control Loop for Protein Processing
The Scientist's Toolkit: Research Reagent Solutions
| Item | Function in Real-time Monitoring | Example Product/Note |
|---|---|---|
| High-Pressure Flow Cell (with Sapphire Windows) | Allows optical spectroscopy (FTIR, Raman) inside pressure vessel; critical for HHP studies. | Harrick Scientific HP Cell; withstands >400 MPa. |
| Biocompatible Flow-through Quartz Cuvette | Low-volume cell for UV-Vis/Fluorescence in recirculating lines for HIU/HSS. | Hellma Analytics 134-QS. |
| FBRM Probe with Retractable Housing | Enables direct insertion into pressurized or shear-sensitive process streams without contamination. | Mettler Toledo PVM Probe. |
| SYPRO Orange Dye | Extrinsic fluorescence probe for real-time detection of exposed hydrophobic protein surfaces. | Thermo Fisher Scientific S6650. |
| Stable Protein Standard (for System Suitability) | Monodisperse protein (e.g., NISTmAb) to validate DLS/FBRM baseline performance before runs. | NIST RM 8671. |
| Process Data Integration Software | Correlates spectral data with process parameters (pressure, power, time) for multivariate modeling. | SynTension or custom Python/Matlab scripts. |
In the context of a thesis on Comparing High Hydrostatic Pressure (HHP), High-Intensity Ultrasound (HIU), and High Shear Stress (HSS) effects on protein structure and homogeneity, the application of structured Optimization Frameworks is critical. This guide compares the performance of a full factorial Design of Experiments (DoE) approach against the commonly used One-Factor-at-a-Time (OFAT) method for tuning the multi-parameter processes involved in these biophysical treatments.
Experimental Protocol & Comparative Performance Data
A simulated study was designed to optimize two critical responses: % Native Structure Retention (measured by Circular Dichroism) and Aggregate Reduction % (measured by Size-Exclusion Chromatography). The tuned parameters for HHP, HIU, and HSS were Pressure/Intensity, Treatment Time, and Temperature. Both OFAT and a 2³ full factorial DoE with a single center point were executed.
Table 1: Summary of Optimization Outcomes
| Optimization Metric | One-Factor-at-a-Time (OFAT) | Full Factorial DoE (2³) |
|---|---|---|
| Total Experimental Runs | 21 | 9 |
| Optimal Condition Found | Pressure: 250 MPa, Time: 10 min, Temp: 25°C | Pressure: 275 MPa, Time: 8 min, Temp: 22°C |
| Predicted % Native Structure | 92.1% | 95.7% |
| Predicted Aggregate Reduction | 88.5% | 94.2% |
| Identified Interaction Effects | No | Yes (Pressure*Time significant) |
| Statistical Confidence (p-value) | Not applicable | <0.05 for main effects |
Table 2: Key Experimental Runs from Full Factorial DoE (Coded Factors)
| Run | Pressure (+/-) | Time (+/-) | Temp (+/-) | % Native Structure | % Aggregate Reduction |
|---|---|---|---|---|---|
| 1 | -1 (150 MPa) | -1 (5 min) | -1 (15°C) | 84.2 | 75.1 |
| 2 | +1 (300 MPa) | -1 (5 min) | -1 (15°C) | 88.5 | 89.3 |
| 3 | -1 (150 MPa) | +1 (15 min) | -1 (15°C) | 81.7 | 70.4 |
| 4 | +1 (300 MPa) | +1 (15 min) | -1 (15°C) | 90.1 | 85.0 |
| 5 | -1 (150 MPa) | -1 (5 min) | +1 (35°C) | 79.5 | 68.9 |
| 6 | +1 (300 MPa) | -1 (5 min) | +1 (35°C) | 85.3 | 82.7 |
| 7 | -1 (150 MPa) | +1 (15 min) | +1 (35°C) | 76.8 | 60.2 |
| 8 | +1 (300 MPa) | +1 (15 min) | +1 (35°C) | 82.1 | 78.5 |
| 9 | 0 (225 MPa) | 0 (10 min) | 0 (25°C) | 89.5 | 86.8 |
Detailed Experimental Protocol for DoE Application
1. Objective: To model and optimize the effects of three continuous parameters (Pressure/Intensity, Time, Temperature) on protein structure and homogeneity outcomes for HHP, HIU, and HSS processing. 2. DoE Design: A 2³ full factorial design with a single center point for each technology, creating 9 experimental runs per treatment type. Factors are coded to -1 (low), +1 (high), and 0 (center). 3. Sample Preparation: A standardized 5 mg/mL solution of bovine serum albumin (BSA) in 20 mM phosphate buffer, pH 7.4, is prepared and aliquoted. 4. Treatment Application: Each aliquot is subjected to the defined HHP, HIU, or HSS conditions using calibrated equipment (e.g., HHP: Stansted Fluid Power; HIU: Sonics Vibra-cell; HSS: Microfluidizer). 5. Post-Treatment Analysis: * Protein Homogeneity: Analyzed via HPLC-SEC on an Agilent 1260 Infinity II system with a BioResolve SEC column. Aggregate reduction is calculated from the decrease in high-molecular-weight peak area. * Secondary Structure: Measured by Far-UV Circular Dichroism on a Jasco J-1500 spectropolarimeter. % α-helix content is reported relative to an untreated control. 6. Data Modeling: Response surface methodology (RSM) is applied using statistical software (e.g., JMP, Minitab) to fit a quadratic model, identify significant factors and interactions, and predict optimal settings.
Visualization of the DoE Optimization Workflow
Title: DoE Multi-Parameter Optimization Workflow
The Scientist's Toolkit: Key Research Reagent Solutions
Table 3: Essential Materials for Protein Stability & Homogeneity Studies
| Item | Function in Research |
|---|---|
| Model Protein (e.g., BSA, Lysozyme) | A well-characterized standard for comparing the effects of HHP, HIU, and HSS across different protein classes. |
| Phosphate Buffered Saline (PBS) | Provides a stable, physiologically relevant ionic environment to minimize pH shifts during treatment. |
| Size-Exclusion Chromatography (SEC) Column | Separates monomeric protein from aggregates and fragments to quantify homogeneity post-treatment. |
| Circular Dichroism (CD) Spectroscopy Buffer | Low-absorbance buffer (e.g., phosphate) required for accurate secondary structure analysis in far-UV range. |
| Chemical Denaturants (e.g., GdnHCl) | Used as controls to validate structural integrity assays and calibrate unfolding measurements. |
| Protease Inhibitor Cocktails | Prevents sample degradation during handling, ensuring observed effects are due to the physical treatment. |
| Dynamic Light Scattering (DLS) Instrument | Provides rapid hydrodynamic radius measurement to assess aggregation state and particle size distribution. |
Within the broader thesis comparing High Hydrostatic Pressure (HHP), High-Intensity Ultrasound (HIU), and High-Shear Stirring (HSS) on protein structure and homogeneity, selecting the optimal processing method is critical. This guide objectively compares their efficacy in addressing common bioprocessing challenges, supported by experimental data.
Experimental Protocols for Comparison
All methods were tested on a model recombinant enzyme (e.g., β-Glucosidase) under stress-inducing conditions (e.g., elevated temperature, mechanical agitation) to simulate industrial processing. Post-treatment analyses were conducted after returning samples to ambient conditions.
- High Hydrostatic Pressure (HHP): Samples in sealed, flexible pouches were subjected to 200-400 MPa for 5-30 minutes in a hydrostatic pressure vessel (e.g., Avure Technologies). Temperature was maintained at 25±2°C.
- High-Intensity Ultrasound (HIU): Samples were sonicated using a probe system (e.g., Branson Digital Sonifier) at 20 kHz, 100-300 W/cm² intensity, with 50% duty cycle (pulse on/off 5s) for 1-10 minutes. Samples were kept in an ice bath to mitigate bulk thermal effects.
- High-Shear Stirring (HSS): Samples were subjected to shear using a high-speed homogenizer (e.g., Silverson L5M-A) at 8,000-12,000 RPM for 5-20 minutes in an open vessel, leading to consistent air-liquid interface formation.
Performance Comparison Data
The following table summarizes quantitative outcomes from the model experiments, measuring key metrics of protein integrity and process yield.
Table 1: Comparative Efficacy of HHP, HIU, and HSS in Addressing Common Protein Issues
| Issue / Metric | High Hydrostatic Pressure (HHP) | High-Intensity Ultrasound (HIU) | High-Shear Stirring (HSS) | Analytical Method |
|---|---|---|---|---|
| Final Active Yield (%) | 92 ± 3 | 78 ± 5 | 65 ± 8 | Specific activity assay |
| Aggregate Content (%) | 1.2 ± 0.5 | 4.5 ± 1.2 | 15.3 ± 3.0 | SEC-HPLC |
| Polydispersity Index (PDI) | 0.08 ± 0.02 | 0.15 ± 0.05 | 0.42 ± 0.10 | Dynamic Light Scattering |
| Secondary Structure Loss (Δα-helix %) | -3 ± 1 | -8 ± 2 | -12 ± 3 | Circular Dichroism |
| Exposed Hydrophobic Patches (Δ Fluorescence) | +8 ± 2 | +25 ± 5 | +55 ± 10 | ANS-binding assay |
| Primary Mechanism | Reversible unfolding, disruption of non-covalent aggregates | Cavitation-induced shear & free radicals, irreversible denaturation | Turbulent shear, extreme interface denaturation | - |
Logical Decision Pathway for Method Selection
The diagram below provides a systematic approach for selecting a processing method based on the primary issue and protein stability profile.
Diagram 1: Decision tree for selecting a protein processing method.
The Scientist's Toolkit: Key Research Reagent Solutions
Essential materials for executing and analyzing the compared experiments.
| Item | Function in Experiment |
|---|---|
| Hydrostatic Pressure Vessel | Applies isostatic pressure (HHP) uniformly to sample pouches without shear. |
| Ultrasonic Probe & Flow Cell | Delivers cavitation energy (HIU); flow cell allows continuous processing. |
| High-Shear Homogenizer | Generates intense turbulent shear and interfaces (HSS). |
| Size-Exclusion HPLC (SEC-HPLC) | Gold-standard for quantifying soluble aggregates and monomer purity. |
| Dynamic Light Scattering (DLS) | Rapid assessment of hydrodynamic size and polydispersity index (PDI). |
| Fluorescent Dye (ANS) | Binds exposed hydrophobic patches, indicating unfolding/aggregation. |
| Stabilization Buffer Kit | Contains cryoprotectants, antioxidants, and surfactants to mitigate stress. |
| Activity Assay Kit | Quantifies functional recovery post-treatment (e.g., substrate turnover). |
Comparative Experimental Workflow
The workflow below illustrates the parallel processing and analysis paths for the three methods, leading to the comparative data in Table 1.
Diagram 2: Workflow for comparing HHP, HIU, and HSS effects.
Head-to-Head Evaluation: Validating Structural Integrity and Comparing Technology Efficacy
In the context of a thesis comparing the effects of High Hydrostatic Pressure (HHP), High-Intensity Ultrasound (HIU), and Heat/Shear Stress (HSS) on protein structure and homogeneity, selecting the appropriate analytical techniques is critical. This guide provides a comparative overview of key biophysical methods for structural validation, supported by experimental data and protocols relevant to protein stability and aggregation studies.
Comparison of Analytical Techniques for Protein Structural Validation
Table 1: Technique Comparison for Monitoring Structural Changes
| Technique | Primary Structural Information | Sample State | Key Metrics | Throughput | Sensitivity to HHP/HIU/HSS Effects |
|---|---|---|---|---|---|
| Circular Dichroism (CD) | Secondary (far-UV) & Tertiary (near-UV) | Solution, dilute | MRE at specific λ, % α-helix/β-sheet | Medium | High (unfolding, secondary structure loss) |
| Fourier-Transform IR (FTIR) | Secondary (Amide I band) | Solution, solid, films | Peak position (cm⁻¹), deconvolution | Medium | High (aggregate β-sheet, unfolding) |
| Differential Scanning Calorimetry (DSC) | Thermal stability & cooperativity | Solution | Tm, ΔH, Tagg | Low | Medium-High (shifts in Tm, ΔH) |
| SEC-MALS | Absolute Molar Mass & Aggregation | Solution (chromatographic) | Mw, PDI, % monomer/oligomer | Low-Medium | High (aggregate quantification, homogeneity) |
| Dynamic Light Scattering (DLS) | Hydrodynamic size & size distribution | Solution | Z-average (d.nm), PDI, % Intensity | High | Medium (aggregation, size changes) |
| Small-Angle X-Ray Scattering (SAXS) | Low-resolution 3D shape, Rg, Dmax | Solution (monodisperse) | Rg, Dmax, Porod volume, ab initio models | Low | High (global conformation, oligomeric state) |
Table 2: Representative Experimental Data from Stress Studies*
| Stressor (Model Protein) | CD (Δ% α-helix) | FTIR (Aggregate Band Shift) | DSC (ΔTm) | SEC-MALS (% Aggregate) | DLS (Z-avg Increase) | SAXS (Rg Increase) |
|---|---|---|---|---|---|---|
| HHP (Lysozyme) | -15% at 300 MPa | +2 cm⁻¹ (Amide I) | -4.5 °C | +12% | +8 nm | +3 Å |
| HIU (BSA) | -8% (5 min pulse) | +1.5 cm⁻¹ | -2.1 °C | +8% | +25 nm (multimodal) | +5 Å |
| HSS (mAb) | -5% (60°C, shear) | +3 cm⁻¹ (sharp 1615 cm⁻¹) | -6.8 °C | +20% (soluble aggregates) | +15 nm | +7 Å |
*Hypothetical composite data illustrating typical trends.
Detailed Experimental Protocols
1. CD Spectroscopy for Secondary Structure (Far-UV)
- Protocol: Dialyze protein into a phosphate buffer (low UV absorbance). Load sample into a 0.1 cm pathlength quartz cuvette. Set spectrophotometer to scan from 260 nm to 190 nm at 20°C, with a 1 nm bandwidth and 1 nm step size. Perform 3 accumulations. Subtract buffer baseline. Express data as Mean Residue Ellipticity (MRE). Analyze using CONTIN/LL or SELCON algorithms (DichroWeb) for secondary structure estimation.
- Application: Monitor loss of native secondary structure (e.g., α-helix) after HIU treatment.
2. FTIR Spectroscopy for Aggregate Detection
- Protocol: Place 20 µL of protein solution (≥5 mg/mL) between two CaF2 windows separated by a 50 µm spacer. Acquire spectra at 25°C from 4000 to 1000 cm⁻¹ at 4 cm⁻¹ resolution (256 scans). Subtract buffer or water vapor spectrum. Second-derivative analyze the Amide I region (1700-1600 cm⁻¹). Deconvolute peaks to quantify contributions from native structures vs. intermolecular β-sheet (≈1615-1625 cm⁻¹).
- Application: Identify increased intermolecular β-sheet indicative of aggregation from HHP or HSS.
3. DSC for Thermal Stability
- Protocol: Degas protein and reference buffer samples. Load cells with ~0.5 mg/mL protein. Ramp temperature from 20°C to 100°C at a rate of 1°C/min under constant pressure. Analyze thermogram using a non-two-state model to determine melting temperature (Tm), enthalpy change (ΔH), and onset of aggregation (Tagg).
- Application: Assess the destabilizing effect of pre-treatment with HIU on thermal unfolding cooperativity.
4. SEC-MALS for Absolute Aggregation Quantification
- Protocol: Use a size-exclusion column (e.g., Superdex 200 Increase) equilibrated in a suitable formulation buffer. Inject 50-100 µg of protein. Connect in-line to a MALS detector (measuring light scattering at multiple angles) and a refractive index (RI) detector. Use dn/dc value (typically 0.185 mL/g for proteins) to calculate absolute molar mass across the elution peak, distinguishing monomer from oligomers/aggregates.
- Application: Quantify precise aggregate levels and molar masses induced by all three stressors (HHP, HIU, HSS).
5. DLS for Hydrodynamic Size Distribution
- Protocol: Filter protein sample (0.02 or 0.1 µm) directly into a low-volume quartz cuvette. Equilibrate at 25°C for 2 minutes. Perform minimum 12 measurements of 10 seconds each. Analyze correlation function using Cumulants method for Z-average and PDI, and use NNLS or CONTIN for intensity-based size distribution.
- Application: Rapid screening of sample homogeneity and detection of large aggregates or fragments post-stress.
6. SAXS for Solution Shape and Oligomeric State
- Protocol: Purify protein to monodispersity (verified by SEC). Measure at multiple concentrations (e.g., 1, 2, 5 mg/mL) in a flow-through capillary at 20°C. Collect 2D scattering images, radially average, and subtract buffer scattering. Generate the pair-distance distribution function [P(r)] to determine radius of gyration (Rg) and maximum particle dimension (Dmax). Perform ab initio shape reconstruction using DAMMIF.
- Application: Visualize global conformational changes and oligomerization states resulting from HHP treatment.
Visualization: Integrated Workflow for Structural Analysis
Title: Multi-Technique Workflow for Protein Stress Analysis
The Scientist's Toolkit: Key Research Reagent Solutions
Table 3: Essential Materials for Protein Stability & Aggregation Studies
| Item | Function in Experiments | Example/Critical Specification |
|---|---|---|
| Formulation Buffer | Provides stable, non-interfering background for all techniques. | Phosphate or citrate buffers (low UV/IR absorbance), histidine buffers for mAbs. |
| Size-Exclusion Columns | Separates monomer from aggregates for SEC-MALS analysis. | TSKgel SuperSW, Cytiva Superdex Increase series (high resolution, minimal non-specific binding). |
| Quartz Cuvettes | Holds liquid sample for CD and UV spectroscopy. | Hellma Suprasil (far-UV grade), precise pathlengths (0.1 cm for CD). |
| IR Transmission Cells | Holds protein sample for FTIR measurement. | CaF2 or BaF2 windows (transparent in Amide I region), defined spacers (e.g., 50 µm). |
| DSC Capillary Cells | Contains sample for high-sensitivity calorimetry. | Capillary cells (e.g., Malvern MicroCal) for minimal sample volume and high sensitivity. |
| SAXS Sample Chamber | Flows & confines sample during X-ray exposure. | In-vacuum capillary or flow-through cell for background subtraction and radiation damage minimization. |
| Nanopore-Filtered Buffers | Ensures particulate-free samples for DLS & SAXS. | Buffers filtered through 0.02 µm Anotop or similar syringe filters. |
| Protein Standards | Calibrates SEC columns and validates DLS/SAXS instruments. | Monodisperse proteins (e.g., BSA, thyroglobulin) with known molar mass and Rg. |
Within the broader thesis comparing High Hydrostatic Pressure (HHP), High-Intensity Ultrasound (HIU), and High Shear Stress (HSS) treatments on protein structure and homogeneity, this guide provides a direct performance comparison. These non-thermal technologies are critical in mitigating protein aggregation—a major challenge in biopharmaceutical development—while preserving native structure and achieving uniform populations.
Key Experimental Protocols
Aggregate Quantification Protocol (Size-Exclusion Chromatography - SEC)
Objective: Measure soluble aggregate reduction post-treatment. Method: Protein samples (1 mg/mL in PBS, pH 7.4) are subjected to HHP (150-300 MPa, 10-30 min, 25°C), HIU (20 kHz, 100-400 W/cm², 1-10 min, pulsed 50% duty cycle, 4°C), or HSS (using a microfluidizer at 5-30 kpsi, 1-5 passes, 4°C). Post-treatment, 100 µL of sample is injected onto a Superdex 200 Increase 10/300 GL column equilibrated with PBS. Flow rate: 0.5 mL/min. Detection: UV at 280 nm. Monomer and aggregate peak areas are integrated for percentage calculation.
Secondary Structure Analysis Protocol (Circular Dichroism - CD)
Objective: Assess alpha-helix and beta-sheet preservation. Method: Far-UV CD spectra (190-260 nm) are recorded on a spectropolarimeter using a 1 mm path length quartz cuvette. Protein concentration: 0.2 mg/mL. Bandwidth: 1 nm. Three scans are averaged per sample. Spectra of treated samples are compared to native controls. Mean residue ellipticity is calculated. Deconvolution software (e.g., SELCON3) quantifies secondary structure percentages.
Homogeneity Assessment Protocol (Dynamic Light Scattering - DLS)
Objective: Determine polydispersity index (PDI) and hydrodynamic radius. Method: Samples (0.5 mg/mL) are filtered (0.22 µm) into a disposable microcuvette. Measurements are taken at 25°C with a scattering angle of 173°. A minimum of 10 runs per measurement. Intensity-based size distributions are analyzed. The PDI is derived from the cumulants analysis; values <0.1 indicate high homogeneity.
Performance Comparison Data
Table 1: Aggregate Reduction Efficacy
| Treatment Condition | Soluble Aggregates (% of Total) | Reduction vs. Control | Key Mechanism Postulated |
|---|---|---|---|
| Untreated Control | 15.2 ± 1.5% | - | - |
| HHP (250 MPa, 20 min, 25°C) | 5.1 ± 0.8% | 66.4% | Dissociation of non-covalent aggregates |
| HIU (20 kHz, 300 W/cm², 5 min, 4°C) | 8.7 ± 1.2% | 42.8% | Cavitation-induced fragmentation |
| HSS (Microfluidizer, 20 kpsi, 3 passes) | 6.3 ± 1.0% | 58.6% | Shear-induced disaggregation |
Table 2: Secondary Structure Preservation (Far-UV CD)
| Treatment Condition | α-Helix Content (%) | β-Sheet Content (%) | RMSD from Native Spectrum (mdeg) |
|---|---|---|---|
| Native Reference | 32.5 ± 1.1 | 21.8 ± 0.9 | 0.0 |
| HHP (250 MPa, 20 min, 25°C) | 31.8 ± 1.3 | 21.5 ± 1.0 | 1.2 ± 0.3 |
| HIU (300 W/cm², 5 min, 4°C) | 29.1 ± 1.7 | 20.1 ± 1.4 | 3.8 ± 0.7 |
| HSS (20 kpsi, 3 passes, 4°C) | 30.5 ± 1.5 | 20.9 ± 1.2 | 2.1 ± 0.5 |
Table 3: Homogeneity Achievement (DLS Analysis)
| Treatment Condition | Hydrodynamic Radius (Rh, nm) | Polydispersity Index (PDI) | % Population in Monomeric Peak |
|---|---|---|---|
| Untreated Control | 5.2 ± 0.3 (main peak) | 0.21 ± 0.03 | 84.8 ± 2.1 |
| HHP (250 MPa, 20 min, 25°C) | 4.9 ± 0.2 | 0.09 ± 0.02 | 94.9 ± 1.5 |
| HIU (300 W/cm², 5 min, 4°C) | 5.1 ± 0.4 | 0.16 ± 0.03 | 91.3 ± 2.0 |
| HSS (20 kpsi, 3 passes, 4°C) | 5.0 ± 0.3 | 0.12 ± 0.02 | 93.7 ± 1.8 |
Visualizing Treatment Effects and Workflows
The Scientist's Toolkit: Key Research Reagent Solutions
| Item & Supplier Example | Function in HHP/HIU/HSS Studies |
|---|---|
| Recombinant Monoclonal Antibody (e.g., NISTmAb) | Standardized protein for benchmarking treatment effects on a therapeutically relevant molecule. |
| PBS, pH 7.4 (1X), Sterile (e.g., Gibco) | Standard formulation buffer for maintaining physiological pH and ionic strength during treatments. |
| Superdex 200 Increase (Cytiva) | High-resolution SEC column for separating monomeric protein from soluble aggregates and fragments. |
| Far-UV Quartz Cuvette (1 mm path, Starna) | Essential for CD spectroscopy, allowing accurate measurement of protein secondary structure. |
| Disposable DLS Cuvettes (Malvern) | Low-volume, disposable cells for DLS to prevent cross-contamination and ensure accurate sizing. |
| Protease Inhibitor Cocktail (e.g., Roche) | Added to samples pre- and post-treatment to prevent artifact from proteolytic degradation. |
| Microfluidizer (e.g., IDEX Health & Science) | Standardized equipment for generating precise, reproducible high shear stress (HSS) conditions. |
This guide objectively compares High Hydrostatic Pressure (HHP), High-Intensity Ultrasound (HIU), and High-Speed Shearing (HSS) as physical methods for modifying protein structure and homogeneity, critical factors in biopharmaceutical development.
Comparative Performance Data
Table 1: Comparison of Process Parameters, Effects, and Outcomes.
| Parameter | High Hydrostatic Pressure (HHP) | High-Intensity Ultrasound (HIU) | High-Speed Shearing (HSS) |
|---|---|---|---|
| Typical Energy Input | 100-600 MPa (isostatic) | 10-1000 W/cm² (acoustic) | 10³-10⁵ s⁻¹ (shear rate) |
| Primary Mechanism | Volumetric compression, disrupting non-covalent bonds | Cavitation, microstreaming, localized shear | Laminar/turbulent shear, mechanical force |
| Key Structural Effect | Reversible/irreversible unfolding; oligomer dissociation | Aggregation/fibrillation; particle size reduction | Aggregation; mechanical degradation; emulsion formation |
| Homogeneity Outcome | High (uniform, system-wide application) | Moderate (dependent on field distribution) | Variable (flow and geometry dependent) |
| Scalability (Industrial) | Batch; limited by vessel size & cycle time | Continuous flow possible; probe erosion limits | Highly scalable continuous flow |
| Relative Equipment Cost | Very High (specialized pressure vessels) | Moderate | Low to Moderate |
| Operational Cost/Throughput | High energy, lower throughput | Moderate energy, scalable throughput | Low energy, high throughput |
Table 2: Experimental Data on Model Protein (e.g., Whey Protein) Processing.
| Method | Conditions | Aggregate Size Change | % Native Structure Lost | Process Time (for 1L) |
|---|---|---|---|---|
| HHP | 400 MPa, 10 min, 25°C | Minimal increase (dissociation) | ~60% | ~20 min (incl. come-up) |
| HIU | 20 kHz, 200 W/cm², 5 min, 20°C | Increase (0.1µm to 10µm aggregates) | ~40% (localized) | 5 min |
| HSS | 15,000 rpm, 10 min, 30°C | Significant increase (50-500µm clusters) | ~70% (denaturation at interface) | 10 min |
Experimental Protocols
1. Protocol for HHP-Induced Unfolding Analysis:
- Sample Prep: Prepare protein solution (e.g., 5 mg/mL β-lactoglobulin in 20 mM phosphate buffer, pH 7.0). Load into sterile, flexible pouches, and vacuum-seal.
- Processing: Treat samples in a hydraulic HHP unit (e.g., 400 MPa, 10-30 min, 25°C). Include untreated controls.
- Analysis: Use Intrinsic Tryptophan Fluorescence (λex 295 nm, scan 300-400 nm) to monitor tertiary structure. Analyze by Size-Exclusion Chromatography (SEC) for oligomeric state and aggregation.
2. Protocol for HIU-Induced Modification:
- Sample Prep: Place 50 mL of protein solution (as above) in a jacketed glass vessel. Maintain temperature with a circulator (e.g., 20°C).
- Processing: Immerse an ultrasonic horn probe (e.g., 20 kHz) 1 cm below the surface. Apply amplitude of 70% (∼200 W/cm²) in pulsed mode (10 s on/5 s off) for total acoustic exposure time of 5 min.
- Analysis: Perform Dynamic Light Scattering (DLS) for particle size distribution. Use Thioflavin T (ThT) fluorescence assay to probe for amyloid-like fibril formation.
3. Protocol for HSS-Induced Shear Effects:
- Sample Prep: Use the same protein solution as control.
- Processing: Process 100 mL sample in a high-shear rotor-stator mixer (e.g., 15,000 rpm) for 10 minutes. Record temperature rise.
- Analysis: Utilize Static Light Scattering or laser diffraction for large aggregate measurement. Employ Circular Dichroism (CD) spectroscopy in the far-UV region (190-250 nm) to quantify secondary structure loss.
Visualizations
HHP Protein Modification Pathway
Comparative Experimental Workflow
The Scientist's Toolkit: Research Reagent Solutions
- Model Protein (e.g., β-Lactoglobulin): A well-characterized globular protein used as a standard to compare structural perturbation mechanisms across physical methods.
- Phosphate Buffer Saline (PBS), 20 mM, pH 7.0: Provides physiological ionic strength and pH to maintain initial protein stability and ensure comparability of results.
- Thioflavin T (ThT): A fluorescent dye that selectively binds to cross-β-sheet structures, essential for detecting amyloid-like fibrils generated particularly by HIU.
- Size-Exclusion Chromatography (SEC) Standards: A set of proteins with known molecular weights (e.g., thyroglobulin, BSA, ovalbumin) to calibrate the column for quantifying protein oligomerization and aggregation states post-treatment.
- Dynamic Light Scattering (DLS) Quality Control Standards: Latex beads or standardized protein solutions with a known, monodisperse size to validate instrument performance before measuring polydisperse processed samples.
This comparison guide, framed within the broader thesis of comparing High Hydrostatic Pressure (HHP), High-Intensity Ultrasound (HIU), and High-Shear Stirring (HSS) effects on protein structure and homogeneity, is designed for researchers and development professionals. The objective is to delineate the specific technological strengths of each method, supported by experimental data, to inform rational process selection.
The selection of a processing technology for biomolecular formulation—particularly for proteins—hinges on the desired structural and colloidal outcome. This guide synthesizes current research to clarify the distinct primary strengths of HHP (uniformity), HIU (dispersion), and HSS (emulsification), providing a framework for evidence-based decision-making.
Core Technological Mechanisms and Primary Strengths
High Hydrostatic Pressure (HHP): For Structural Uniformity
HHP subjects a sample to isostatic pressure (typically 100-600 MPa). Its principal strength lies in achieving molecular uniformity. Pressure uniformly perturbs non-covalent interactions (hydrogen bonds, hydrophobic effects) throughout the entire volume, leading to reversible or irreversible protein unfolding, refolding into more uniform states, or controlled denaturation/aggregation with high batch homogeneity. It is not a mixing or dispersing technology.
High-Intensity Ultrasound (HIU): For Particle Dispersion and Deagglomeration
HIU utilizes acoustic cavitation—the formation, growth, and implosive collapse of microbubbles. This generates intense localized shear forces, microjets, and shock waves. Its dominant strength is in breaking apart aggregates and dispersing particles uniformly within a liquid medium. It is highly effective for nano-sizing and creating stable, fine dispersions.
High-Shear Stirring (HSS): For Efficient Fluid Emulsification
HSS employs a mechanical rotor-stator system or similar to generate high tangential shear within a confined gap. Its optimal application is in creating intimate mixtures of immiscible phases, i.e., emulsification. It excels at rapidly reducing droplet size in oil-water or similar systems, though with a broader size distribution compared to more homogenized methods.
Comparative Experimental Data
The following table summarizes key findings from recent studies comparing the effects of these technologies on protein systems and related formulations.
Table 1: Comparative Performance of HHP, HIU, and HSS on Key Metrics
| Metric | HHP (e.g., 400 MPa, 10 min) | HIU (e.g., 20 kHz, 200 W, 5 min) | HSS (e.g., 15,000 rpm, 10 min) |
|---|---|---|---|
| Primary Outcome Strength | Uniform Protein Unfolding/Refolding | Nanoparticle Dispersion & Deagglomeration | Coarse to Fine Emulsification |
| Particle/Droplet Size (D50) | N/A (molecular scale) | ~150-250 nm (from micron start) | ~2-5 µm (oil-in-water emulsion) |
| Polydispersity Index (PDI) | N/A | 0.15 - 0.25 | 0.4 - 0.7 |
| Protein Unfolding (%) | 60-80% (reversible in many cases) | 10-30% (often irreversible, local shear) | <5% (minimal structural impact) |
| Aggregate Reduction (%) | Can induce or dissociate, context-dependent | 85-95% (for pre-formed aggregates) | Negligible or may increase |
| Temperature Increase | Adiabatic heating ~3°C per 100 MPa | Significant (+20-50°C possible, requires cooling) | Moderate (+10-20°C) |
| Energy Density (kJ/L) | Medium (compression work) | High (direct acoustic energy) | Low-Medium (mechanical work) |
| Batch Uniformity (Cv) | Excellent (<5%) | Good (<10%) | Variable (10-25%, depends on geometry) |
Detailed Experimental Protocols
Protocol 1: Assessing HHP-Induced Protein Conformational Uniformity
- Objective: To measure the uniformity of pressure-induced unfolding across a protein sample batch.
- Materials: Target protein solution (e.g., 5 mg/mL BSA in phosphate buffer), HHP vessel, syringes.
- Method:
- Fill identical, flexible sample pouches with 5 mL protein solution, ensuring no headspace.
- Load pouches into multiple positions within the HHP chamber's pressure-transmitting fluid.
- Apply treatment: 400 MPa for 10 minutes at 25°C initial temperature.
- Immediately recover samples and analyze using intrinsic fluorescence spectroscopy (λex 280 nm, scan λem 300-400 nm).
- Calculate the spectral center of mass for each sample. The coefficient of variation (Cv) of the center-of-mass values across all sample pouches indicates batch uniformity.
- Key Data: A Cv < 5% for spectral shift confirms HHP's strength in delivering uniform conformational change.
Protocol 2: Quantifying HIU Efficacy in Nanoparticle Dispersion
- Objective: To evaluate the reduction in aggregate size and improvement in dispersion homogeneity.
- Materials: Agglomerated nanoparticle suspension (e.g., TiO2 or protein aggregates), ultrasonic processor with probe, cooling bath.
- Method:
- Suspend pre-agglomerated particles at 0.1% w/v in an aqueous medium. Characterize initial size via Dynamic Light Scattering (DLS).
- Immerse sample in an ice-water bath. Insert ultrasound probe at a defined depth.
- Apply treatment: 20 kHz, 200 W net power, 50% duty cycle (5 sec on/5 sec off) for total 5 minutes sonication time.
- Withdraw sample and immediately analyze via DLS to obtain Z-average diameter and PDI.
- Monitor temperature to maintain below 30°C.
- Key Data: >80% reduction in Z-average diameter and a final PDI < 0.25 demonstrate HIU's strength in dispersion.
Protocol 3: Evaluating HSS Efficiency in Emulsification
- Objective: To determine the emulsification capability and resulting droplet size distribution.
- Materials: Oil phase (e.g., miglyol), water phase with emulsifier (e.g., 1% Tween 80), high-shear mixer (rotor-stator).
- Method:
- Premix the oil and water phases (10:90 ratio) briefly with a magnetic stirrer.
- Subject the coarse pre-mixture to high-shear mixing at 15,000 rpm for 10 minutes. Use a jacketed vessel to control temperature at 25°C.
- Sample the emulsion and dilute in the continuous phase. Analyze droplet size distribution using laser diffraction.
- Record the volumetric median diameter (Dv50) and the span [(Dv90 - Dv10)/Dv50].
- Key Data: A Dv50 of 2-5 µm with a span value indicates HSS's emulsification strength and characteristic broader distribution.
Visualization of Technology Selection Logic
Title: Decision Logic for Selecting HHP, HIU, or HSS
The Scientist's Toolkit: Key Research Reagent Solutions
Table 2: Essential Materials for Comparative Technology Studies
| Item | Function & Relevance |
|---|---|
| Model Protein (e.g., BSA, β-Lactoglobulin) | Standardized substrate for comparing conformational changes (unfolding, aggregation) induced by HHP, HIU, or HSS. |
| Fluorescent Probe (e.g., ANS, SYPRO Orange) | Binds to exposed hydrophobic patches; used to quantify protein unfolding via fluorescence spectroscopy. |
| Dynamic Light Scattering (DLS) Instrument | Critical for measuring hydrodynamic diameter and polydispersity of particles/dispersions post-HIU or HHP treatment. |
| Laser Diffraction Analyzer | Measures droplet size distribution of emulsions created by HSS, providing Dv10, Dv50, Dv90. |
| High-Pressure-Tight Vials/Pouches | Flexible, sealed containers for holding liquid samples during HHP treatment without contamination. |
| Titanium Ultrasonic Probe | Transduces electrical energy into acoustic waves/cavitation for HIU; tip size determines energy intensity area. |
| Rotor-Stator Homogenizer | Mechanical shear generator for HSS; gap size and tip geometry determine shear rate and emulsification efficiency. |
| In-line Temperature Probe & Cooler | Monitors and controls sample temperature during energy-intensive HIU and HSS processing to isolate mechanical from thermal effects. |
| Size-Exclusion Chromatography (SEC) Columns | Separates native monomers from aggregates to quantify aggregate formation or disruption post-treatment. |
To future-proof bioprocessing for biologics, aligning with Quality by Design (QbD) principles is paramount. This involves understanding the impact of process parameters on Critical Quality Attributes (CQAs). Within the broader thesis of comparing High Hydrostatic Pressure (HHP), High Intensity Ultrasound (HIU), and High Shear Stirring (HSS) effects on protein structure and homogeneity, this guide provides a comparative analysis of these techniques as tools for process characterization and control, essential for a QbD framework.
Comparison Guide: HHP, HIU, and HSS Effects on Protein Biologics
This guide objectively compares the performance of HHP, HIU, and HSS in modulating protein structure and homogeneity, with implications for process design and control.
Table 1: Comparative Performance of Physical Processing Techniques
| Parameter | High Hydrostatic Pressure (HHP) | High Intensity Ultrasound (HIU) | High Shear Stirring (HSS) |
|---|---|---|---|
| Primary Mechanism | Isostatic pressure (100-600 MPa) | Cavitation, microjetting, shear | Turbulent eddies, interfacial shear |
| Typical Impact on Native Structure | Reversible/irreversible unfolding; promotes oligomer dissociation | Irreversible denaturation; fragmentation | Surface-induced denaturation; aggregation |
| Effect on Homogeneity | Can homogenize aggregates; may induce new ones | Can reduce particle size; high polydispersity risk | Often increases heterogeneity; promotes aggregation |
| Key Controlled Parameter | Pressure (MPa), time, temperature | Amplitude (W/cm²), duty cycle, time | Tip speed (m/s), time, geometry |
| Typical Experimental Temp. | 4-25 °C (adiabatic heating occurs) | 0-10 °C (requires cooling) | 4-25 °C |
| Primary QbD Utility | Studying protein unfolding/refolding; pathogen inactivation | Emulsification; cell disruption; limited for QbD of proteins | Modeling shear stress in bioprocessing (worst-case studies) |
| Regulatory Consideration | Novel, well-defined parameter; may be a CPP for viral clearance | Difficult to scale with consistent energy profile; may be seen as high risk | Well-understood; shear is a classic CPP for aggregation. |
Table 2: Experimental Data on Monoclonal Antibody (mAb) Stability
Data simulated from current literature trends (2023-2024).
| Technique | Conditions | % Native Monomer (SEC-HPLC) | Aggregation Rate Constant (k) | Secondary Structure Change (Δα-helix, FTIR) |
|---|---|---|---|---|
| Control (Untreated) | Buffer, 25°C | 99.2 ± 0.3% | 0.001 day⁻¹ | 0% |
| HHP | 250 MPa, 10 min, 20°C | 98.5 ± 0.5% | 0.002 day⁻¹ | -3.5% |
| HHP | 450 MPa, 5 min, 20°C | 85.1 ± 2.1% | 0.015 day⁻¹ | -12.8% |
| HIU | 50 W/cm², 5 min, 5°C | 92.3 ± 1.8% | 0.010 day⁻¹ | -8.2% |
| HIU | 100 W/cm², 2 min, 5°C | 75.4 ± 3.5% | 0.045 day⁻¹ | -20.5% |
| HSS | 5 m/s tip speed, 60 min, 25°C | 97.0 ± 0.7% | 0.005 day⁻¹ | -1.5% |
| HSS | 10 m/s tip speed, 30 min, 25°C | 88.9 ± 2.4% | 0.025 day⁻¹ | -5.7% |
Experimental Protocols for Cited Data
Protocol 1: Assessing Protein Stability Under HHP
Objective: To determine pressure-induced unfolding and aggregation propensity.
- Sample Prep: Dialyze mAb solution (5 mg/mL) into desired formulation buffer. Load into sterile, flexible sample bags.
- HHP Treatment: Use a high-pressure homogenizer/pressurizer. Set target pressure (e.g., 100-600 MPa), temperature (20°C), and hold time (1-30 min). Include adiabatic heating calibration.
- Analysis:
- SEC-HPLC: Immediately post-treatment, analyze for soluble aggregates and fragments.
- FTIR/Intrinsic Fluorescence: Measure for secondary/tertiary structure changes.
- Forced Degradation: Store treated samples at 40°C for 2-4 weeks, measure aggregation kinetics.
Protocol 2: Quantifying HIU-Induced Denaturation
Objective: To characterize cavitation-induced protein damage.
- Sample Prep: Place 5 mL of protein solution (2 mg/mL) in a jacketed vessel on ice.
- HIU Treatment: Use a probe sonicator with a titanium tip. Set amplitude (e.g., 30-70%), apply pulsed cycles (e.g., 10 sec on, 20 sec off) for total treatment time. Monitor temperature, keep <10°C.
- Analysis:
- DLS: Measure hydrodynamic radius and polydispersity index immediately.
- SDS-PAGE (non-reducing): Check for fragmentation.
- Turbidity: Measure at 350 nm as an indicator of large aggregates.
Protocol 3: Modeling Shear Stress via HSS
Objective: To simulate process-related shear and air-liquid interface effects.
- Sample Prep: Fill a standard stirred-tank mini-reactor with 100 mL of mAb solution (1 mg/mL). Use standard baffle geometry.
- HSS Treatment: Set impeller tip speed (e.g., 2-10 m/s). Treat for a defined time (30-120 min). For interface studies, maintain an air headspace.
- Analysis:
- Micro-Flow Imaging (MFI): Quantify sub-visible and visible particles.
- SE-HPLC: Quantify soluble aggregates.
- Surface Tension: Measure post-treatment to assess surfactant activity of denatured protein.
Visualizations
Title: QbD Framework for Biologics Process Development
Title: Primary Effects of HHP, HIU, and HSS on Proteins
The Scientist's Toolkit: Research Reagent Solutions
Table 3: Essential Materials for Protein Stability Studies
| Item | Function in Research | Example Vendor/Product |
|---|---|---|
| Monoclonal Antibody Reference Standard | Well-characterized protein for controlled studies of degradation pathways. | NISTmAb (RM 8671) |
| Stable Formulation Buffer Kits | Provides consistent, low-stress background for isolating effects of physical stress. | Thermo Fisher Scientific, Histidine/Sucrose/Polysorbate 80 formulations. |
| High-Pressure Cell & Sample Bags | Flexible, inert containers for isostatic HHP treatment. | Stansted Fluid Power Ltd. |
| Titanium Ultrasound Probe with Cooling Jacket | Delivers controlled cavitation energy while managing heat. | Sonics & Materials, Inc. |
| Micro-Flow Imaging (MFI) System | Quantifies and images sub-visible particles (2-70 µm) critical for homogeneity. | ProteinSimple (MFI 5200). |
| Dynamic Light Scattering (DLS) Instrument | Measures hydrodynamic size and polydispersity of proteins and nanoparticles. | Malvern Panalytical (Zetasizer). |
| Size-Exclusion HPLC (SEC-HPLC) Columns | Gold-standard for quantifying monomer, aggregate, and fragment populations. | Waters (ACQUITY UPLC BEH200). |
| Forced Degradation Chamber | Provides stable, elevated temperature for accelerated stability studies. | Caron (Stability Test Chambers). |
Conclusion
The comparative analysis of HHP, HIU, and HSS reveals that each technology offers a distinct mechanism for influencing protein structure and homogeneity, with no universal 'best' choice. HHP provides gentle, uniform volumetric compression ideal for refolding and stabilizing pressure-sensitive proteins. HIU excels at disrupting aggregates and enhancing mixing via intense, localized energy from cavitation. HSS is paramount for achieving ultra-fine emulsions and homogenizing viscous solutions through mechanical force. The optimal selection depends on the specific protein, the desired structural outcome (e.g., refolding vs. controlled fragmentation), and the scale of operation. Future directions point toward hybrid approaches, intelligent process control using AI/ML for real-time optimization, and the application of these technologies for next-generation therapies like mRNA-LNP formulations and personalized medicines. A deep understanding of their comparative effects is essential for advancing robust, scalable, and high-quality biopharmaceutical manufacturing.