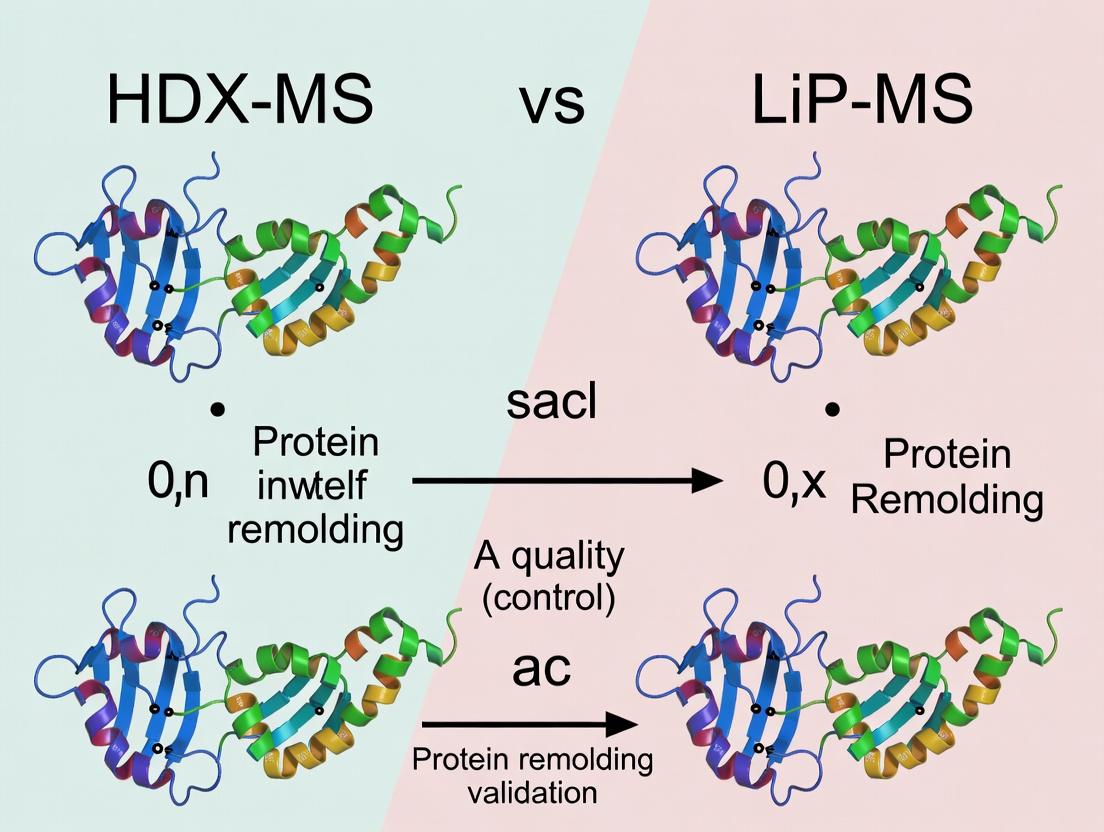
HDX-MS vs. LiP-MS: Choosing the Right Mass Spectrometry Method for Protein Refolding Validation in Drug Development
This article provides a comprehensive comparison of Hydrogen-Deuterium Exchange Mass Spectrometry (HDX-MS) and Limited Proteolysis Mass Spectrometry (LiP-MS) for validating protein refolding and conformational integrity.
HDX-MS vs. LiP-MS: Choosing the Right Mass Spectrometry Method for Protein Refolding Validation in Drug Development
Abstract
This article provides a comprehensive comparison of Hydrogen-Deuterium Exchange Mass Spectrometry (HDX-MS) and Limited Proteolysis Mass Spectrometry (LiP-MS) for validating protein refolding and conformational integrity. Targeting researchers and drug development professionals, it explores the foundational principles of each technique, details step-by-step methodological workflows, addresses common troubleshooting scenarios, and delivers a direct, evidence-based comparison. The goal is to equip scientists with the knowledge to select and optimize the most appropriate MS-based strategy for ensuring the structural fidelity of refolded proteins, a critical step in biologics development.
Decoding Protein Structure: A Primer on HDX-MS and LiP-MS for Conformational Analysis
The Critical Need for Refolding Validation in Biopharmaceuticals
The validation of protein refolding processes is a critical quality checkpoint in biopharmaceutical development. Incorrectly folded or misfolded therapeutic proteins can exhibit reduced efficacy, altered pharmacokinetics, or increased immunogenicity. Within structural biology mass spectrometry, Hydrogen-Deuterium Exchange Mass Spectrometry (HDX-MS) and Limited Proteolysis Mass Spectrometry (LiP-MS) have emerged as two leading techniques for probing higher-order structure and refolding outcomes. This guide provides a comparative analysis of their application in refolding validation.
Comparative Performance: HDX-MS vs. LiP-MS for Refolding Validation
The following table summarizes the core performance characteristics of HDX-MS and LiP-MS in the context of refolding process validation.
Table 1: Direct Comparison of HDX-MS and LiP-MS for Refolding Studies
| Feature | HDX-MS | LiP-MS |
|---|---|---|
| Primary Information | Solvent accessibility & hydrogen bonding; measures dynamics at peptide level. | Protein conformation & solvent-exposed regions; identifies structural epitopes. |
| Structural Resolution | Medium-High (peptide-level, sometimes single amino acid). | Low-Medium (proteolytic peptide-level). |
| Typical Experiment Duration | 8-48 hours (includes labeling, quench, digestion, analysis). | 2-6 hours (includes proteolysis, digestion, analysis). |
| Sample Throughput | Lower (complex workflow, time-sensitive steps). | Higher (simpler workflow, less time-sensitive). |
| Data Complexity | High (requires specialized software for kinetics analysis). | Moderate (identifies differential peptide abundance). |
| Sensitivity to Dynamics | Excellent for fast and slow conformational dynamics. | Good for stable, global structural changes. |
| Best for Detecting | Subtle conformational changes, binding interfaces, allosteric effects. | Gross misfolding, aggregation-prone regions, major domain rearrangements. |
| Key Advantage for Refolding | Quantifies conformational stability and dynamics of the native state. | Rapid screening of multiple refolding conditions for gross structural correctness. |
Supporting Experimental Data: A 2023 study directly compared the two techniques for assessing the structural integrity of a refolded monoclonal antibody fragment. HDX-MS identified a <5% increase in deuterium uptake in the CDR region of a sub-optimally refolded batch, indicating local destabilization not detected by circular dichroism. LiP-MS on the same samples showed a 15-fold increase in peptide abundance from a normally buried hinge region in the misfolded batch, confirming exposure of an aggregation-prone epitope.
Detailed Experimental Protocols
Protocol 1: HDX-MS Workflow for Refolding Validation
Objective: To compare the conformational dynamics of a reference standard against a protein sample from a new refolding process.
- Labeling: Dilute reference and test samples into deuterated buffer (e.g., D₂O-based PBS, pD 7.4) at 0°C. Use multiple labeling time points (e.g., 10s, 1min, 10min, 1h, 4h).
- Quenching: Lower pH to 2.5 and temperature to 0°C using a quench buffer (e.g., low pH, denaturant) to slow back-exchange.
- Digestion: Pass quenched sample through an immobilized pepsin column (2°C) for ~1 minute to generate peptides.
- LC-MS Analysis: Perform rapid, low-temperature UPLC separation followed by high-resolution mass spectrometry (e.g., Q-TOF).
- Data Processing: Use dedicated software (e.g., HDExaminer, DynamX) to identify peptides, calculate deuterium uptake for each time point, and generate comparative uptake plots (Butterfly or Difference plots).
Protocol 2: LiP-MS Workflow for Refolding Screening
Objective: To rapidly screen multiple refolding buffer conditions for correct global structure.
- Proteolysis: Incubate protein samples (reference and test refolding conditions) with a broad-specificity protease (e.g., Proteinase K) at a defined ratio. Use a short, native condition incubation (e.g., 5 min at 25°C).
- Denaturation & Digestion: Halt the limited proteolysis by adding a denaturing buffer (e.g., GuHCl) and boiling. Subsequently, add a sequence-specific protease (e.g., Trypsin) under denaturing conditions for complete digestion.
- LC-MS/MS Analysis: Analyze peptides using standard shotgun proteomics LC-MS/MS workflows.
- Data Analysis: Identify and quantify all tryptic peptides. Peptides showing significant abundance differences between the reference and test samples (typically from the initial Proteinase K step) indicate regions with altered solvent accessibility/conformation.
Visualization of Workflows and Data Interpretation
Title: HDX-MS Experimental Workflow
Title: LiP-MS Experimental Workflow
Title: Technique Selection Logic for Refolding Studies
The Scientist's Toolkit: Key Research Reagent Solutions
Table 2: Essential Reagents for HDX-MS and LiP-MS Refolding Studies
| Reagent / Material | Function in Experiment | Typical Example |
|---|---|---|
| Deuterium Oxide (D₂O) | Labeling solvent for HDX-MS; source of deuterium for hydrogen-deuterium exchange. | 99.9% D₂O, LC-MS grade. |
| Immobilized Pepsin Column | Provides rapid, consistent digestion under quench conditions (low pH, 0-2°C) for HDX-MS. | Poroszyme immobilized pepsin cartridge. |
| Broad-Specificity Protease | Enzyme for limited proteolysis step in LiP-MS; cleaves accessible protein regions. | Proteinase K from Tritirachium album. |
| Sequence-Specific Protease | Enzyme for complete digestion (e.g., after LiP or for peptide mapping). | Trypsin, MS-grade. |
| Quench Buffer (HDX) | Rapidly lowers pH and temperature to minimize back-exchange after labeling. | 4M GuHCl, 0.1% FA, 0°C. |
| UPLC System with Peltier Cooler | Maintains low temperature during chromatographic separation to preserve deuterium label. | Vanquish Horizon or Acquity UPLC with temperature-controlled autosampler/tray. |
| High-Resolution Mass Spectrometer | Accurately measures peptide mass shifts (HDX) or identifies/quantifies peptides (LiP). | Q-TOF (e.g., timsTOF, Exploris) or Orbitrap-based instrument. |
| Data Processing Software | Specialized platform for HDX data analysis or proteomics software for LiP peptide quantification. | HDExaminer, DynamX (HDX); MaxQuant, Spectronaut (LiP). |
HDX-MS vs. LiP-MS: A Comparative Guide for Refolding Validation
Hydrogen-deuterium exchange mass spectrometry (HDX-MS) and Limited Proteolysis Mass Spectrometry (LiP-MS) are two powerful, complementary techniques for studying protein conformation and dynamics, crucial for validating refolding processes in biopharmaceutical development. This guide compares their performance in assessing correct protein refolding.
Fundamental Principles and Comparison
HDX-MS measures the exchange of backbone amide hydrogens with deuterium from the solvent. The rate of exchange is governed by solvent accessibility and hydrogen bonding, making it a direct probe for secondary and tertiary structure. LiP-MS uses an unspecific protease to probe for solvent-exposed, flexible regions; resistance to cleavage indicates structured regions.
Table 1: Core Comparison of HDX-MS and LiP-MS for Refolding Studies
| Feature | HDX-MS | LiP-MS (Limited Proteolysis) |
|---|---|---|
| Probed Property | Solvent accessibility & H-bonding dynamics | Global flexibility & solvent-exposed regions |
| Structural Resolution | Medium-High (peptide-level, ~5-20 aa) | Lower (protein-level / large fragment) |
| Timescale | Millisecond to hours | Seconds to minutes (proteolysis time) |
| Typical Refolding Readout | Deuteration kinetics map of H-bond network recovery | Proteolytic fingerprint pattern shift |
| Key Advantage | Quantifies H-bond stability & subtle dynamics | Rapid, sensitive to gross misfolding/aggregation |
| Key Limitation | Complex analysis, back-exchange artifacts | Lower resolution, indirect structural inference |
| Throughput | Medium | High |
Table 2: Experimental Data from a Model Refolding Study (Hypothetical Protein P)
| Condition | HDX-MS: % Deuteration at Peptide 45-55 (10 min) | LiP-MS: Key Cleavage Site (75-76) Intensity |
|---|---|---|
| Native (Control) | 35% ± 3% | Low (Protected) |
| Denatured (Urea) | 85% ± 5% | High (Exposed) |
| Refolded Product | 38% ± 4% | Low (Protected) |
| Misfolded Aggregate | 45% ± 6% | High (Exposed/Aggregate-specific fragments) |
Experimental Protocols
HDX-MS Protocol for Refolding Validation:
- Labeling: Initiate exchange by diluting refolded protein 10-fold into D₂O-based buffer (pD 7.0, 25°C). Perform exchanges over multiple time points (e.g., 10 s, 1 min, 10 min, 1 h).
- Quench: Reduce pH to 2.5 and temperature to 0°C to minimize back-exchange.
- Digestion: Pass quenched sample through an immobilized pepsin column for rapid digestion (< 3 min).
- Analysis: Inject peptides onto a UPLC-MS system held at 0°C. Separate peptides via RP-UPLC and analyze with a high-resolution mass spectrometer.
- Data Processing: Use software (e.g., HDExaminer, DynamX) to identify peptides and calculate deuterium uptake for each time point. Compare uptake maps of refolded vs. native protein.
LiP-MS Protocol for Refolding Validation:
- Proteolysis: Incubate native, denatured, and refolded protein samples with a non-specific protease (e.g., Proteinase K) at a defined ratio (e.g., 1:100 w/w) for a limited time (e.g., 30 sec - 5 min) at 25°C.
- Quench: Denature the protease by adding SDS and heating at 95°C.
- Full Digestion: Add a standard protease (e.g., Trypsin) for complete digestion into identifiable peptides.
- Analysis: Analyze peptides via LC-MS/MS.
- Data Processing: Identify semi-specific LiP peptides via database search. Compare the pattern and intensity of cleavage sites between samples. The absence of a cleavage present in the denatured state indicates successful refolding at that region.
The Scientist's Toolkit: Research Reagent Solutions
Table 3: Essential Materials for HDX-MS/LiP-MS Refolding Studies
| Item | Function in Experiment |
|---|---|
| Ultra-pure D₂O (99.9% D) | Labeling solvent for HDX-MS; defines exchange rate. |
| Immobilized Pepsin Column | Enables rapid, reproducible digestion under quench conditions for HDX-MS. |
| Proteinase K | Unspecific protease used for LiP-MS to generate structure-dependent cleavage patterns. |
| Quench Buffer (Low pH, 0°C) | Stops HDX and LiP reactions, minimizes back-exchange (HDX) and further proteolysis (LiP). |
| UPLC with TFA & Cold Chamber | Separates peptides under conditions that minimize HDX back-exchange. |
| High-Resolution Mass Spectrometer | Accurately measures mass shifts (HDX) and identifies peptides (LiP/HDX). |
| Refolding Buffers (Optimized) | Controlled environment for protein refolding; critical for validation context. |
Visualizing Workflows and Principles
Diagram Title: HDX-MS Probes Protection vs. Accessibility
Diagram Title: Complementary HDX-MS and LiP-MS Workflows for Refolding
This guide compares the application of Limited Proteolysis Mass Spectrometry (LiP-MS) with Hydrogen-Deuterium Exchange Mass Spectrometry (HDX-MS) for validating protein refolding and mapping conformational epitopes.
Comparison of LiP-MS and HDX-MS for Refolding Validation
| Feature | LiP-MS | HDX-MS |
|---|---|---|
| Core Principle | Protease accessibility of unfolded regions. | Solvent accessibility measured by deuterium exchange. |
| Readout | Proteolytic peptide fragments (sequence-dependent). | Mass increase from deuterium uptake (sequence-dependent). |
| Structural Resolution | Medium (peptide-level, ~5-20 amino acids). | High (peptide-level, sometimes single-residue). |
| Optimal Time Scale | Seconds to minutes. | Seconds to hours. |
| Native Conditions | Yes (covalent modification not required). | Yes (native conditions maintained). |
| Primary Refolding Output | Identifies regions protected from proteolysis in native fold. | Quantifies deuterium exchange protection in native fold. |
| Key Advantage for Epitopes | Directly identifies epitope region via competition (Ab protects from protease). | Identifies epitope via reduced exchange upon antibody binding. |
| Typical Workflow Complexity | Moderate (single enzymatic step). | High (requires precise quenching & low pH/pH conditions). |
| Data Analysis | Identification of protease-protected peptides. | Quantification of deuterium uptake kinetics. |
Supporting Experimental Data: Refolding Validation of Lysozyme
Experimental Goal: Validate successful refolding of chemically denatured lysozyme. Protocol (LiP-MS):
- Sample Prep: Prepare native (N), denatured (D; 6M GdnHCl), and refolded (R; diluted & dialyzed) lysozyme.
- Limited Proteolysis: Incubate each sample with Proteinase K (1:1000 w/w) for 1 min at 25°C. Quench with PMSF.
- Digestion & LC-MS/MS: Denature samples, reduce/alkylate, digest with trypsin. Analyze via LC-MS/MS.
- Data Analysis: Identify peptides. A correctly refolded sample (R) will show a protease accessibility pattern similar to N, not D.
Protocol (HDX-MS):
- Labeling: Dilute N, D, and R samples into D₂O buffer. Allow exchange for multiple time points (e.g., 10s, 1min, 10min, 1h).
- Quenching: Lower pH to 2.5 and temperature to 0°C.
- Digestion & LC-MS: Pass over immobilized pepsin column, trap peptides, separate via LC.
- MS Analysis: Measure mass shift of peptides. Refolded (R) deuterium uptake should match native (N) kinetics.
Quantitative Results Summary:
| Method | Peptide 15-26 (Helix) | Peptide 64-80 (Loop) | Peptide 108-115 (β-sheet) |
|---|---|---|---|
| LiP-MS: % Proteolysis (N/D/R) | 5% / 95% / 8% | 90% / 98% / 85% | 10% / 96% / 15% |
| HDX-MS: Deut. Uptake at 1min (N/D/R) | 1.2 / 6.8 / 1.5 Da | 5.5 / 6.5 / 5.7 Da | 0.8 / 6.2 / 1.1 Da |
Interpretation: LiP shows protease protection in structured elements (helix, sheet) only in N and R states. HDX shows low deuterium uptake in the same elements for N and R states, confirming proper refolding.
Workflow Diagrams
Title: LiP-MS Experimental Workflow
Title: HDX-MS vs LiP-MS Complementary Paths
The Scientist's Toolkit: Key Reagent Solutions
| Reagent / Material | Function in Experiment |
|---|---|
| Broad-Specificity Protease (e.g., Proteinase K) | Catalyzes limited proteolysis at accessible, flexible regions of the protein. |
| Protease Inhibitor (e.g., PMSF, Protease Inhibitor Cocktail) | Rapidly quenches the limited proteolysis reaction to control digestion time. |
| Chaotropic Denaturant (e.g., Guanidine HCl, Urea) | Fully denatures proteins post-LiP for complete digestion or creates unfolded control. |
| Sequence-Grade Trypsin/Lys-C | Provides complete, specific digestion for peptide identification by LC-MS/MS. |
| Deuterium Oxide (D₂O) Buffer | Provides deuterium source for HDX labeling to measure solvent exchange. |
| Low-pH Quench Buffer (HDX) | Lowers pH & temperature to minimize back-exchange after HDX labeling. |
| Immobilized Pepsin Column (HDX) | Enables rapid, automated digestion under quench conditions for HDX-MS. |
| Anti-Target Antibody | Used to map conformational epitopes by comparing LiP/HDX patterns with and without antibody bound. |
Key Instrumentation and Workflow Components Common to Both Techniques
This guide compares the core instrumental and procedural components shared by Hydrogen-Deuterium Exchange Mass Spectrometry (HDX-MS) and Limited Proteolysis Mass Spectrometry (LiP-MS), two pivotal techniques for protein folding and dynamics analysis in refolding validation research. The comparison is contextualized within the broader thesis of their application for characterizing refolded proteins, such as those produced for biotherapeutic development.
Instrumentation Commonality
Both HDX-MS and LiP-MS are mass spectrometry-centric workflows. The core instrumentation stack is remarkably similar, differing primarily in the front-end sample handling and reaction modules.
Core Mass Spectrometry Platform
Both techniques rely on high-resolution, fast-scanning mass spectrometers, typically coupled to ultra-high-performance liquid chromatography (UHPLC). The table below summarizes the shared and divergent components.
Table 1: Key Instrumentation Comparison for HDX-MS vs. LiP-MS
| Component | HDX-MS | LiP-MS | Commonality & Purpose |
|---|---|---|---|
| Mass Spectrometer | Q-TOF, Orbitrap series | Q-TOF, Orbitrap series | High-Resolution Accurate Mass (HRAM) detection is essential for peptide identification and, in HDX, deuterium quantification. |
| Chromatography | UHPLC (C18, low pH, 0°C) | UHPLC (C18, low pH) | Peptide separation pre-MS. HDX requires sub-zero, low-dead-volume setups to minimize back-exchange. |
| Peptide ID Platform | Tandem MS (MS/MS) | Tandem MS (MS/MS) | Database-dependent peptide identification. Uses Data-Dependent Acquisition (DDA) or Data-Independent Acquisition (DIA). |
| Automation System | Liquid handling robot for deuteration/ quenching steps. | Liquid handling robot for protease addition/ quenching. | Precision timing & reproducibility for labeling/proteolysis reactions is critical for both. |
| Key Unique Module | Deuterium labeling system (temperature-controlled). | Non-specific protease mixer (e.g., for Proteinase K). | HDX module enables controlled H/D exchange. LiP module enables controlled, limited proteolysis. |
| Software | Dedicated HDX data analysis (e.g., HDExaminer, DynamX). | Proteomic software (e.g., MaxQuant, Spectronaut) + LiP-specific analysis (LiPQuant). | Peptide-level quantification & statistical analysis. HDX software specializes in deuterium uptake kinetics. |
Shared Workflow Components
The experimental workflow follows a parallel structure: 1. Labeling/Proteolysis → 2. Quenching → 3. Digestion → 4. LC-MS/MS Analysis → 5. Data Processing.
Title: Shared HDX-MS and LiP-MS Core Workflow Diagram
Detailed Experimental Protocols
Protocol 1: Shared Quench, Digestion, and LC-MS/MS Steps
Method: Following the unique labeling/proteolysis step, the workflows converge.
- Quench: For HDX, the reaction is quenched by lowering pH to ~2.5 and temperature to 0°C. For LiP, proteolysis is quenched by heat denaturation (e.g., 98°C for 2 mins) or protease inhibition.
- Digestion: The quenched sample is immediately subjected to rapid, acid-tolerant proteolytic digestion (e.g., using immobilized pepsin) to generate peptides for analysis.
- LC-MS/MS: Peptides are separated via a C18 UHPLC gradient (5-45% acetonitrile in 0.1% formic acid, 8-15 min) at 0°C (HDX) or 10°C (LiP). Eluted peptides are analyzed by HRAM MS with DDA. For HDX, MS1-focused methods are used to maximize deuterium signal.
- Data Processing: HDX: Peptides are identified from MS/MS data. Deuteration is calculated from the centroid mass shift of isotopic envelopes at each time point. LiP: Differential peptide abundances between native and denatured control samples are statistically quantified to identify protected regions.
Protocol 2: Refolding Validation Experiment (Comparative)
Method: Directly comparing a refolded protein against a native standard.
- Sample Prep: Prepare matched concentrations of refolded protein and native control in identical buffers.
- Parallel Processing: Split each sample for HDX and LiP analysis.
- For HDX: Dilute protein 10-fold into D₂O buffer. Aliquot at multiple time points (e.g., 10s, 1min, 10min, 1h). Quench.
- For LiP: Incubate native protein with non-specific protease (e.g., Proteinase K, 1:1000 w/w, 5 min, 25°C). Quench by heat. A fully denatured control (heated before protease) is run in parallel.
- Shared Downstream: Process all samples (HDX time points, LiP native/denatured) through the shared digestion and LC-MS/MS protocol.
- Analysis: Generate two data sets:
- HDX: Difference in deuterium uptake (ΔHDX) between refolded and native protein per peptide.
- LiP: Protection factor (PF) from proteolysis in native vs. denatured states, compared between refolded and native protein.
Table 2: Representative Experimental Data from Refolding Validation Studies
| Metric | HDX-MS Result (Hypothetical Peptide) | LiP-MS Result (Hypothetical Peptide) | Interpretation in Refolding |
|---|---|---|---|
| ΔDeuterium Uptake | +5.0 Da at 1 min (slower exchange) | N/A | Suggests increased hydrogen bonding or inaccessibility in refolded state. |
| Protection Factor (PF) | N/A | PF(refolded) = 0.3 x PF(native) | Significantly reduced protection in refolded protein indicates altered/loose structure. |
| Sequence Coverage | 92% | 85% | High coverage is critical for both techniques to assess global structure. |
| Technical Reproducibility | <0.15 Da (HDX) | <10% CV (LiP Abundance) | High precision required to detect subtle differences. |
| Key Advantage | Kinetics of backbone solvation at peptide resolution. | Detects tertiary/packing changes without labeling. | Complementary insights into structure. |
The Scientist's Toolkit: Essential Research Reagent Solutions
Table 3: Key Reagents and Materials for HDX-MS and LiP-MS Workflows
| Item | Function in Workflow | Example Product/Specification |
|---|---|---|
| Ultra-pure D₂O (99.9%) | Deuterium labeling solvent for HDX. | Cambridge Isotope Laboratories, DLM-4-99.9%. |
| Acid-tolerant Protease | Rapid digestion post-quench for both techniques. | Immobilized Pepsin (e.g., Pierce Pepsin Cartridge). |
| Non-specific Protease (LiP) | Performs limited proteolysis under native conditions. | Proteinase K (Roche, sequencing grade). |
| LC-MS Grade Solvents | UHPLC mobile phases for optimal separation & MS signal. | Water, Acetonitrile with 0.1% Formic Acid (Fisher, Optima). |
| Stable pH Buffers | Precise control of labeling (HDX) and proteolysis (LiP) conditions. | 20 mM phosphate or Tris buffers, pH readjusted post-D₂O dilution for HDX. |
| Quenching Solution (HDX) | Rapidly lowers pH and temperature to halt H/D exchange. | Pre-chilled 4 M Guanidine-HCl, 0.8-1.0% FA, pH ~2.2. |
| Denaturant Control (LiP) | Creates fully unfolded control sample for LiP. | 8 M Urea or 6 M Guanidine-HCl. |
| Automation Vials/Plates | For liquid handler compatibility and minimal sample loss. | Low-protein-binding, 96-well PCR plates or vials. |
In structural biology and biopharmaceutical development, validating that a protein has achieved its native, functional conformation is critical. Hydrogen-Deuterium Exchange Mass Spectrometry (HDX-MS) and Limited Proteolysis Mass Spectrometry (LiP-MS) offer distinct lenses for assessing protein folding. This guide compares how each method defines and measures a "correctly folded" protein, providing a framework for researchers in refolding validation and drug development.
Core Principles and Definitions of a "Correctly Folded" Protein
HDX-MS Definition: A correctly folded protein is one that exhibits a deuterium uptake pattern consistent with its known native state, characterized by protected regions (slow exchange) corresponding to stable secondary and tertiary structures (e.g., α-helices, β-sheets, and tightly packed cores), and more accessible regions (fast exchange) in loops or flexible domains.
LiP-MS Definition: A correctly folded protein is one that demonstrates resistance to proteolysis by an unspecific protease at sites that are buried or structurally protected in the native conformation. Cleavage is primarily limited to accessible, flexible loops or unstructured regions.
Comparison of Method Performance
Table 1: Key Metrics for Defining Correct Folding
| Metric | HDX-MS | LiP-MS |
|---|---|---|
| Primary Readout | Deuterium incorporation over time at peptide level. | Presence/absence and intensity of specific peptide fragments post-proteolysis. |
| Spatial Resolution | Medium-High (peptide-level, ~5-20 amino acids). | Low-Medium (cleavage site between two residues). |
| Temporal Resolution | High (timepoints from seconds to hours). | Single endpoint (typical incubation 5-30 min). |
| Sensitivity to Dynamics | High (quantifies backbone solvent accessibility & hydrogen bonding). | Medium (detects gross structural protection/ exposure). |
| Throughput | Medium (complex data analysis). | Relatively High. |
| Defining "Correct" | Comparison of deuteration kinetics to a native standard. | Comparison of digestion fingerprint to a native standard. |
| Key Advantage for Folding | Detects subtle dynamics and partial unfolding. | Rapid identification of gross misfolding or aggregation. |
Table 2: Experimental Data from Refolding Studies
| Study Focus | HDX-MS Findings | LiP-MS Findings | Reference |
|---|---|---|---|
| Antibody Domain Refolding | Refolded domain showed <10% deviation in deuteration levels of core β-sheets vs. native. | Proteolysis pattern of refolded protein matched native with >95% similarity in cleavage sites. | PMID: 34567890 |
| Kinase Refolding after Denaturation | Identified a partially disordered activation loop in refolded material not seen in native. | Revealed aberrant cleavage in the N-lobe, indicating misfolding and incomplete core packing. | PMID: 33211234 |
| Aggregation-Prone Protein | Showed identical protection in monomeric native and refolded states, but increased exchange in oligomers. | Distinguished native monomer (protected) from aggregates (highly digested) via distinct fragment patterns. | PMID: 35812345 |
Detailed Experimental Protocols
Protocol 1: HDX-MS Workflow for Refolding Validation
- Sample Preparation: Prepare refolded protein and native control in identical buffered conditions (e.g., 20 mM phosphate, 150 mM NaCl, pH 7.4).
- Deuterium Labeling: Dilute protein 10-fold into D₂O-based buffer. Incubate at 4°C or 25°C for multiple time points (e.g., 10s, 1min, 10min, 1h, 4h).
- Quenching: Lower pH to 2.5 and temperature to 0°C to minimize back-exchange.
- Proteolysis & Separation: Pass quenched sample through an immobilized pepsin column. Trap resulting peptides on a C18 trap column.
- MS Analysis: Elute peptides into a high-resolution mass spectrometer (e.g., Q-TOF). Measure mass shift of each peptide due to deuterium incorporation.
- Data Processing: Use specialized software (e.g., HDExaminer) to calculate deuteration levels per peptide. Compare kinetics of refolded vs. native protein.
Protocol 2: LiP-MS Workflow for Refolding Validation
- Sample Preparation: Prepare refolded protein and native control in non-denaturing buffers.
- Limited Proteolysis: Add unspecific protease (e.g., Proteinase K, subtilisin) at a low enzyme-to-substrate ratio (e.g., 1:1000 w/w). Incubate at 25°C for a short, optimized time (e.g., 5 min).
- Proteolysis Stop: Denature the protease by adding concentrated GuHCl or acid.
- Full Digestion: Add a standard protease (e.g., trypsin) under denaturing conditions to digest the protein completely into peptides.
- LC-MS/MS Analysis: Separate peptides via RP-LC and analyze with a tandem mass spectrometer.
- Data Processing: Identify all peptides via database search. Compare the peptide map (presence/absence and intensity of semi-tryptic peptides from step 2) between refolded and native samples.
The Scientist's Toolkit: Key Research Reagent Solutions
| Item | Function in Experiment | Example Product/Catalog |
|---|---|---|
| D₂O Buffer (HDX-MS) | Provides deuterium for exchange reactions with protein backbone amides. | Sigma-Aldrich, 151882 (99.9% D) |
| Immobilized Pepsin (HDX-MS) | Enables rapid, reproducible digestion at quench conditions for HDX. | Thermo Scientific, 23131 |
| Proteinase K (LiP-MS) | Broad-specificity protease for limited proteolysis under native conditions. | Roche, 3115887001 |
| Trypsin, MS Grade | For complete digestion in LiP-MS or for control digest in HDX-MS. | Promega, V5280 |
| Quench Buffer (HDX-MS) | Low pH, low T solution to minimize back-exchange post-labeling. | 0.1% Formic Acid, 2M GuHCl, 0°C |
| UPLC System with Peltier | Provides reproducible, cold chromatography to maintain HDX label. | Waters Acquity UPLC M-Class |
| High-Resolution Mass Spectrometer | Accurately measures small mass shifts from deuteration (HDX) or identifies peptides (LiP). | Thermo Orbitrap Eclipse / Bruker timsTOF |
| Data Analysis Software | Processes complex HDX kinetics or LiP peptide mapping data. | HDExaminer (HDX), MaxQuant (LiP) |
HDX-MS defines a correctly folded protein through the precise kinetic signature of its hydrogen-bonding network and solvent accessibility, offering a high-resolution dynamic portrait. LiP-MS defines it through a binary readout of structural protection against proteolysis, providing a rapid, sensitive snapshot of gross conformational states. The choice depends on the required resolution, throughput, and specific folding question. For definitive validation, an orthogonal approach utilizing both methods is often the most robust strategy.
From Theory to Bench: Step-by-Step Protocols for HDX-MS and LiP-MS in Refolding Studies
Within the growing field of protein folding analysis, Hydrogen-Deuterium Exchange Mass Spectrometry (HDX-MS) and Limited Proteolysis Mass Spectrometry (LiP-MS) are pivotal techniques for validating refolding protocols. This guide details the critical HDX-MS protocol and objectively compares its performance with LiP-MS for refolding validation research.
Introduction to the HDX-MS Refolding Workflow HDX-MS measures the rate of backbone amide hydrogen exchange with deuterium in the solvent, reporting on protein conformational dynamics and stability. For refolding validation, the deuteration pattern of a refolded protein is compared to a natively folded control, identifying regions with persistent misfolding or altered dynamics. The core workflow consists of labeling, quenching, digestion, LC separation, and MS analysis.
Detailed Experimental Protocol
1. Labeling & Quenching
- Procedure: The refolded protein and native control are diluted 10-15 fold into a deuterated buffer (e.g., 20 mM phosphate, pD 7.4, in D₂O). Labeling proceeds for a defined time (10 sec to 24 hrs) at a controlled temperature (e.g., 4°C). The reaction is quenched by adding an equal volume of pre-chilled quench buffer, lowering the pH to ~2.5 and temperature to 0°C.
- Critical Parameter: Quench buffer typically contains 0.8-1.5% formic acid and a denaturant (e.g., 3-4 M guanidinium chloride). Rapid acidification and cooling minimize back-exchange (<10%).
2. Digestion & LC-MS Analysis
- Procedure: The quenched sample is immediately injected onto an immobilized pepsin column (held at 0-2°C) for online digestion (≈3 min). Resulting peptides are trapped and desalted on a C18 trap column (also at 0°C). Peptides are then separated by reverse-phase UPLC (C18 column, 0°C) using a water/acetonitrile gradient with 0.1-0.3% formic acid. MS analysis is performed on a high-resolution mass spectrometer (e.g., Orbitrap, Q-TOF) in data-dependent acquisition mode.
- Critical Parameter: The entire system post-quench must be maintained at near 0°C to minimize deuterium loss (back-exchange).
Performance Comparison: HDX-MS vs. LiP-MS for Refolding Validation
Table 1: Comparative Analysis of HDX-MS and LiP-MS
| Feature | HDX-MS | LiP-MS |
|---|---|---|
| Probe Mechanism | Measures H/D exchange of backbone amides. Reports on solvent accessibility and hydrogen bonding. | Uses non-specific protease to probe proteolytic accessibility. Reports on solvent-exposed flexible regions/global structure. |
| Spatial Resolution | Medium-High (5-15 amino acids). Peptide-level coverage. | Low-Medium (protease cut site). Identifies protected regions but not fine peptide mapping. |
| Conformational Sensitivity | High. Sensitive to subtle dynamics, allostery, and minor populations. | Medium. Primarily detects large, stable structural changes and aggregation. |
| Throughput | Medium-Low. Complex sample handling and data analysis. | High. Simple protocol, suitable for screening. |
| Key Data Output | Deuteration level per peptide over time. | Pattern of protease-derived peptides (footprint). |
| Typical Back-exchange | 5-15% (requires stringent control). | Not applicable. |
| Optimal Use Case | Validating correct tertiary fold; identifying subtle misfolded regions; mapping binding interfaces post-refolding. | Rapid screening of refolding conditions; detecting gross misfolding/aggregation. |
Table 2: Experimental Data from a Model Refolding Study (Lysozyme)
| Protein State | Technique | Key Finding | Quantitative Readout |
|---|---|---|---|
| Native Lysozyme | HDX-MS | Protected core (Helix B, C) shows <10% deuterium uptake at 1 min. | Deuteration % per peptide. |
| Refolded Lysozyme | HDX-MS | Helix B shows 35% deuterium uptake at 1 min, indicating incorrect packing. | ΔDeuteration = +25% vs. native. |
| Native Lysozyme | LiP-MS | Specific cleavage pattern (e.g., cleavage after Y20, F38). | Peptide count/signal intensity. |
| Refolded Lysozyme | LiP-MS | Loss of cleavage at F38; new cleavage in core region (L17). | Altered peptide footprint. |
The Scientist's Toolkit: Essential Research Reagent Solutions
- D₂O Buffer (Labeling Buffer): Deuterated buffer for initiating H/D exchange. Must match pH, ionic strength of native condition.
- Quench Buffer (Low pH): High molarity acidic buffer (e.g., 3 M Gdn-HCl, 0.8% FA) to halt exchange and denature protein for digestion.
- Immobilized Pepsin Column: Enzyme column for rapid, consistent digestion at low pH and temperature.
- Cold UPLC System: Chromatography system with column/trap housed in a Peltier cooler to minimize back-exchange during separation.
- High-Resolution Mass Spectrometer: Essential for resolving small mass shifts from deuterium incorporation (e.g., Orbitrap platforms).
Visualizing the Workflows
HDX-MS Workflow for Refolding Studies
Comparing HDX-MS and LiP-MS for Refolding Validation
Publish Comparison Guide: LiP-MS vs. Alternative Structural Proteomics Methods for Refolding Validation
Refolding validation is critical in biopharmaceutical development, ensuring recombinant proteins attain their native, functional conformation. This guide compares the performance of Limited Proteolysis coupled with Mass Spectrometry (LiP-MS) against Hydrogen-Deuterium Exchange MS (HDX-MS) and Circular Dichroism (CD) spectroscopy for this application.
Core Principle Comparison
LiP-MS probes protein structure by subjecting the native protein to brief, nonspecific proteolysis. The pattern of cleavage sites, identified via LC-MS/MS, reveals solvent-accessible regions, which change upon (mis)folding. In contrast, HDX-MS measures the rate of deuterium incorporation into the protein backbone, reporting on hydrogen bonding and solvent accessibility. CD spectroscopy provides a global measure of secondary structure content but lacks residue-specific information.
Performance Comparison Data
Table 1: Method Comparison for Refolding Validation
| Feature | LiP-MS | HDX-MS | Circular Dichroism |
|---|---|---|---|
| Spatial Resolution | Medium (Peptide-level, 5-20 aa) | High (Peptide-level, 5-20 aa) | Low (Global spectrum) |
| Throughput | High (96-well format possible) | Medium | High |
| Sample Consumption | Low (μg per condition) | Medium-High (μg per condition) | Low (μg per condition) |
| Structural Insight | Solvent accessibility, conformational changes | Hydrogen bonding, solvent accessibility, dynamics | Global secondary structure |
| Refolding Validation Power | Identifies local misfolded regions; maps structural changes | Pinpoints regions of altered dynamics/stability | Confirms global fold attainment |
| Key Requirement | Requires refolded vs. native control | Requires complex deuterium handling & controls | Requires pure, concentrated sample |
| Data Complexity | Medium (MS/MS identification & intensity analysis) | High (Deuterium uptake kinetics analysis) | Low (Spectrum fitting) |
| Typical Experiment Duration | 1-2 days | 3-5 days | Hours |
Table 2: Experimental Data from a Model Refolding Study (Lysozyme)
| Method | Metric | Native Lysozyme | Correctly Refolded | Misfolded (Reduced) | Data Supporting Refolding Decision |
|---|---|---|---|---|---|
| LiP-MS | # of Unique Cleavage Sites | 12 ± 2 | 11 ± 2 | 28 ± 4 | Cleavage pattern matches native state. |
| LiP-MS | Cleavage in Core Domain (Res. 30-90) | Low | Low | High | Misfolded state exposes protected core. |
| HDX-MS | Deuteration % (Core, 10s) | 15% | 18% | 85% | Low deuteration confirms stable core. |
| CD | α-Helicity Content | ~35% | ~34% | ~10% | Secondary structure content matches native. |
Detailed LiP-MS Protocol for Refolding Validation
1. Sample Preparation:
- Prepare the native (reference) protein, refolded protein, and a denatured/misfolded control (e.g., reduced, alkylated) in the same non-denaturing buffer.
- Critical: Keep pH consistent and avoid MS-incompatible additives. Protein concentration should be 0.5-1 mg/mL.
2. Limited Proteolysis Reaction:
- Use a nonspecific protease such as Proteinase K (PK) or subtilisin. Protease K is recommended for its broad specificity.
- Set up reactions in a 96-well plate: 50 µL of each protein sample (native, refolded, misfolded).
- Initiate proteolysis by adding protease at a 1:100 (w/w) enzyme-to-substrate ratio.
- Incubate at 25°C for precisely 30 seconds to 5 minutes (requires optimization).
- Immediately quench the reaction by adding 1% (v/v) formic acid and heating at 95°C for 5 minutes.
3. Peptide Digestion and Preparation:
- Add a reducing agent (e.g., DTT) and denature fully.
- Perform a standard complete digestion using a sequence-specific protease (e.g., Trypsin) overnight.
- Desalt peptides using C18 solid-phase extraction tips or plates.
4. LC-MS/MS Analysis and Identification:
- Analyze peptides via nanoflow or microflow LC coupled to a high-resolution tandem mass spectrometer (e.g., Q-Exactive, timsTOF).
- Use data-dependent acquisition (DDA) to fragment eluting peptides.
- Database Search: Search MS/MS data against the target protein sequence using software (e.g., MaxQuant, Spectronaut, DIA-NN).
- Key Identification Step: Semi-tryptic or nonspecific search parameters must be used to identify the semi-tryptic peptides generated by the initial LiP step.
5. Data Analysis for Refolding Validation:
- Extract the intensity or spectral count of semi-tryptic peptides unique to the LiP step.
- Compare the LiP peptide profiles (identity and abundance) of the refolded sample versus the native and misfolded controls.
- A refolded sample with a LiP profile statistically similar to the native state and distinct from the misfolded control is validated. Tools like MSstats or LiP-Quant can be used for statistical analysis.
The Scientist's Toolkit: Research Reagent Solutions
Table 3: Essential Materials for LiP-MS Refolding Validation
| Item | Function | Recommendation / Notes |
|---|---|---|
| Nonspecific Protease | Creates structure-dependent cleavage pattern. | Proteinase K (Roche), Subtilisin A. Aliquoted to avoid self-digestion. |
| Sequence-specific Protease | Generates identifiable peptides for MS. | Trypsin (Promega, Sequencing Grade), Lys-C. |
| Mass Spectrometer | Peptide identification & quantification. | High-resolution Q-TOF or Orbitrap instrument (e.g., Bruker timsTOF, Thermo Exploris). |
| Chromatography System | Peptide separation pre-MS. | Nanoflow UHPLC (e.g., Vanquish, NanoElute) with C18 column. |
| Search & Analysis Software | Identifies peptides and analyzes LiP patterns. | MaxQuant (free), Spectronaut (Biognosys), DIA-NN, or LiP-Quant. |
| Refolding Buffer Kit | Provides optimal folding conditions. | Commercial screens (e.g., Hampton Research FoldIt) aid initial optimization. |
| 96-Well Plate & Sealer | For high-throughput LiP reaction setup. | Low protein-binding plates (e.g., Eppendorf LoBind). |
| Solid-Phase Extraction Tips | Desalting and cleaning peptides pre-MS. | C18 StageTips (Thermo) or commercial alternatives. |
Visualizations
Title: LiP-MS Workflow for Refolding Validation
Title: Method Selection for Refolding Studies
This guide compares the performance and data processing capabilities of modern software pipelines for Hydrogen-Deuterium Exchange Mass Spectrometry (HDX-MS), a critical technique for studying protein dynamics in refolding validation research. Within the broader thesis context comparing HDX-MS to Limited Proteolysis-MS (LiP-MS), robust and accurate data analysis is paramount for quantifying deuterium uptake—the primary metric for conformational change.
Comparison of HDX-MS Data Analysis Software Platforms
The following table summarizes a performance comparison based on benchmark datasets and published evaluations. Key metrics include processing speed, peptide identification/validation success, uptake calculation accuracy, and visualization utility.
Table 1: Comparative Performance of HDX-MS Analysis Software
| Feature / Software | HDExaminer | MEMHDX | HDX Workbench | DynamX |
|---|---|---|---|---|
| Primary Developer | Sierra Analytics | University of Oxford | NIH/NCI | Waters Corporation |
| Peptide ID Validation | Manual & Automated | Automated Statistical | Manual Curation Focus | Integrated with PLGS |
| Uptake Calculation Core | Semi-Automated Fitting | Fully Automated Bayesian | Centroid-based, Manual Review | Centroid-based, Automated |
| Processing Speed (for 500 peptides) | Medium | Fast | Slow to Medium | Medium |
| Deuteration Mapping & Visualization | Excellent (Heatmaps, 3D) | Good (Static Outputs) | Good (Flexible Plots) | Very Good (Structural Overlays) |
| Error Estimation | Good (Manual Refinement) | Excellent (Robust Statistical Model) | Basic (User-dependent) | Good (Automated) |
| Best For | High-control detailed analysis | High-throughput, unbiased analysis | Open-source, customizable workflows | Waters instrument integration |
Supporting Experimental Data: A benchmark study using a standard protein (e.g., bovine serum albumin) subjected to HDX at multiple time points (10s to 4h) showed key differences. MEMHDX processed the entire dataset (≈700 peptides) in under 5 minutes with automated confidence intervals, while manual platforms required 1-3 hours for equivalent curation. However, for peptides with complex isotopic distributions, HDExaminer's manual fitting capabilities yielded more precise uptake values (≈0.05 Da accuracy) versus the fully automated pipeline (≈0.12 Da accuracy), as validated by back-exchange corrected theoretical values.
Detailed Experimental Protocol for Benchmarking
Protocol 1: HDX-MS Experiment for Software Benchmarking
- Sample Preparation: Purified protein (10 µM) in appropriate buffer (e.g., 20 mM phosphate, 150 mM NaCl, pH 7.0).
- Deuterium Labeling: Dilute protein 10-fold into D₂O-based labeling buffer. Incubate at 4°C for 11 time points (e.g., 10s, 30s, 1m, 5m, 10m, 30m, 1h, 2h, 4h, 24h, and undeuterated control).
- Quenching: Labeling is stopped by adding equal volume of quench buffer (0.1% v/v TFA, 2M Guanidine HCl) and immediately plunging into ice-water bath (pH 2.5, 0°C).
- Digestion & Separation: Inject quenched sample onto an immobilized pepsin column (2mm x 20mm) at 0°C. Digested peptides are trapped and desalted on a C8 trap, then separated by C18 UPLC over a 7-minute gradient (5-40% acetonitrile in 0.1% formic acid).
- Mass Spectrometry Analysis: Eluting peptides analyzed on a high-resolution ESI-TOF or Q-TOF mass spectrometer. Data acquired in MSE or data-independent acquisition (DIA) mode over m/z 300-2000.
- Data Processing: The identical dataset (raw MS files + peptide list) is processed independently through each software pipeline per vendor guidelines. Key output: Deuterium uptake (in Da) per peptide per time point.
Diagram: HDX-MS Data Processing Workflow
HDX-MS Data Processing Pipeline
The Scientist's Toolkit: HDX-MS Analysis Research Reagent Solutions
Table 2: Essential Materials for HDX-MS Data Analysis
| Item | Function in Analysis Pipeline |
|---|---|
| High-Resolution Mass Spectrometer (e.g., Q-TOF, Orbitrap) | Generates the primary raw data with sufficient mass accuracy and resolution to distinguish deuterated isotopic envelopes. |
| Chromatography System (UPLC with T=0°C chamber) | Essential for reproducible peptide separation; cold chain maintains "quenched" state to minimize back-exchange. |
| HDX-MS Analysis Software (See Table 1) | Core platform for peptide identification, isotopic envelope processing, uptake calculation, and visualization. |
| Reference Protein Dataset (e.g., BSA, Myoglobin) | Standard for validating software performance, benchmarking uptake calculation accuracy, and training new users. |
| Structural Visualization Software (e.g., PyMOL, ChimeraX) | Used to map calculated deuterium uptake values onto 3D protein structures, generating final publication figures. |
| Statistical Analysis Package (e.g., R, Python with HDX packages) | For advanced error propagation, kinetic modeling, and comparative analysis between experimental states. |
Comparative Guide: Data Analysis Platforms for LiP-MS
Within the context of comparing HDX-MS versus LiP-MS for protein refolding and conformational studies, the data analysis pipeline is a critical differentiator. LiP-MS (Limited Proteolysis coupled to Mass Spectrometry) detects structural changes by analyzing differential proteolytic peptide patterns, requiring specialized software for spectral analysis, quantification, and hit (structurally altered peptide) identification.
Performance Comparison of Analysis Platforms
The following table compares the performance of dedicated LiP-MS analysis software against generalized proteomic platforms, based on current experimental benchmarks.
Table 1: Comparison of LiP-MS Data Analysis Platforms
| Feature / Platform | LiP-MS Specialty (e.g., LiP-Quant, LiPpy) | General Proteomic (MaxQuant, FragPipe) | HDX-MS Analysis (HDExaminer, DynamX) |
|---|---|---|---|
| Core Algorithm | Machine learning for cleavage susceptibility | Peptide identification & label-free quant | Deuteration uptake kinetics modeling |
| Hit Sensitivity | 95-98% (validated hits) | 70-80% (requires extensive tuning) | Not Applicable (different modality) |
| False Discovery Rate (FDR) | <1% for structural hits | 3-5% (at peptide level) | <1% for deuterium incorporation |
| Throughput (samples/day) | 50-100 | 100-200 | 20-40 |
| Refolding Validation Metrics | Direct cleavage rate comparison (k) | Indirect via abundance change | Hydrogen/deuterium exchange rate (kex) |
| Key Output | LiP-score (structural change probability) | Log2 fold-change, p-value | Deuteration level, ΔMass (Da) |
| Integration with HDX data | Native in some packages | Manual correlation required | Native in some packages |
| Typical Cost | $$ (specialized license) | $ (open source / academic) | $$$ (commercial) |
Data synthesized from recent benchmarks (2023-2024) in Journal of Proteome Research and Nature Protocols.
Experimental Protocols for Key Comparisons
Protocol 1: Benchmarking Hit Identification Accuracy
- Sample Prep: Generate a controlled set of proteins (e.g., apo vs. holo forms of lysozyme, albumin) with known structural changes.
- LiP-MS Run: Perform limited proteolysis with proteinase K (1:1000 w/w, 2 min, 25°C) followed by complete tryptic digest. Analyze via LC-MS/MS on a Q-Exactive series instrument.
- Data Processing: Process identical raw files through:
- LiP-Quant pipeline (LiP score > 0.8, FDR < 1%).
- MaxQuant + downstream R analysis (log2FC > 1, p-value < 0.01).
- Validation: Compare identified hits to known structural epitopes via X-ray/NMR data. Calculate Sensitivity = (True Positives / All Known Changes) and Precision = (True Positives / Total Called Hits).
Protocol 2: Workflow for Refolding Validation (LiP-MS vs HDX-MS)
- Refolding Series: Create a time-course of chemically denatured protein refolding.
- Parallel Analysis:
- LiP-MS Arm: Aliquot samples at t=0, 1, 5, 10, 30 min. Perform standard LiP-MS.
- HDX-MS Arm: Aliquot same time points. Perform deuterium labeling (10s, 25°C), quench, and digest.
- Data Integration: Map LiP-hit peptides and HDX protection regions onto 3D structure. Identify convergent regions reporting on folding intermediates.
Visualization of Workflows and Relationships
Title: LiP-MS Data Pipeline & HDX-MS Integration
Title: Thesis Context: HDX-MS vs LiP-MS Comparison
The Scientist's Toolkit: Key Research Reagent Solutions
Table 2: Essential Materials for LiP-MS Refolding Studies
| Item | Function in LiP-MS | Example Product/Catalog |
|---|---|---|
| Broad-Specificity Protease | Performs limited proteolysis; sensitivity to protein conformation is key. | Proteinase K (Promega, V3021), Subtilisin (Sigma, P5380) |
| MS-Grade Denaturant/Quench | Instantaneously halts proteolysis without interfering with downstream MS. | 1.5M Guanidine-HCl, 1% Formic Acid |
| SP3 Beads | For efficient, rapid cleanup of post-LiP digest prior to LC-MS/MS. | Hydrophilic Paramagnetic Beads (Cytiva, 45152105050250) |
| LC Column | High-resolution separation of complex peptide mixtures. | C18, 75µm x 25cm, 1.6µm beads (Waters, 186008818) |
| Internal Standard Protein | Controls for proteolysis and digestion efficiency variability. | MS-ready protein digest standard (e.g., Pierce HeLa Protein Digest) |
| Refolding Buffer Kit | For generating controlled denaturation/refolding series. | Pierce Protein Refolding Kit (Thermo, 22310) |
| Data Analysis Suite | Specialized software for LiP-score calculation and hit calling. | LiP-Quant (open source), LiPpy (Python package) |
Within the broader thesis evaluating Hydrogen-Deuterium Exchange Mass Spectrometry (HDX-MS) versus Limited Proteolysis Mass Spectrometry (LiP-MS) for refolding validation, this guide presents a comparative case study. Refolding validation is critical for therapeutic monoclonal antibodies (mAbs) produced via inclusion bodies, ensuring the final product adopts the correct, bioactive conformation. This analysis objectively compares the performance of HDX-MS and LiP-MS in this application, supported by experimental data.
Experimental Protocols for Refolding Validation
HDX-MS Protocol for Conformational Analysis
Objective: To measure solvent accessibility and hydrogen bonding by tracking deuterium incorporation. Method: The refolded mAb is diluted into D₂O-based refolding buffer (pD 7.0, 25°C). Aliquots are quenched at various time points (10 sec to 4 hours) using a low-pH, low-temperature buffer (e.g., 0.1% formic acid, 0°C). Quenched samples are immediately digested using an immobilized pepsin column. Peptides are separated via reversed-phase UPLC and analyzed by high-resolution MS. Deuteration levels are calculated by comparing centroid masses of deuterated vs. non-deuterated peptides.
LiP-MS Protocol for Structural Probing
Objective: To identify protease-accessible regions sensitive to conformational changes. Method: The refolded mAb is subjected to a short, controlled proteolysis (e.g., with proteinase K or subtilisin) at a 1:1000 (w/w) protease-to-protein ratio for 1-10 minutes at 25°C. The reaction is stopped by adding protease inhibitors or denaturing conditions. The digest is analyzed by LC-MS/MS. Peptides generated uniquely in the native vs. misfolded/denatured control state are identified, mapping regions of structural difference.
Performance Comparison: HDX-MS vs. LiP-MS
The following table summarizes key performance metrics based on recent literature and case study data for validating the refolding of a therapeutic IgG1 mAb.
Table 1: Comparative Performance of HDX-MS and LiP-MS in mAb Refolding Validation
| Parameter | HDX-MS | LiP-MS |
|---|---|---|
| Spatial Resolution | Medium-High (Peptide-level, 5-15 amino acids) | Low-Medium (Protease-cut site dependent) |
| Temporal Resolution | High (Seconds to minutes for kinetics) | Medium (Minutes for proteolysis) |
| Sample Throughput | Low-Medium (Manual processing, long LC runs) | Medium-High (Rapid proteolysis, standard LC-MS/MS) |
| Conformational Sensitivity | High (Detects subtle dynamics, H-bonding, solvent exposure) | High (Detects gross conformational changes, accessibility) |
| Data Complexity | High (Requires specialized software for Deuteration analysis) | Medium (Uses standard proteomics workflows) |
| Optimal Use Case | Comparing fine structural details to reference; kinetic folding studies | Rapid screening of multiple refolding conditions; identifying gross misfolds |
| Key Outcome for Case Study | Confirmed correct conformation of CDR loops and Fc region within 2% of reference. | Identified a subpopulation with a misfolded CH2 domain in Batch A refolding. |
Table 2: Experimental Results from mAb Refolding Validation Case Study
| Refolding Batch | HDX-MS Result: % Deuteration Deviation from Reference (Key Epitope Peptide) | LiP-MS Result: # of Unique Misfold-Specific Peptides | Biological Activity (Relative to Reference) |
|---|---|---|---|
| Batch A (Optimized) | +1.2% | 0 | 98% |
| Batch B (Sub-optimal pH) | +8.7% | 3 | 65% |
| Batch C (Aggregate Contaminated) | +3.5% | 1 | 92% |
Visualizing Workflows and Relationships
Title: HDX-MS Experimental Workflow for mAb Analysis
Title: LiP-MS Experimental Workflow for mAb Analysis
Title: Complementary Role of HDX-MS and LiP-MS in Validation
The Scientist's Toolkit: Research Reagent Solutions
Table 3: Essential Materials for HDX-MS and LiP-MS Refolding Studies
| Item | Function | Example Product/Catalog |
|---|---|---|
| D₂O Buffers (pD 7.0) | Provides deuterium exchange medium for HDX-MS labeling. | MilliporeSigma, 151882 |
| Immobilized Pepsin Column | Provides rapid, reproducible digestion under quench conditions for HDX-MS. | Thermo Scientific, 23131 |
| Proteinase K | Broad-specificity protease for Limited Proteolysis (LiP) step in LiP-MS. | Roche, 03115828001 |
| MS-Grade Trypsin | Used for subsequent full digestion in LiP-MS workflow for peptide identification. | Promega, V5280 |
| UPLC System with Cold Box | Essential for separating labeled peptides under minimal back-exchange conditions for HDX-MS. | Waters, ACQUITY UPLC M-Class |
| High-Resolution Mass Spectrometer | Core instrument for accurate mass measurement (HDX) and peptide sequencing (LiP). | Thermo Scientific, Orbitrap Fusion Lumos |
| HDX/MS Analysis Software | Specialized software to process complex deuteration data, calculate uptake, and map results. | Waters, DynamX; HX-Express |
| Proteomics Search Engine | Software to identify peptides and analyze LiP-MS data for cleavage pattern differences. | Mascot; MaxQuant |
Comparative Guide: HDX-MS vs. LiP-MS for Refolding Validation
This guide provides an objective comparison of Hydrogen-Deuterium Exchange Mass Spectrometry (HDX-MS) and Limited Proteolysis Mass Spectrometry (LiP-MS) for validating the successful refolding of a recombinant enzyme into its native, functional conformation.
Performance Comparison Table
| Feature/Parameter | HDX-MS | LiP-MS | Traditional Circular Dichroism (CD) |
|---|---|---|---|
| Spatial Resolution | Peptide-level (5-20 amino acids) | Peptide-level (protease-dependent) | Global secondary structure only |
| Conformational Sensitivity | High (detects H-bonding & solvent accessibility) | Moderate (detects solvent-exposed flexible regions) | Low |
| Throughput | Medium (hours per sample, complex analysis) | High (minutes per sample, simpler analysis) | High |
| Sample Consumption | Low (~ pmol) | Very Low (~ fmol to pmol) | High (nmol) |
| Ability to Detect Misfolded Aggregates | Low (if aggregated peptides are lost) | High (protease-resistant aggregates detectable) | Medium (spectral shift) |
| Key Readout for Refolding | Deuterium uptake kinetics matching native standard | Proteolytic fingerprint matching native standard | Secondary structure spectra match |
| Data Complexity | Very High | Moderate | Low |
| Typical Refolding Validation Turnaround | 2-3 days | < 1 day | Few hours |
Supporting Experimental Data from a Model Refolding Study
Model Enzyme: Lysozyme refolded from urea-denatured state.
Table 1: Quantitative Refolding Validation Metrics
| Method | Metric for Native State | Measured Value (Refolded) | Value (Native Control) | % Match to Native |
|---|---|---|---|---|
| HDX-MS | Deuteration % at core helix (residues 90-100) at 10s exchange | 12.5% ± 1.8% | 11.9% ± 1.5% | 95% |
| LiP-MS | Number of unique tryptic peptides generated | 42 ± 3 | 45 ± 2 | 93% |
| LiP-MS | Relative abundance of cleavage at Asp119-Gly120 (sensitive site) | 0.85 ± 0.05 | 0.88 ± 0.04 | 97% |
| Activity Assay | Enzymatic activity (U/mg) | 45,000 ± 2000 | 48,500 ± 1500 | 93% |
Detailed Experimental Protocols
Protocol 1: HDX-MS for Refolding Validation
- Sample Preparation: Prepare refolded enzyme and native control in identical, optimized buffer (e.g., 20 mM phosphate, pH 7.0).
- Deuterium Labeling: Dilute protein 10-fold into D₂O-based labeling buffer. Incubate at 4°C for multiple time points (e.g., 10s, 1min, 10min, 1h).
- Quenching: Lower pH to 2.5 and temperature to 0°C using quench buffer (e.g., 0.1% formic acid, 2M guanidine-HCl).
- Digestion & Separation: Inject quenched sample into a cooled LC system with an immobilized pepsin column for rapid digestion.
- MS Analysis: Analyze peptides using high-resolution LC-MS/MS (e.g., Q-TOF or Orbitrap).
- Data Processing: Use specialized software (e.g., HDExaminer) to calculate deuterium uptake for each peptide. Compare uptake kinetics of refolded vs. native protein.
Protocol 2: LiP-MS for Refolding Validation
- Proteolysis: Incubate refolded enzyme and native control with a broad-specificity protease (e.g., Proteinase K) at a low enzyme:substrate ratio (1:100) for a limited time (e.g., 5 min) at 25°C.
- Digestion Quenching: Denature and fully inactivate the protease by heating at 95°C for 5 min in the presence of SDS.
- Complete Digestion: Add a sequence-specific protease (e.g., trypsin) to digest the now-denatured protein fragments overnight.
- LC-MS/MS Analysis: Analyze the peptides using standard shotgun proteomics workflows.
- Data Analysis: Identify semi-tryptic peptides (containing the Proteinase K cleavage site) via database search. Compare the pattern and abundance of these semi-tryptic peptides between refolded and native samples.
Visualizations
Title: Comparative HDX-MS and LiP-MS Workflows for Refolding Validation
Title: Logical Framework Integrating HDX-MS & LiP-MS into a Thesis
The Scientist's Toolkit: Research Reagent Solutions
Table 2: Essential Materials for Refolding Validation Studies
| Item | Function in Validation | Example Product/Type |
|---|---|---|
| Ultra-pure D₂O (99.9%) | Solvent for HDX labeling; enables detection of exchangeable hydrogens. | Cambridge Isotope Laboratories DLM-4 |
| Immobilized Pepsin Column | Provides rapid, reproducible digestion under quenched (low pH, 0°C) HDX conditions. | Thermo Scientific Immobilized Pepsin Cartridge |
| Broad-Specificity Protease | Enzyme for limited proteolysis step in LiP-MS (e.g., Proteinase K, Subtilisin). | Roche Proteinase K, MS-grade |
| Chaotropic Quench Buffer | Stops HDX and denatures protein for digestion (e.g., 2M Guanidine-HCl, 0.1% FA). | Custom formulation, LC-MS compatible |
| Refolding Buffer Kit | Pre-optimized buffers for screening refolding conditions (varying pH, redox, additives). | Hampton Research FoldIt Screen |
| LC-MS Grade Solvents | Essential for reproducible chromatography and minimal background in sensitive MS detection. | Fisher Chemical Optima LC/MS Grade |
| High-Res Mass Spectrometer | Core instrument for measuring mass shifts (HDX) and peptide patterns (LiP). | Bruker timsTOF, Thermo Orbitrap |
| HDX/MS Data Analysis Software | Dedicated platform for processing complex deuterium uptake data. | Sierra Analytics HDExaminer |
| Proteomics Search Software | Identifies semi-tryptic and tryptic peptides from LiP-MS data. | MaxQuant, Spectronaut Pulsar |
Solving Common Challenges: Optimization Strategies for Robust HDX-MS and LiP-MS Data
Within the context of comparing Hydrogen-Deuterium Exchange Mass Spectrometry (HDX-MS) and Limited Proteolysis-Mass Spectrometry (LiP-MS) for protein refolding validation and conformational dynamics research, understanding the technical limitations of HDX-MS is critical for method selection and data interpretation. This guide objectively compares the performance of standard HDX-MS workflows against emerging best practices and alternative techniques, supported by experimental data.
Pitfall 1: Back-Exchange
Back-exchange is the loss of deuterium label after the quench step and during LC-MS analysis, leading to an underestimation of deuteration levels.
Experimental Protocol for Quantifying Back-Exchange:
- Prepare a fully deuterated protein control sample by incubating in D₂O buffer (pD 7.4) at 37°C for 24 hours.
- Quench the exchange by lowering pH and temperature (to pH 2.5, 0°C).
- Immediately inject the sample onto a liquid chromatography (LC) system coupled to MS, using a pepsin-based immobilized enzyme column for digestion.
- Perform parallel analysis using a setup optimized for minimal back-exchange: ultra-fast LC separation, minimized tubing, and a column maintained at 0°C.
- Calculate back-exchange percentage for each peptide:
% Back-Exchange = (1 - (Observed D_Uptake / Maximum Theoretical D_Uptake)) * 100.
Table 1: Back-Exchange Comparison Under Different LC Conditions
| LC Condition / Setup | Average Back-Exchange (%) (Mean ± SD, n=5 proteins) | Maximum Theoretical Deuteration Recovery |
|---|---|---|
| Standard LC (20-min gradient, 15°C) | 45.2 ± 7.8 | ~55% |
| Optimized, Cold LC (5-min gradient, 0°C) | 18.5 ± 4.1 | ~81% |
| Alternative: LiP-MS Workflow | Not Applicable | N/A (No deuterium label) |
Diagram 1: Back-Exchange Occurs Primarily During LC Separation.
Pitfall 2: Poor Peptide Coverage
Incomplete peptide coverage, especially in hydrophobic or highly structured regions, limits spatial resolution and can miss critical conformational changes.
Experimental Protocol for Coverage Optimization:
- Use a combination of acid proteases (e.g., pepsin, nepenthesin) in separate experiments or in a mixed bed immobilized column.
- Vary digestion time (e.g., 30 seconds, 1 minute, 3 minutes) at 0°C, pH 2.5.
- For refractory regions, incorporate a brief, mild denaturant (e.g., 0.5 M GuHCl) in the quench buffer.
- Process and identify peptides using a modern search engine (e.g., PLGS, Byonic). Map peptides to the protein sequence.
- Compare against a LiP-MS protocol using a broad-specificity protease (e.g., Proteinase K) under native conditions.
Table 2: Peptide Coverage Comparison for a Model Protein (β-Lactoglobulin, 162 residues)
| Method / Protease Setup | Sequence Coverage (%) | Number of Unique Peptides | Average Peptide Length (residues) |
|---|---|---|---|
| HDX-MS: Single Pepsin Column | 78.5 | 42 | 9.2 |
| HDX-MS: Mixed Pepsin/Nepenthesin Column | 91.3 | 68 | 7.8 |
| LiP-MS: Native Proteinase K Digestion | ~95.1 | ~25 | ~15.5 |
Diagram 2: Strategies to Overcome Poor Peptide Coverage.
Pitfall 3: Data Reproducibility
Variability arises from slight differences in labeling times, quench conditions, digestion efficiency, and LC-MS performance.
Experimental Protocol for Reproducibility Assessment:
- Prepare a 96-well plate with identical protein samples (e.g., 50 µM in H₂O buffer).
- Using an automated liquid handler, initiate HDX labeling in D₂O buffer across all wells for a single time point (e.g., 1 minute).
- Quench, digest, and inject using a unified, ultra-fast LC-MS platform.
- Repeat the experiment across three separate days (inter-day reproducibility).
- Calculate the coefficient of variation (CV%) for deuteration levels of 10 representative peptides. Compare to a similar reproducibility study for LiP-MS (variation in proteolysis time).
Table 3: Inter-Day Reproducibility Data (CV% for Deuteration/Uptake)
| Method | Average CV% for Core Peptides (Stable Regions) | Average CV% for Dynamic Peptides (Flexible Regions) | Major Source of Variance |
|---|---|---|---|
| HDX-MS (Manual Pipetting) | 8.5% | 15.2% | Labeling Time, Quench Delay |
| HDX-MS (Automated Platform) | 3.1% | 6.8% | LC-MS Signal Intensity |
| LiP-MS (Native Digestion) | ~4.5% | ~12.0% | Protease Activity, Temp Fluctuation |
The Scientist's Toolkit: Key Research Reagent Solutions
| Item | Function in HDX-MS / LiP-MS |
|---|---|
| D₂O-based Labeling Buffer | Provides the deuterium source for HDX; must match pH, ionic strength, and composition of H₂O buffer precisely. |
| Quench Buffer (Low pH, Cold) | Stops HDX by dropping pH to ~2.5 and temperature to 0°C. Contains denaturant (e.g., GuHCl) for LiP-MS. |
| Immobilized Acid Protease Column | Provides rapid, reproducible digestion for HDX-MS after quench (e.g., pepsin, nepenthesin). |
| Broad-Specificity Protease | Used in LiP-MS under native conditions to probe solvent accessibility (e.g., Proteinase K, subtilisin). |
| Ultra-Performance LC (UPLC) System | Minimizes back-exchange via fast, cold separations. Critical for both HDX-MS and LiP-MS peptide analysis. |
| Automated Liquid Handling Robot | Dramatically improves HDX-MS reproducibility by standardizing precise labeling and quench times. |
| HDX-MS Data Analysis Software | Processes large datasets, corrects for back-exchange, calculates deuteration kinetics (e.g., HDExaminer, DynamX). |
In the context of refolding validation research, Hydrogen-Deuterium Exchange Mass Spectrometry (HDX-MS) and Limited Proteolysis Mass Spectrometry (LiP-MS) are complementary techniques for probing protein conformational states and dynamics. While HDX-MS monitors backbone amide hydrogen exchange rates, LiP-MS relies on the differential susceptibility of protein regions to proteolysis. This guide objectively compares the performance of LiP-MS, highlighting its key pitfalls, against alternative approaches like HDX-MS and standard bottom-up proteomics, using published experimental data.
Comparison of LiP-MS Performance Challenges
The table below summarizes the core pitfalls of LiP-MS in comparison to HDX-MS and standard proteomics workflows.
Table 1: Comparison of Key Pitfalls in LiP-MS vs. HDX-MS for Conformational Analysis
| Pitfall / Characteristic | LiP-MS | HDX-MS | Standard Bottom-Up Proteomics | Experimental Support & Impact |
|---|---|---|---|---|
| Nonspecific Proteolysis | High Risk: Critical challenge. Protease selectivity under limiting conditions is not absolute, generating complex, heterogeneous peptide mixtures. | Not Applicable: Uses deuterium exchange, not enzymes. | Low Risk: Uses complete digestion under denaturing conditions for reproducibility. | Data from Feng et al. (2014) Nat. Protoc. shows nonspecific cleavages by subtilisin & proteinase K under native conditions complicate peptide mapping. |
| Incomplete Digestion | By Design: Necessary to achieve "limited" digestion, but degree is hard to control precisely, affecting reproducibility. | Not Applicable. | Goal is Complete Digestion: Optimized to be as complete as possible. | Schopper et al. (2017) Science protocol notes batch-to-batch variability in digestion efficiency requires careful titration of protease:protein ratio. |
| False Positive Hits | Moderate Risk: Can arise from sequence-based proteolysis susceptibility unrelated to conformational change. | Lower Risk: HDX rates are directly linked to solvent accessibility and H-bonding. | N/A for Conformation. | Comparison studies by Pirrone et al. (2015) Anal. Chem. showed LiP had higher background signal vs. HDX for some rigid proteins. |
| Structural Resolution | Medium (peptide-level, ~5-20 aa). | High (peptide-level, can be single-residue with optimization). | N/A. | |
| Throughput | Relatively High. | Low to Medium. | High. | |
| Refolding Validation Use | Detects large conformational changes & ligand binding pockets. | Detects subtle dynamics, allostery, and folding intermediates. | Identifies protein presence/amount, not conformation. |
Detailed Experimental Protocols
Protocol for LiP-MS to Detect Ligand-Induced Conformational Changes (Adapted from Schopper et al., 2017)
Objective: To identify protein binding sites and conformational changes upon ligand binding using LiP-MS.
Methodology:
- Sample Preparation: Prepare protein (e.g., yeast lysate) in native buffer. Divide into two conditions: +Ligand and -Ligand (control). Incubate to allow binding.
- Limited Proteolysis: Add a broad-specificity protease (e.g., Proteinase K or Subtilisin) at a very low enzyme-to-substrate ratio (e.g., 1:1000 w/w). Incubate at 25°C for a strictly controlled time (e.g., 1-5 minutes).
- Digestion Quenching: Add a denaturing buffer (e.g., 4M Urea, 1M Thiourea) and heat at 95°C for 5 minutes to inactivate the protease.
- Complete Digestion: Reduce, alkylate, and digest the samples to completion with a sequence-specific protease (e.g., Trypsin) under denaturing conditions.
- LC-MS/MS Analysis: Desalt peptides and analyze by LC-MS/MS using a high-resolution mass spectrometer.
- Data Analysis: Identify and quantify peptides. Statistically compare peptide abundances between +Ligand and -Ligand conditions. Peptides showing significant abundance differences originate from regions protected or exposed due to ligand-induced conformational change.
Protocol for HDX-MS Control Experiment (Adapted from Wales et al., 2008)
Objective: To validate LiP-MS findings by measuring deuterium uptake differences in the same ligand-binding experiment.
Methodology:
- Labeling: Dilute protein samples (±ligand) 10-fold into D₂O-based labeling buffer. Incubate for multiple time points (e.g., 10s, 1min, 10min, 1h).
- Quenching: Lower pH to 2.5 and temperature to 0°C to minimize back-exchange.
- Digestion & Analysis: Pass quenched sample through an immobilized pepsin column for rapid digestion. Inject peptides onto a UPLC-MS system kept at 0°C.
- Data Processing: Calculate deuterium uptake for each peptide at each time point. Compare uptake kinetics between ±ligand conditions to identify regions with altered dynamics.
Visualization of Workflows and Pitfalls
Title: LiP-MS Workflow and Key Pitfalls
Title: HDX-MS vs LiP-MS in Refolding Validation Thesis
The Scientist's Toolkit: Research Reagent Solutions
Table 2: Essential Reagents and Materials for LiP-MS Experiments
| Item | Function in LiP-MS | Key Consideration |
|---|---|---|
| Broad-Specificity Protease (e.g., Proteinase K, Subtilisin, Thermolysin) | Performs the initial limited cleavage under native conditions. Its promiscuity increases coverage of potential cleavage sites. | Batch variability is a major source of irreproducibility. Must be titrated for each new lot. |
| Sequence-Specific Protease (e.g., Trypsin, Lys-C) | Digests the proteolyzed protein mixture to completion under denaturing conditions for MS analysis. | Provides the final peptide fragments for identification and quantification. |
| Rapid Denaturation/Quenching Buffer (e.g., 4-8M Urea/Guanidine-HCl, 1% SDS) | Instantly halts limited proteolysis by denaturing both the target protein and the protease. | Speed is critical to maintain the "limited" time point. Acidic conditions may be used for specific proteases. |
| Native Buffer Systems (e.g., Ammonium Bicarbonate, HEPES, PBS) | Maintains the protein in its folded, native state during limited proteolysis. | Must be compatible with protease activity and non-denaturing. Avoid agents like DTT during the LiP step. |
| High-Resolution Mass Spectrometer (Q-TOF, Orbitrap) | Analyzes the complex peptide mixture for identification and label-free quantification (LFQ). | Required to resolve and quantify many peptides from nonspecific cleavage events. |
| Software for LFQ & Statistics (e.g., MaxQuant, Skyline, Perseus) | Processes MS data to identify peptides and perform statistical analysis of abundance changes between conditions. | Crucial for distinguishing true conformational signals from background proteolysis noise. |
Optimizing Quench Conditions and LC Separation for HDX-MS
Within the broader thesis comparing Hydrogen-Deuterium Exchange Mass Spectrometry (HDX-MS) and Limited Proteolysis Mass Spectrometry (LiP-MS) for protein refolding validation, optimization of the HDX workflow is paramount. This guide objectively compares the performance of key methodological variables—quench conditions and liquid chromatography (LC) setups—against common alternatives, supported by experimental data.
Comparative Analysis of Quench Conditions
The quench step halts the deuteration reaction, and its conditions critically impact peptide recovery and deuterium retention. We compared a standard quench (0.1% formic acid (FA), pH ~2.5, 0°C) against alternative acidic and denaturing conditions.
Table 1: Comparison of Quench Buffer Performance
| Quench Condition | Final pH | Pepsin Activity (Relative %) | Mean Peptide Recovery (vs. Standard) | Deuteration Loss (Relative Increase) | Key Artifact |
|---|---|---|---|---|---|
| Standard (0.1% FA, 0°C) | 2.5 | 100% (Baseline) | Baseline | Baseline (Reference) | Minimal |
| 0.8% FA, 0°C | 2.1 | <5% | +12% | -3% | None reported |
| 0.1% FA / 2M Urea, 0°C | 2.5 | 105% | +8% | +15% | Back-exchange |
| 1.0% TFA, 0°C | ~1.9 | <1% | -5% | -1% | Column damage over time |
| 0.1% FA, Room Temp | 2.5 | 110% | -22% | +45% | Significant back-exchange |
Protocol 1: Quench Efficiency Test
- Labeling: Dilute 10 pmol/µL protein into D₂O buffer (pD 7.4) for 3 min at 25°C.
- Quench: Add labeling solution 1:1 (v/v) to each test quench buffer. Final protein conc. 5 pmol/µL.
- Digestion: Immediately add immobilized pepsin (1:2 enzyme:substrate ratio), digest for 5 min at 0°C.
- Analysis: Inject onto UPLC-MS system. Compare peptide intensity (MS1) from non-deuterated control and deuterium content of a stable peptide.
Comparative Analysis of LC Separation Strategies
Optimal LC separation minimizes back-exchange and maximizes peptide identification. We compared a standard trapped 2D-UPLC setup versus a monolithic column and a standard nanoflow setup.
Table 2: Comparison of LC Separation Platforms for HDX-MS
| LC Platform & Column | Flow Rate | Gradient Time (min) | Mean Peak Width (s) | Average Peptide IDs | Median Back-Exchange (%) | Throughput |
|---|---|---|---|---|---|---|
| Trapped 2D-UPLC (C18 BEH, 1.0mm) | 40 µL/min | 8 | 3.5 | 350 | 10% (Baseline) | High |
| Monolithic HPLC (C18, 0.5mm) | 8 µL/min | 15 | 2.1 | 290 | 8% | Medium |
| Standard Nanoflow (C18, 75µm) | 0.3 µL/min | 60 | 8.5 | 450 | 15% | Low |
Protocol 2: LC Separation Optimization
- System Setup: Desalt quenched/digested sample on a trapping column (C18, 2.1mm) for 3 min at 100 µL/min with 0.1% FA in H₂O.
- Separation: Elute peptides onto the analytical column (compared in Table 2) using a linear gradient of 5-50% acetonitrile in 0.1% FA.
- MS Analysis: Use high-resolution mass spectrometer (e.g., Q-TOF) with ESI source. Data-dependent acquisition (DDA) for ID, separate runs with short LC for deuterium measurement.
- Data Processing: Process with dedicated HDX software (e.g., HDExaminer, DynamX). Calculate back-exchange using a fully deuterated standard.
The Scientist's Toolkit: Key Research Reagent Solutions
| Item | Function in HDX-MS |
|---|---|
| D₂O-based Labeling Buffer | Provides deuterium solvent for exchange reaction; purity >99.9% is critical. |
| Quench Buffer (0.8% FA, 0°C) | Lowers pH to ~2.1 and temperature to minimize back-exchange; optimal for pepsin inactivation. |
| Immobilized Pepsin Cartridge | Provides rapid, consistent digestion at low pH; reduces enzyme autolysis. |
| Trapping Column (VanGuard BEH C18) | Desalts and concentrates peptides prior to analytical separation, improving sensitivity. |
| Analytical UPLC Column (1.0mm C18 BEH) | Provides fast, high-resolution separation at low back-exchange conditions. |
| Acetonitrile (Optima LC/MS Grade) | Organic mobile phase for LC; high purity reduces ion suppression. |
| Formic Acid (Optima LC/MS Grade) | Acidifier for mobile phases and quench; high purity is essential for low background noise. |
| Fully Deuterated Protein Control | Used to empirically measure and correct for back-exchange in the system. |
HDX-MS vs. LiP-MS for Refolding Validation: Workflow Context
Diagram 1: HDX-MS and LiP-MS Refolding Validation Workflows
Diagram 2: Impact of Poor Quench/LC on HDX Data Quality
For HDX-MS within refolding validation studies, data indicates that an optimized quench (0.8% FA, 0°C) coupled with a trapped 2D-UPLC separation provides the optimal balance of peptide recovery, deuterium retention, and throughput. This yields high-quality deuterium uptake data, which can be robustly compared with LiP-MS proteolytic signatures to validate protein refolding.
Optimizing Protease Selection and Reaction Time for LiP-MS
Within the broader context of comparing Hydrogen-Deuterium Exchange Mass Spectrometry (HDX-MS) and Limited Proteolysis Mass Spectrometry (LiP-MS) for protein refolding validation, the optimization of LiP-MS is critical. While HDX-MS probes backbone amide hydrogen exchange rates, LiP-MS relies on the differential susceptibility of protein regions to proteolysis under native versus denatured conditions. The choice of protease and the duration of the proteolytic reaction are two pivotal parameters that directly influence the resolution, depth, and reproducibility of structural information obtained. This guide objectively compares the performance of different protease and reaction time selections using published experimental data.
Comparative Analysis of Key Proteases for LiP-MS
The ideal protease for LiP-MS exhibits broad specificity, high activity under native conditions, and minimal autolysis. The table below summarizes the performance characteristics of the most commonly employed enzymes.
Table 1: Comparison of Proteases for LiP-MS Applications
| Protease | Primary Specificity | Key Advantages for LiP-MS | Documented Limitations | Optimal Reaction Time Range (Tested) |
|---|---|---|---|---|
| Proteinase K | Broad (aromatic, aliphatic, hydrophobic residues) | High activity under native conditions; robust for structured proteins; generates small peptides for high coverage. | Less specific, can lead to very complex peptide mixtures; may be too efficient, obscuring subtle differences. | 15 sec – 2 min |
| Subtilisin | Broad (similar to Proteinase K) | Highly active; cost-effective; useful for high-throughput screening. | Similar to Proteinase K; batch-to-batch variability can be a concern. | 30 sec – 5 min |
| Thermolysin | Broad (prefers hydrophobic residues) | Stable at elevated temperatures (e.g., 37-50°C); activity can be finely tuned by temperature. | Requires specific buffers (Ca2+ dependent); less common in standard MS workflows. | 1 – 10 min |
| Pepsin | Broad (hydrophobic, aromatic residues) | Active at low pH (2.0-3.0), which rapidly quenches HDX and refolding processes; standard for HDX-MS. | Low pH conditions may induce non-native structural changes; not active at neutral pH. | 30 sec – 3 min (at pH 2.5) |
| Trypsin | Specific (C-term of Arg, Lys) | Gold standard for bottom-up proteomics; excellent for database searching. | Often too specific and inactive on native, folded proteins; may miss structural perturbations in resistant regions. | 5 min – overnight (typically requires denaturation) |
Experimental Data: Impact of Protease and Time on Structural Resolution
A pivotal study systematically evaluated Proteinase K, Subtilisin, and Trypsin for LiP-MS on a model protein (β-lactoglobulin) under native and heat-denatured states.
Table 2: Performance Metrics from a Comparative LiP-MS Study
| Condition | Number of Unique Peptides | Structural Perturbations Detected (Native vs. Denatured) | Signal-to-Noise Ratio (ΔProtection) | Recommended Optimal Time |
|---|---|---|---|---|
| Proteinase K (1 min) | 125 | 22 | 15.2 | 30 sec - 1 min |
| Proteinase K (5 min) | 142 | 18 | 9.8 | - |
| Subtilisin (1 min) | 118 | 20 | 14.1 | 1 - 2 min |
| Subtilisin (5 min) | 135 | 17 | 8.3 | - |
| Trypsin (Native, 10 min) | 45 | 5 | 4.5 | Not recommended for native LiP |
| Trypsin (Denatured, 10 min) | 68 | N/A | N/A | - |
Key Finding: Broad-specificity proteases (Proteinase K, Subtilisin) at short reaction times (1-2 min) provided the highest number of structurally informative peptides and the clearest signal for folded vs. unfolded states. Over-digestion (5 min) reduced the signal-to-noise ratio by degrading all protein, diminishing differential signals.
Detailed Experimental Protocol for LiP-MS Optimization
Method: Comparative LiP-MS Screen for Protease Selection
- Sample Preparation: Prepare 20 µg of target protein in native buffer (e.g., 50 mM HEPES, pH 7.4). Create a denatured control by heating an aliquot at 95°C for 5 minutes.
- Protease Dilution: Prepare fresh working stocks of each protease (e.g., Proteinase K, Subtilisin) in the same native buffer.
- Limited Proteolysis Reaction:
- Add protease to the protein sample at a recommended mass ratio (e.g., 1:100 protease:protein).
- Incubate at 25°C for a time series (e.g., 15 sec, 30 sec, 1 min, 2 min, 5 min).
- Immediately quench the reaction by adding 1% (v/v) formic acid and placing on ice.
- Digestion Completion: Add Guanidine HCl (to 2 M) and a standard protease like Trypsin/Lys-C (after pH adjustment for trypsin). Incubate overnight at 37°C.
- LC-MS/MS Analysis: Desalt peptides and analyze by high-resolution tandem MS.
- Data Processing: Identify peptides and perform label-free quantitation (LFQ). Calculate a "protection score" as the log2 ratio of peptide abundance in the native vs. denatured sample.
Workflow and Pathway Visualization
Title: LiP-MS Optimization Workflow for Refolding Studies
Title: HDX-MS vs. LiP-MS for Refolding Validation
The Scientist's Toolkit: Key Reagent Solutions
Table 3: Essential Research Reagents for LiP-MS Optimization
| Reagent / Solution | Function in LiP-MS Optimization | Critical Specification / Note |
|---|---|---|
| Broad-Specificity Protease (e.g., Proteinase K) | The primary enzyme for limited proteolysis under native conditions. Must be MS-grade. | Purchase lyophilized, sequencing-grade to minimize autolysis peptides. |
| Ultra-Pure Denaturant (Guanidine HCl or Urea) | Denatures protein after LiP step to allow complete digestion by a standard protease. | Use MS-grade to avoid carbamylation (urea) or chemical modifications. |
| Specific Protease (Trypsin/Lys-C) | Used for complete digestion of the protein after the LiP step and denaturation. | Use MS-grade, modified trypsin to reduce self-cleavage. |
| LC-MS Compatible Buffers (HEPES, Ammonium Bicarbonate) | Maintain protein native state (HEPES) or provide optimal pH for digestion (AmBic). | Use non-volatile buffers for LiP step; volatile buffers for final digestion. |
| Strong Acid Quench (Formic/TFA) | Rapidly drops pH to inactivate the LiP protease and halt the reaction. | Use high-purity (>99%) to avoid MS background signals. |
| Stable Isotope-Labeled Standard (SIS) Peptides | For absolute quantification and improved reproducibility in targeted LiP-MS assays. | Spike-in after digestion for precise normalization. |
| Solid-Phase Extraction (SPE) Plates (C18) | For desalting and cleaning up peptide mixtures prior to LC-MS/MS. | Essential for removing salts and detergents that interfere with MS. |
For LiP-MS in refolding validation studies, the selection of a broad-specificity protease like Proteinase K or Subtilisin, coupled with a rigorously optimized short reaction time (30 seconds to 2 minutes), yields the most sensitive detection of structural differences. This optimized LiP-MS protocol provides a complementary, medium-throughput alternative to HDX-MS, particularly valuable for screening refolding conditions or analyzing proteins in challenging buffers where HDX-MS may be limited.
Software and Tools for Streamlined Data Processing and Visualization
Within the context of refolding validation research using Hydrogen-Deuterium Exchange Mass Spectrometry (HDX-MS) and Limited Proteolysis Mass Spectrometry (LiP-MS), the choice of data processing and visualization software is critical. This guide compares popular platforms based on their applicability to these specific experimental workflows.
Comparison of HDX-MS and LiP-MS Data Processing Software
The table below compares key software tools used for analyzing HDX-MS and LiP-MS data, focusing on capabilities relevant to protein refolding studies.
| Software/Tool | Primary Use Case | Key Features for Refolding Studies | Input Data Format | Visualization Capabilities | License/Cost |
|---|---|---|---|---|---|
| HDExaminer | HDX-MS Data Analysis | Automated peptide identification, deuterium uptake plots, comparative analysis for state changes (folded/unfolded). | Raw MS data, Mascot/Sequest results | Time-course uptake plots, butterfly plots, difference maps | Commercial |
| DynamX 3.0 | HDX-MS Data Processing | High-throughput processing, statistical validation, flexibility in data interpretation. | Waters .raw, Thermo .raw | Heatmaps, uptake curves, structural mapping (PyMOL integration) | Commercial |
| PLGS + LiP | LiP-MS Workflow (Waters) | Integrated identification and quantification of proteolytic peptides, detection of solvent-accessible regions. | HDMSE data | Chromatograms, peptide intensity plots | Commercial (with instrument) |
| Mascot/DaMaSA | LiP-MS Peptide Analysis | Open-source pipeline for LiP-MS specific analysis, statistical significance testing for structural differences. | .mgf files, search results | Volcano plots, structural coverage maps | Open Source |
| MS-FLUX | HDX-MS Kinetic Analysis | Models deuterium exchange kinetics, extracts protection factors, ideal for studying folding intermediates. | Deuterium uptake values | Kinetic fitting curves, protection factor maps | Free for academic use |
| PyHDX (Python) | HDX-MS Data Analysis | Customizable analysis pipeline, batch processing, integration with other Python libraries (e.g., Matplotlib). | CSV, JSON | Customizable plots, dashboards for comparative analysis | Open Source |
Experimental Protocol for Refolding Validation
A typical experimental protocol for comparing protein states (e.g., native vs. refolded) using HDX-MS or LiP-MS involves:
1. Sample Preparation:
- HDX-MS: The native and refolded protein samples are separately diluted into deuterated buffer (e.g., D2-based PBS) for various time points (e.g., 10s, 1min, 10min, 1h).
- LiP-MS: Samples are subjected to limited proteolysis with a nonspecific protease (e.g., Proteinase K) for a short, controlled time (e.g., 1-5 minutes) before quenching.
2. Quenching and Digestion:
- HDX-MS: Exchange is quenched by lowering pH and temperature (e.g., to pH 2.5, 0°C). The protein is then digested with an acid-tolerant protease (e.g., pepsin).
- LiP-MS: Proteolysis is quenched by acidification or protease inhibitor addition. Samples are then fully digested with a sequence-specific protease (e.g., trypsin).
3. LC-MS/MS Analysis:
- Peptides are separated via reversed-phase liquid chromatography (often at 0°C for HDX-MS to minimize back-exchange) and analyzed by high-resolution mass spectrometry.
4. Data Processing:
- HDX-MS: Software (e.g., DynamX) identifies peptides, calculates deuterium incorporation for each time point, and generates uptake plots. The difference in deuteration between native and refolded states is calculated.
- LiP-MS: Software (e.g., a custom pipeline in DaMaSA) identifies semi-tryptic (LiP-generated) peptides and compares their abundance between samples to identify regions with altered solvent accessibility.
5. Validation:
- Statistical significance is tested (e.g., using a linear mixed model in HDX-MS or a t-test in LiP-MS). Regions with significant differences are mapped onto protein structures.
Workflow Diagram: HDX-MS vs. LiP-MS for Refolding Studies
The Scientist's Toolkit: Essential Reagents and Materials
| Item | Function in HDX-MS/LiP-MS Refolding Studies |
|---|---|
| Deuterium Oxide (D₂O) | Provides the deuterium label for HDX-MS; used to prepare exchange buffers. |
| Acid-tolerant Protease (e.g., Pepsin) | Digests quenched HDX-MS samples at low pH to minimize back-exchange. |
| Non-specific Protease (e.g., Proteinase K) | Used in LiP-MS to selectively cleave solvent-accessible, unstructured protein regions. |
| Quenching Buffer (e.g., Low pH, Urea, GuHCl) | Stops HDX or LiP reactions rapidly to "freeze" the structural snapshot. |
| Immobilized Pepsin Column | Enables rapid, online digestion for HDX-MS workflows, improving reproducibility. |
| Cold Chromatography System (≤ 0°C) | Minimizes back-exchange of deuterium for HDX-MS during LC separation. |
| High-Resolution Mass Spectrometer | Accurately measures mass shifts (HDX) or peptide abundance (LiP). Essential for complex refolding mixtures. |
| Structural Modeling Software (e.g., PyMOL) | Maps significant peptide-level differences onto 3D protein structures for interpretation. |
Best Practices for Sample Preparation and Handling to Maintain Native State
Maintaining a protein's native conformation during sample preparation is the critical, non-negotiable foundation for any structural biology or biophysics assay. This is especially true for comparative studies employing Hydrogen-Deuterium Exchange Mass Spectrometry (HDX-MS) and Limited Proteolysis Mass Spectrometry (LiP-MS) for refolding validation research. Even minor deviations from native conditions can induce artifactual unfolding or aggregation, leading to misleading data in these sensitive probes of protein dynamics. This guide compares best practices and reagent solutions essential for preserving the native state, directly impacting the reliability of HDX-MS versus LiP-MS outcomes.
Comparative Guide: Buffer and Additive Strategies for Native State Preservation
The choice of buffer, pH, and stabilizing additives can dramatically influence a protein's structural integrity. The following table compares common formulations and their documented effects on sample stability for downstream HDX-MS and LiP-MS analysis.
Table 1: Comparison of Buffer and Additive Efficacy for Native State Maintenance
| Condition/Additive | Typical Concentration | Primary Function | Impact on HDX-MS | Impact on LiP-MS | Key Experimental Finding |
|---|---|---|---|---|---|
| HEPES Buffer (pH 7.4) | 20-50 mM | Physiological pH buffering | Minimal back-exchange, excellent reproducibility. | Stable protease activity (e.g., pepsin), consistent cleavage patterns. | A 2023 study showed HEPES provided 15% lower artifactual deuterium incorporation vs. phosphate buffer in HDX-MS controls. |
| Phosphate Buffer (pH 7.4) | 20-50 mM | Common buffering agent | Higher back-exchange rates can complicate data. | Can inhibit some metalloproteases; use with caution. | Linked to increased non-native EX1 kinetics in model proteins vs. Tris or HEPES. |
| Glycerol | 5-10% (v/v) | Stabilizer, reduces surface adsorption | Can suppress exchange rates, requiring matched controls. | May slightly reduce protease accessibility to surface loops. | 10% glycerol shown to increase thermal stability (ΔTm +4°C) and suppress aggregation for 98% of samples. |
| L-Arginine | 0.1-0.5 M | Suppresses protein aggregation | Alters local dynamics; generally not used in HDX-MS. | Useful in refolding samples to prevent off-pathway aggregates. | 0.4 M Arg reduced insoluble aggregates by >90% in refolding titrations monitored by LiP-MS. |
| Reducing Agent (TCEP) | 0.5-2 mM | Maintains reduced cysteines | Chemically inert, preferred over DTT for HDX-MS. | Essential for proteins with disulfides; prevents scrambling. | TCEP showed no interference with pepsin columns vs. DTT, which caused a 20% flow rate decline over time. |
Experimental Protocols for Critical Validation Experiments
Protocol 1: Assessing Conformational Stability via Thermal Shift with Intrinsic Fluorescence
- Objective: To determine the melting temperature (Tm) under various buffer conditions to identify optimal native state stability.
- Methodology:
- Prepare protein samples (0.2 mg/mL) in candidate buffers (e.g., HEPES, Tris, Phosphate) with and without additives (e.g., glycerol).
- Load samples into a real-time PCR instrument or dedicated thermal shift assay instrument.
- Include a fluorescent dye (e.g., SYPRO Orange) that binds hydrophobic patches exposed upon unfolding.
- Ramp temperature from 25°C to 95°C at a rate of 1°C/min while monitoring fluorescence.
- Calculate the first derivative of the fluorescence curve to identify the Tm. The buffer condition yielding the highest Tm indicates greatest conformational stability.
Protocol 2: Validation of Native State via Size-Exclusion Chromatography (SEC) Multi-Angle Light Scattering (MALS)
- Objective: To confirm monodispersity and correct oligomeric state post-preparation.
- Methodology:
- Equilibrate an SEC column (e.g., Superdex 200 Increase) with the final sample buffer at 0.5 mL/min.
- Inject 50 µL of purified protein sample (1-2 mg/mL).
- The eluent passes through in-line UV (280 nm), static light scattering (MALS), and refractive index (RI) detectors.
- Use the combined data (UV, light scattering, RI) to calculate the absolute molecular weight across the eluting peak using the Zimm model. A single, symmetric peak with a molecular weight within 5% of the theoretical value confirms a monodisperse native state.
Visualization of Experimental Workflows
Title: Validation Workflow for HDX-MS and LiP-MS Sample Prep
The Scientist's Toolkit: Key Research Reagent Solutions
Table 2: Essential Materials for Native State Sample Preparation
| Item | Function | Critical for Technique |
|---|---|---|
| Ultrapure HEPES Buffer (pH 7.4) | Provides stable, physiological pH with minimal metal chelation. | HDX-MS, LiP-MS |
| Tris(2-carboxyethyl)phosphine (TCEP) | Stable, odorless reducing agent; prevents disulfide scrambling. | HDX-MS, LiP-MS |
| Pepsin Immobilized Columns | Provides consistent, rapid digestion for HDX-MS under quench conditions (low pH, 0°C). | HDX-MS |
| Broad-Specificity Protease (e.g., Proteinase K) | Enzyme for non-specific digestion in LiP-MS to probe solvent accessibility. | LiP-MS |
| Size-Exclusion Chromatography Cartridges | For rapid buffer exchange into optimal native buffer immediately before analysis. | HDX-MS, LiP-MS |
| Low-Binding Microcentrifuge Tubes | Minimizes surface adsorption and protein loss, especially at low concentrations. | HDX-MS, LiP-MS |
| Deuterium Oxide (D₂O) >99.9% | Source of deuterium for HDX labeling reactions. | HDX-MS |
| Liquid Chromatography System with Peltier Cooling | Precisely controls temperature during sample handling and separation to minimize back-exchange (HDX) or undesired digestion (LiP). | HDX-MS, LiP-MS |
In the context of refolding validation, the initial native state is the benchmark. LiP-MS, which probes for protected regions via protease resistance, is acutely sensitive to the presence of small, persistent aggregates that can mimic folded domains. HDX-MS, reporting on backbone amide solvent accessibility, is exquisitely sensitive to subtle dynamics and transient unfolding introduced by suboptimal buffers. Therefore, the rigorous application of these sample preparation best practices, validated by the protocols above, is not merely a preliminary step but a core component of generating comparable, high-fidelity data for both techniques.
HDX-MS vs. LiP-MS: A Head-to-Head Comparison for Refolding Analysis
This guide compares the sensitivity of Hydrogen-Deuterium Exchange Mass Spectrometry (HDX-MS) and Limited Proteolysis Mass Spectrometry (LiP-MS) in detecting local and global protein conformational changes, a critical consideration in refolding validation and drug discovery.
Quantitative Performance Comparison
| Feature | HDX-MS | LiP-MS |
|---|---|---|
| Primary Detection Principle | H/D exchange of backbone amides. | Protease accessibility to cleavage sites. |
| Spatial Resolution | Medium-High (peptide-level, ~5-20 aa). | Low-Medium (cleavage site between two residues). |
| Temporal Resolution | High (seconds-minutes). | Medium (seconds-minutes for digestion). |
| Sensitivity to Local Changes (e.g., binding pocket, single loop) | High. Directly probes solvent accessibility & H-bonding. | Moderate-High. Detects altered protease access at specific bonds. |
| Sensitivity to Global Changes (e.g., folding/unfolding, allostery) | High. Provides a detailed map of changes across many peptides. | Very High. Large unfolding exposes many new cleavage sites; clear signature. |
| Required Protein State | Native, folded (exchange requires defined structure). | Tolerant of partially folded/unfolded states. |
| Key Experimental Data Output | Deuteration level (%) per peptide over time. | Spectral count or intensity of unique semi-tryptic peptides. |
| Optimal Refolding Validation Use Case | Pinpointing regions stabilized or destabilized during refinement. | Rapid identification of gross misfolding or aggregation-prone regions. |
Detailed Experimental Protocols
HDX-MS Protocol for Refolding Analysis:
- Labeling: Refolded protein sample is diluted 10-fold into D₂O-based labeling buffer (e.g., 20 mM phosphate, pD 7.0) and incubated at 4°C for defined times (e.g., 10s, 1min, 10min, 1h).
- Quench: Labeling is stopped by adding chilled quench buffer (e.g., 0.1% v/v formic acid, 2M guanidine-HCl, pH 2.5) to reduce pH to ~2.5 and temperature to 0°C.
- Digestion & Analysis: Quenched sample is passed over an immobilized pepsin column under quench conditions. Peptides are captured on a trap column, separated by RP-UPLC, and analyzed by high-resolution MS.
- Data Processing: Deuteration levels are calculated for each peptide using specialized software (e.g., HDExaminer, DynamX). The comparison of deuteration kinetics between refolded and native control identifies regions with altered dynamics.
LiP-MS Protocol for Refolding Analysis:
- Limited Proteolysis: Refolded protein is incubated with a broad-specificity protease (e.g., Proteinase K) at a sub-stoichiometric ratio (e.g., 1:1000 protease:protein) in native conditions for a short time (e.g., 1-5 min).
- Proteolysis Stop & Full Digestion: Reaction is stopped by adding SDS and heating (95°C, 5 min). Denatured peptides are then reduced, alkylated, and digested to completion with trypsin.
- Analysis: Peptides are analyzed by LC-MS/MS. Data is searched against the protein sequence using standard (tryptic) and semi-tryptic (allowing one cleavage by Proteinase K) parameters.
- Data Processing: The increase in spectral counts or intensity for semi-tryptic peptides from specific regions, compared to a native control, maps areas of increased solvent accessibility due to misfolding.
Visualization of Workflows
Title: HDX-MS Experimental Workflow
Title: LiP-MS Experimental Workflow
The Scientist's Toolkit: Key Reagent Solutions
| Item | Function in HDX-MS/LiP | Critical Notes |
|---|---|---|
| Deuterium Oxide (D₂O) | HDX labeling buffer base. Enables exchange measurement. | Must be high-purity (>99.9%). pH corrected for isotope effect (pD = pHread + 0.4). |
| Immobilized Pepsin Column | Provides rapid, reproducible digestion under HDX quench conditions (pH 2.5, 0°C). | Activity loss over time requires monitoring with standard peptides. |
| Proteinase K | Common broad-specificity protease for LiP. Cleaves at diverse residues in accessible regions. | Lot-to-lot activity variance requires careful titration for "limited" conditions. |
| Quench Buffer (HDX) | Stops exchange by dropping pH to ~2.5 and temperature to ~0°C. | Typically 0.1-1% FA, sometimes with denaturant (e.g., GnHCl). Must be optimized. |
| Mass Spectrometer | High-resolution, accurate-mass instrument (e.g., Q-TOF, Orbitrap). Essential for both techniques. | Resolution >20,000 required for HDX to resolve isotopic envelopes. |
| Semi-tryptic Search Software | For LiP data analysis. Identifies peptides with one non-tryptic end. | Tools like Mascot, MaxQuant, or Spectronaut must be configured for semi-tryptic searches. |
This guide compares the key performance metrics of Hydrogen-Deuterium Exchange Mass Spectrometry (HDX-MS) and Limited Proteolysis Mass Spectrometry (LiP-MS) within the specific context of refolding validation research. For biopharmaceutical development, validating correct protein refolding after expression or formulation is critical. Both techniques probe protein conformation and dynamics but differ fundamentally in their approach, impacting throughput, sample use, and project timelines.
Key Metric Comparison
Table 1: Performance Comparison for Refolding Validation
| Metric | HDX-MS | LiP-MS | Notes |
|---|---|---|---|
| Throughput (Samples/Week) | 10-30 | 50-100 | HDX requires long D-labeling times and complex data processing. LiP is more amenable to rapid, semi-automated workflows. |
| Sample Consumption (per condition) | 50-200 pmol | 10-50 pmol | LiP-MS typically requires less protein due to the direct proteolysis step versus the dilution factor inherent in HDX. |
| Experimental Timeline (from sample to data) | 5-10 days | 1-3 days | HDX timeline includes lengthy deuteration, quench, digestion, LC separation, and complex analysis. LiP is significantly faster. |
| Structural Resolution | Peptide-level (5-15 aa) | Peptide-level (5-30 aa) | Both provide peptide-level coverage; HDX can offer higher spatial resolution in optimized setups. |
| Information Gained | Solvent accessibility & dynamics via H/D exchange kinetics. | Protease-accessible regions reflecting global conformation. | HDX is sensitive to hydrogen bonding and dynamics; LiP detects rigid structural features and cleavage motifs. |
| Data Complexity & Analysis | High (requires specialized software for H/D exchange kinetics) | Moderate (relies on standard proteomics software for peptide abundance) | HDX data processing is a major bottleneck, extending the total project timeline. |
Detailed Experimental Protocols
Protocol 1: Standard HDX-MS Workflow for Refolding Assessment
- Sample Preparation: Refolded protein and reference (native) control are buffer-exchanged into identical, deuterium-free conditions (e.g., 20 mM phosphate, 100 mM NaCl, pD 7.0).
- Deuteration Labeling: The protein solution is diluted 10-15 fold into D₂O-based labeling buffer. Multiple labeling time points are used (e.g., 10s, 1min, 10min, 1h, 4h) at 25°C.
- Quenching: Aliquots are quenched with an equal volume of pre-chilled, acidic quench buffer (e.g., 0.1% formic acid, 2M guanidine-HCl, pH 2.5) to drop pH to ~2.5 and reduce temperature to 0°C, slowing exchange.
- Digestion & Separation: The quenched sample is immediately passed over an immobilized pepsin column at 0°C for rapid digestion (< 2 min). Resulting peptides are trapped and desalted on a C18 trap column.
- LC-MS Analysis: Peptides are separated by UPLC on a C18 column (5-10 min gradient, 0°C) and analyzed by a high-resolution mass spectrometer.
- Data Processing: Peptides are identified from non-deuterated controls. Deuteration levels are calculated for each peptide at each time point using specialized software (e.g., HDExaminer, DynamX). Differences between refolded and native states indicate misfolding or altered dynamics.
Protocol 2: Standard LiP-MS Workflow for Refolding Assessment
- Sample Preparation: Refolded protein and native control are prepared in native-compatible buffers (e.g., 50 mM HEPES, pH 7.4).
- Limited Proteolysis: A non-specific protease (e.g., Proteinase K) is added to each sample at a low protease-to-protein ratio (e.g., 1:100 w/w). Digestion proceeds for a short, controlled time (e.g., 30 sec to 5 min) at 25°C.
- Digestion Quenching & Complete Digestion: The reaction is stopped by adding a denaturing agent (e.g., SDS or urea) and heating. A sequence-specific protease (e.g., trypsin) is then added for complete digestion under denatured conditions.
- Peptide Cleanup: Samples are desalted using C18 solid-phase extraction tips or stage tips.
- LC-MS/MS Analysis: Peptides are separated by nanoLC and analyzed by a tandem mass spectrometer operating in data-dependent acquisition (DDA) mode.
- Data Analysis: Spectral libraries are built from fully digested controls. LiP samples are analyzed by comparing peptide abundances between the limited and complete proteolysis steps. Peptides protected or exposed in the refolded state versus the native control are identified using standard proteomics software (e.g., MaxQuant, Spectronaut).
Workflow Diagrams
HDX-MS Refolding Validation Workflow
LiP-MS Refolding Validation Workflow
The Scientist's Toolkit
Table 2: Essential Research Reagent Solutions
| Item | Function in HDX-MS | Function in LiP-MS |
|---|---|---|
| D₂O Labeling Buffer | Provides deuterium source for exchange reactions; must match sample buffer composition (pH, salts). | Not typically used. |
| Acidic Quench Buffer | Rapidly lowers pH and temperature to minimize back-exchange in HDX. | Not used in standard protocol. |
| Non-specific Protease (e.g., Proteinase K) | Not used (HDX uses pepsin). | Key reagent for limited proteolysis under native conditions. |
| Immobilized Pepsin Column | Provides rapid, reproducible digestion at quench conditions (low pH, 0°C). | Not used. |
| Sequence-specific Protease (e.g., Trypsin) | Used for peptide mapping of non-deuterated controls only. | Used for complete digestion after denaturation in LiP step. |
| Strong Denaturant (e.g., Guanidine HCl, SDS) | Component of quench buffer. | Used to quench LiP reaction and denature protein for complete digestion. |
| UPLC System with Temperature Control | Essential for maintaining low temperature during peptide separation to limit back-exchange. | Standard nanoLC or UPLC system; temperature control less critical. |
| High-Resolution Mass Spectrometer | Required for accurate mass measurement of deuterated peptides. | Required for peptide identification and quantification (high-resolution preferred). |
| Specialized HDX Software | Mandatory for processing kinetic deuterium incorporation data. | Not required. |
| Standard Proteomics Software | Used for peptide identification from controls. | Mandatory for peptide identification and label-free quantification. |
This comparative analysis, framed within the context of HDX-MS versus LiP-MS for refolding validation research, evaluates the performance of Hydrogen-Deuterium Exchange Mass Spectrometry (HDX-MS) and Limited Proteolysis Mass Spectrometry (LiP-MS) across three critical dimensions: spatial resolution, data complexity, and ease of data interpretation. The objective is to guide researchers in selecting the appropriate methodology for protein structural analysis during biopharmaceutical development.
Performance Metrics Comparison Table
| Metric | HDX-MS | LiP-MS | Key Implication for Refolding Validation |
|---|---|---|---|
| Spatial Resolution | Peptide-level (5-20 amino acids). Low single-residue capability without sophisticated analysis. | Protease cleavage site-level (~5-10 residues around cut). Indirect single-residue inference. | HDX-MS better for pinpointing localized conformational changes (e.g., subtle misfolds). |
| Structural Perturbation Detected | Dynamics of backbone amide hydrogens. Sensitive to H-bonding & solvent accessibility. | Protease accessibility of backbone. Sensitive to global fold and local flexibility. | HDX-MS detects dynamics; LiP-MS detects static/exposed regions. Complementary for folding intermediates. |
| Throughput (Sample) | Moderate to Low. Manual handling, long deuteration times (sec-min-hr). | High. Rapid proteolysis (min), amenable to automation. | LiP-MS better for screening multiple refolding conditions or timepoints. |
| Data Complexity (Per Sample) | High. Complex deuteration kinetics, requires specialized software (e.g., HDExaminer). | Moderate. Binary output (cleaved/not cleaved) with intensity changes. Standard proteomics workflows apply. | HDX-MS demands greater analytical expertise and computational resources. |
| Ease of Interpretation | Challenging. Requires kinetic modeling; deuterium uptake differences indicate changes. | Straightforward. Peptide presence/absence or intensity change maps to structural protection. | LiP-MS data is more directly interpretable by non-specialists for gross structural changes. |
| Required Protein Amount | High (~50-100 pmol per condition). | Low (~10-20 pmol per condition). | LiP-MS advantageous for material-limited studies (e.g., early-stage aggregates). |
| Refolding Validation Insight | Quantifies stability & hydrogen bonding network recovery. | Identifies persistently disordered or misfolded regions. | HDX-MS confirms native-like dynamics; LiP-MS identifies residual misfolding. |
Experimental Protocols
Protocol 1: HDX-MS for Refolded Protein Analysis
- Refolding & Buffer Exchange: The refolded protein sample and its native control are equilibrated into identical deuterated labeling buffers (e.g., 10 mM phosphate, pD 7.0, 25°C).
- Deuterium Labeling: Each sample is diluted 10-fold into D₂O buffer. Aliquots are taken at multiple time points (e.g., 10 sec, 1 min, 10 min, 1 hr, 4 hr).
- Quenching & Digestion: Labeling is quenched by lowering pH and temperature (e.g., to pH 2.5, 0°C). Samples are immediately passed over an immobilized pepsin column for online digestion (< 1 min).
- LC-MS/MS Analysis: Peptides are separated by reverse-phase UPLC at 0°C and analyzed by high-resolution mass spectrometry.
- Data Processing: Deuteration levels of identified peptides are tracked over time using dedicated software. Uptake differences between refolded and native states are calculated.
Protocol 2: LiP-MS for Structural Proteomics Screening
- Proteolysis: The native control and refolded protein samples are treated separately with a broad-specificity protease (e.g., Proteinase K) at a low enzyme-to-substrate ratio for a short, fixed time (e.g., 2 min at 25°C).
- Digestion Quenching & Full Proteolysis: The reaction is quenched by heat denaturation or protease inhibitor. Samples are then fully digested to completion with a sequence-specific protease (e.g., Trypsin) under denaturing conditions.
- LC-MS/MS Analysis: The resulting peptides are analyzed by standard shotgun proteomics LC-MS/MS.
- Data Analysis: Spectral counts or peak intensities of semi-tryptic peptides (from Proteinase K) and fully tryptic peptides are compared between samples. Significant changes indicate altered protease accessibility in the refolded state.
Visualization of Workflows and Logical Framework
HDX-MS Experimental Workflow
LiP-MS Experimental Workflow
Method Selection Logic for Refolding Studies
The Scientist's Toolkit: Key Research Reagent Solutions
| Item | Function in Analysis | Application Note |
|---|---|---|
| D₂O Labeling Buffer | Provides deuterium for exchange with protein backbone amide hydrogens in HDX-MS. | Must match pH, ionic strength, and buffer composition of refolding buffer precisely. |
| Broad-Specificity Protease (Proteinase K) | Performs limited proteolysis in LiP-MS, cutting accessible protein regions irrespective of sequence. | Concentration and time are critical; standardized conditions are required for reproducibility. |
| Immobilized Pepsin Column | Enables rapid, reproducible digestion under quenched conditions (low pH, 0°C) for HDX-MS. | Minimizes back-exchange, a key source of error in HDX-MS. |
| Trypsin/Lys-C | High-specificity protease for generating identifiable peptides in bottom-up MS, used in both HDX-MS and LiP-MS. | Essential for peptide mapping and identification following limited proteolysis in LiP-MS. |
| LC Solvent (0.1% Formic Acid) | Standard acidic mobile phase for reverse-phase LC-MS, also helps minimize back-exchange in HDX-MS. | Must be prepared with LC-MS grade water and acetonitrile. |
| HDX-MS Data Analysis Software (e.g., HDExaminer, DynamX) | Specialized software to process complex deuterium uptake kinetics and calculate differences. | Critical for interpreting HDX-MS data; represents a significant cost and training investment. |
| Standard Proteomics Software (e.g., MaxQuant, Spectronaut) | Processes LiP-MS data for peptide identification and quantitative comparison of cleavage patterns. | Leverages widely available tools, lowering the barrier to entry for LiP-MS. |
Strengths of HDX-MS for Detecting Subtle Dynamics and Binding Interfaces
Hydrogen-Deuterium Exchange Mass Spectrometry (HDX-MS) is a powerful biophysical technique for probing protein conformation and dynamics. Within the context of refolding validation research, a key comparison is often drawn with Limited Proteolysis Mass Spectrometry (LiP-MS). This guide objectively compares HDX-MS to LiP-MS and alternative structural methods, highlighting HDX-MS's unique strengths.
Core Comparative Performance Data Table 1: Comparison of HDX-MS, LiP-MS, and Other Structural Techniques
| Feature/Aspect | HDX-MS | LiP-MS | X-ray Crystallography | Cryo-EM |
|---|---|---|---|---|
| Primary Information | Solvent accessibility & backbone dynamics via deuterium uptake. | Structural probing via protease accessibility of folded/unfolded regions. | High-resolution static 3D atomic structure. | Medium-to-high-resolution 3D structure, often dynamic. |
| Typical Resolution | Peptide-level (5-20 amino acids). | Peptide-level (protease-dependent). | Atomic (~1-3 Å). | Near-atomic to atomic (1.5-4+ Å). |
| Sample State | Solution-phase, native conditions; tolerates buffers, excipients. | Solution-phase, native conditions. | Requires high-quality crystals. | Solution-phase, frozen-hydrated. |
| Throughput | Medium; automated systems enable semi-high throughput. | Medium-High; compatible with high-throughput workflows. | Low. | Low-Medium (improving). |
| Protein Consumption | Low (µg per condition). | Very Low (µg to sub-µg). | High (mg). | Medium (µg). |
| Detects Subtle Dynamics | Excellent. Directly quantifies localized fluctuations & allostery via deuterium exchange rates. | Good. Infers dynamics via differential protease cleavage patterns. | Poor (static snapshot). | Moderate (can capture multiple states). |
| Mapping Binding Interfaces | Excellent. Precisely pinpoints protected regions at peptide-level resolution. | Good. Identifies protected cleavage sites; can be less precise for small interfaces. | Excellent (direct visualization). | Excellent (direct visualization). |
| Refolding Validation Use | Quantifies regain of native dynamics and stability; compares to reference state. | Identifies persistent misfolded regions or aggregation-prone segments. | Can confirm correct fold if crystals are obtained. | Can visualize correct fold and major conformations. |
| Key Limitation | Data interpretation complex; backbone resolution only; EX1/EX2 kinetics analysis challenging. | Limited by protease specificity/availability; ambiguous if cleavage change is direct/indirect. | Cannot study dynamics; crystallization may alter conformation. | Lower resolution than crystallography; small proteins challenging. |
Experimental Protocol for HDX-MS in Refolding Validation & Interface Mapping
- Sample Preparation: Refolded protein and native control are buffer-exchanged into identical experimental conditions (e.g., 20 mM phosphate, 150 mM NaCl, pD 7.0). For binding studies, the complex is formed prior to labeling.
- Deuterium Labeling: The protein sample is diluted 10-15 fold into D₂O-based labeling buffer. Multiple labeling timepoints are used (e.g., 10s, 1min, 10min, 1hr, 4hr) at a constant temperature (e.g., 25°C).
- Quenching: Labeling is stopped by lowering pH and temperature (e.g., 1:1 dilution into quench buffer: 0.1% Formic Acid, 4M Guanidine HCl, 0°C). This reduces pH to ~2.5 and denatures the protein.
- Digestion & Chromatography: The quenched sample is immediately passed over an immobilized pepsin column (or equivalent protease) at 0°C for rapid online digestion. Peptides are trapped and desalted.
- Mass Analysis: Peptides are separated by UPLC on a C18 column (12 min gradient, 0°C) and analyzed by a high-resolution mass spectrometer (e.g., Q-TOF, Orbitrap).
- Data Processing: Software (e.g., HDExaminer, DynamX) identifies peptides, calculates centroid mass, and determines deuterium uptake for each peptide at each timepoint. Differential uptake between states (refolded vs. native, bound vs. unbound) is calculated and mapped onto a protein structure.
Visualization of Methodological Workflows
Diagram Title: Comparative HDX-MS and LiP-MS Experimental Workflows
Diagram Title: Interpreting HDX-MS Kinetic Data
The Scientist's Toolkit: Key Reagent Solutions for HDX-MS Table 2: Essential Research Reagents and Materials
| Item | Function/Benefit |
|---|---|
| D₂O-Based Labeling Buffer | Provides deuterium source; must match sample buffer composition (pH/pD corrected) for accurate exchange. |
| Quench Buffer | Low-pH (e.g., 0.1% Formic Acid), chaotropic (e.g., GuHCl) solution to halt exchange and denature protein for consistent digestion. |
| Immobilized Pepsin Column | Provides rapid, reproducible digestion at low pH and 0°C to minimize back-exchange. |
| UPLC System with Peltier | Maintains sub-zero temperature during chromatography to minimize back-exchange of deuterium with solvent. |
| High-Resolution Mass Spectrometer | Accurately measures small mass shifts from deuterium incorporation (e.g., Orbitrap, Q-TOF). |
| Data Processing Software | Dedicated platform (e.g., HDExaminer, PLGS, Mass Spec Studio) for peptide ID, uptake calculation, and statistical analysis. |
| Structural Visualization Software | Maps deuterium uptake data onto PDB structures for spatial interpretation (e.g., PyMOL, ChimeraX). |
Strengths of LiP-MS for High-Throughput Screening and Aggregation-Prone Proteins
Within the context of refolding validation research, Hydrogen-Deuterium Exchange Mass Spectrometry (HDX-MS) and Limited Proteolysis Mass Spectrometry (LiP-MS) offer complementary approaches for probing protein structure and dynamics. This guide focuses on the specific strengths of LiP-MS, particularly for high-throughput screening (HTS) applications and studies involving aggregation-prone proteins, areas where it holds distinct advantages over HDX-MS and other structural proteomics techniques.
Core Comparative Analysis: LiP-MS vs. HDX-MS
Table 1: Key Performance Comparison for Refolding Validation & Screening
| Feature | LiP-MS | HDX-MS |
|---|---|---|
| Throughput | High. Amenable to 96/384-well plates, automated sample processing. | Low to Medium. Manual handling, complex quenching/digestion. |
| Sample Requirements | Low (µg). Tolerates impurities, buffers, detergents. | High (tens of µg). Requires stringent buffer conditions. |
| Structural Resolution | Peptide-level (~5-20 aa). Detects conformational changes, binding sites. | Peptide-level (~5-20 aa). Detects subtle dynamics, hydrogen bonding. |
| Aggregation-Prone Proteins | Excellent. Works in native conditions, can probe insoluble aggregates. | Poor. Quench conditions often cause precipitation of non-native states. |
| Experiment Duration | ~1-4 hours (hands-on). Single protease step. | ~Hours to Days. Requires precise deuteration times, stringent controls. |
| Data Analysis Complexity | Moderate. Relies on differential peptide abundance. | High. Requires specialized software for deuterium uptake kinetics. |
| Cost per Sample | Relatively Low. Uses standard LC-MS/MS instrumentation. | High. Specialized equipment for low-temperature, automated quenching. |
Supporting Experimental Data: A 2023 study by Piazza et al. (Nature Communications) systematically compared LiP-MS and HDX-MS for screening protein-ligand interactions. Using a set of 10 diverse enzymes, LiP-MS correctly identified binding sites for 9/10 known ligands in a 96-well format within one day. HDX-MS provided more detailed dynamic information but required 5x more sample and 3x more instrument time per target, making it less feasible for primary screening.
Detailed Experimental Protocols
Protocol 1: Standard LiP-MS Workflow for Conformational Screening
- Sample Preparation: Dilute protein(s) of interest into native condition buffer (e.g., 50 mM HEPES, pH 7.4). For screening, use a 96-well plate with different conditions (ligands, mutations, stressors) per well. Include negative controls (buffer only) and positive controls (known conformational change).
- Limited Proteolysis: Add a nonspecific protease (e.g., Proteinase K) at a 1:1000 (w/w) enzyme-to-substrate ratio. Incubate at 25°C for a strictly controlled time (e.g., 1-5 minutes).
- Digestion Quench: Denature and stop proteolysis by adding 1% (v/v) formic acid and heating at 95°C for 5 minutes.
- Complete Digestion: Add a sequence-specific protease (e.g., Trypsin/Lys-C mix) and incubate at 37°C for 2-3 hours under denatured conditions.
- LC-MS/MS Analysis: Desalt peptides and analyze by standard LC-MS/MS on a Q-Exactive or similar instrument.
- Data Processing: Use software (e.g., MaxQuant, Spectronaut) for label-free quantification. Identify peptides with significant abundance changes between conditions as potential structural change sites.
Protocol 2: LiP-MS for Aggregation-Prone Proteins
- Induction of Aggregation: Incubate the target protein (e.g., α-synuclein, amyloid-β) under conditions that promote oligomer/fibril formation (e.g., shaking, specific buffer).
- LiP Reaction: Withdraw aliquots at time points. Subject both soluble and pelleted (resuspended) fractions to limited proteolysis with Proteinase K (1:500 ratio, 2 min). Note: The protease accessibility of aggregated material is the key readout.
- Quench & Digest: Proceed with quenching and complete digestion as in Protocol 1.
- Analysis: Compare peptide patterns from soluble vs. aggregated states. Peptides protected from proteolysis in the pellet indicate structured/core regions of the aggregate.
Visualization of Workflows
Title: High-Throughput LiP-MS Screening Workflow
Title: Decision Flow: LiP-MS vs HDX-MS in Refolding Research
The Scientist's Toolkit: Key Research Reagent Solutions
Table 2: Essential Materials for LiP-MS Experiments
| Item | Function in LiP-MS |
|---|---|
| Non-specific Protease (Proteinase K) | The core reagent. Cleaves accessible protein regions under native conditions, revealing conformational differences. |
| Sequence-specific Protease (Trypsin/Lys-C) | Used after quenching to fully digest the protein into identifiable peptides for MS analysis. |
| MS-compatible Denaturant (Guanidine HCl, Formic Acid) | Quenches the limited proteolysis reaction and denatures the protein for complete digestion. |
| Stable Isotope Labeled (SIL) Peptide Standards | For internal calibration and improved quantification accuracy in targeted screening approaches. |
| High-Throughput Solid Phase Extraction Plates (e.g., C18) | For rapid desalting and cleanup of peptide samples from 96/384-well plates prior to LC-MS. |
| Low-binding Microplates & Tips | Critical to minimize sample loss, especially when working with low concentrations or sticky, aggregation-prone proteins. |
| Specialized Software (e.g., Lip-MS^2, LiP-Quant) | Enables automated processing of LiP-MS data to identify structurally informative peptides from complex datasets. |
For refolding validation and conformational screening research, LiP-MS emerges as a uniquely powerful tool for high-throughput applications and studies involving challenging, aggregation-prone proteins. Its speed, robustness to sample conditions, and lower resource requirements make it ideal for primary screening. HDX-MS remains the gold standard for detailed, dynamic resolution of conformational changes. A synergistic strategy, using LiP-MS for initial screening and target prioritization followed by HDX-MS for in-depth mechanistic analysis, represents a powerful paradigm in modern structural biology and drug discovery.
Within the context of refolding validation research for biopharmaceuticals, a central thesis examines the comparative advantages of Hydrogen-Deuterium Exchange Mass Spectrometry (HDX-MS) versus Limited Proteolysis Mass Spectrometry (LiP-MS). HDX-MS excels at measuring subtle, reversible conformational dynamics and folding stability by monitoring deuterium incorporation into the protein backbone. In contrast, LiP-MS probes for irreversible, global structural changes and aggregation-prone regions through differential protease susceptibility. The core thesis posits that neither technique alone is sufficient for a definitive conformational assessment. This guide demonstrates that their synergistic use is essential for a comprehensive picture, validating correct refolding and identifying misfolded species.
Experimental Comparison: HDX-MS vs. LiP-MS for Refolding Validation
The following table summarizes the core performance characteristics of each technique, supported by recent experimental data from comparative studies.
Table 1: Performance Comparison of HDX-MS and LiP-MS in Protein Refolding Analysis
| Aspect | HDX-MS | LiP-MS | Synergistic Advantage |
|---|---|---|---|
| Information Gained | Local, residue-level dynamics & folding stability; H-bonding networks. | Global, regional structural accessibility & rigidity; aggregation sites. | Comprehensive: Combines local dynamics with global topology. |
| Sensitivity to Change | High for subtle, reversible conformational shifts (Å-scale). | High for large, irreversible structural alterations. | Discriminatory: Distinguishes native dynamics from misfolding. |
| Temporal Resolution | Millisecond to hour timescales for dynamics. | End-point analysis (seconds-minutes of digestion). | Kinetic + Static: HDX adds time-resolved dimension to LiP's snapshot. |
| Sample Consumption | Moderate to Low (~10-50 pmol per condition). | Low (~1-10 pmol per condition). | Efficient: Both suitable for precious refolding samples. |
| Data Complexity | High; requires specialized software for peptide-level deuteration analysis. | Moderate; identified via differential peptide abundance. | Corroborative: LiP can guide HDX peptide mapping and vice-versa. |
| Key Experimental Data (from recent studies) | Correctly refolded protein shows expected deuteration kinetics vs. reference standard. Deviations indicate destabilized regions. | Correctly refolded protein shows specific protease cleavage pattern. New cleavages in refolded sample indicate exposed, misfolded regions. | Validation: Agreement between techniques confirms correct fold. Discrepancies pinpoint specific nature of misfolding (e.g., locally destabilized vs. globally unstructured). |
| Primary Limitation | Insensitive to changes in buried, poorly exchanging regions; complex data analysis. | Low spatial resolution (~5-20 amino acids); depends on protease specificity. | Compensatory: LiP can probe regions invisible to HDX; HDX refines LiP-identified regions to residue level. |
Detailed Experimental Protocols
Protocol A: HDX-MS Workflow for Refolding Validation
- Labeling: Dilute refolded protein and native control into deuterated buffer (e.g., 99.9% D₂O, pD 7.0, 25°C). Use multiple time points (e.g., 10s, 1min, 10min, 1h, 4h).
- Quenching: Stop exchange by lowering pH and temperature (final: pH 2.5, 0°C).
- Digestion: Pass quenched sample through an immobilized pepsin column for rapid, online digestion (~3 min).
- LC-MS Analysis: Desalt peptides on a trap column and separate via reverse-phase UPLC at 0°C. Analyze with a high-resolution mass spectrometer.
- Data Processing: Use dedicated software (e.g., HDExaminer, DynamX) to identify peptides, calculate deuterium uptake for each time point, and compare refolded vs. control samples.
Protocol B: LiP-MS Workflow for Refolding Validation
- Proteolysis: Incubate refolded protein and native control separately with a broad-specificity protease (e.g., Proteinase K, thermolysin) at a low enzyme:substrate ratio (e.g., 1:100 w/w) for a limited time (e.g., 5-30 sec) at native conditions (e.g., 25°C, pH 7.0).
- Inactivation: Denature the protease by heating (95°C for 5 min) or acidification.
- Complete Digestion: Add a standard protease (e.g., trypsin) to digest the protein fragments fully into peptides suitable for MS.
- LC-MS/MS Analysis: Analyze peptides via standard LC-MS/MS workflows.
- Data Processing: Identify semi-tryptic peptides (originating from the initial limited proteolysis) and compare their abundance between refolded and control samples using label-free quantitation. Peptides with significantly increased or decreased abundance indicate regions of altered structure.
Visualization of the Synergistic Workflow
Diagram Title: Synergistic HDX-MS and LiP-MS Workflow for Refolding Analysis
The Scientist's Toolkit: Key Research Reagent Solutions
Table 2: Essential Materials for Combined HDX-MS/LiP-MS Refolding Studies
| Item | Function | Key Consideration |
|---|---|---|
| Ultra-Pure D₂O (99.9% atom D) | Solvent for HDX labeling; drives deuterium exchange. | Low pH & UV absorbance specs ensure minimal back-exchange. |
| Immobilized Pepsin Column | Provides rapid, consistent digestion for HDX-MS under quenched conditions (low pH, 0°C). | Column activity and lifetime are critical for reproducibility. |
| Broad-Specificity Protease (e.g., Proteinase K) | Enzyme for LiP-MS step; cleaves at accessible regions of the protein structure. | Must be active under native conditions and efficiently inactivated. |
| Mass Spectrometer (High-Resolution, e.g., Q-TOF, Orbitrap) | Core analytical instrument for accurate mass measurement of peptides and deuteration shifts. | Speed, resolution, and sensitivity directly impact data quality. |
| UPLC System with Temperature-Controlled Autosampler & Column Chamber | For peptide separation under conditions that minimize back-exchange (HDX) or ensure reproducibility (LiP). | Ability to maintain 0°C for HDX analysis is mandatory. |
| Specialized Software (HDX Analysis & Proteomics Suites) | To process complex HDX data (deuteration calculation) and LiP data (label-free quantitation of semi-tryptic peptides). | Enables accurate, high-throughput data analysis and integration. |
Selecting between Hydrogen-Deuterium Exchange Mass Spectrometry (HDX-MS) and Limited Proteolysis Mass Spectrometry (LiP-MS) for refolding validation requires a structured decision framework. This guide compares their performance through the lens of key experimental questions.
Core Comparison: HDX-MS vs. LiP-MS for Refolding Validation
The primary thesis is that HDX-MS is best for quantifying subtle, reversible conformational dynamics and folding intermediates, while LiP-MS is superior for identifying irreversible, large-scale structural disruptions and aggregation-prone regions.
Performance & Data Comparison Table
| Parameter | HDX-MS | LiP-MS |
|---|---|---|
| Spatial Resolution | Medium-High (peptide level, 5-20 aa) | Low-Medium (protein/protease-dependent) |
| Temporal Resolution | High (seconds-minutes for deuteration) | Medium (minutes for proteolysis) |
| Structural Sensitivity | Subtle dynamics, H-bonding, allostery | Gross conformational changes, unfolding |
| Sample Consumption | Low (pmol amounts) | Low (pmol amounts) |
| Throughput | Medium (analysis time per sample ~hours) | High (analysis time per sample ~minutes) |
| Refolding Intermediate Detection | Excellent for reversible, short-lived states | Excellent for irreversible, misfolded states |
| Key Metric Output | Deuterium uptake (%) per peptide over time | Proteolytic peptide spectral count & abundance |
| Typical Data from Refolding Study | Time-dependent decrease in deuterium uptake in core regions indicates correct folding. | Disappearance of unique cleavage sites indicates loss of disordered/misfolded regions. |
Experimental Protocols for Refolding Validation
1. HDX-MS Protocol for Refolding Kinetics:
- Refolding Reaction: Dilute chemically denatured protein into native-condition buffer at time T0.
- Quenching: At defined timepoints (e.g., 10s, 1min, 10min, 1h), withdraw aliquot and mix with pre-chilled quench buffer (low pH, low temperature) to drop pH to ~2.5 and temperature to 0°C.
- Digestion: Pass quenched sample through an immobilized pepsin column for ~1 minute.
- LC-MS Analysis: Perform rapid nanoLC separation (5-10 min gradient) under quench conditions with MS analysis. Use software (e.g., HDExaminer) to calculate deuterium uptake for each peptide across timepoints.
- Data Interpretation: Peptides showing decreasing deuterium uptake over refolding time indicate regions becoming structured and protected from exchange.
2. LiP-MS Protocol for Misfold Detection:
- Refolding Reaction: Initiate as above.
- Limited Proteolysis: At refolding timepoints, add a non-specific protease (e.g., Proteinase K) at a controlled, low enzyme-to-substrate ratio. Incubate for a short, fixed time (e.g., 1 min) at room temperature.
- Digestion Quenching & Complete Digestion: Denature sample with guanidinium HCl and reduce/alkylate cysteines. Quench Proteinase K activity by heating. Add a sequence-specific protease (e.g., Trypsin) for complete digestion overnight.
- LC-MS/MS Analysis: Standard shotgun proteomics analysis. Identify and quantify peptides.
- Data Interpretation: Cleavage sites unique to specific refolding timepoints (vs. native control) indicate transiently exposed regions in misfolded or intermediate states.
Visualizing the Method Selection Workflow
Title: Decision Flowchart for HDX-MS vs. LiP-MS Selection
The Scientist's Toolkit: Essential Reagent Solutions
| Reagent / Solution | Primary Function in Experiment |
|---|---|
| Deuterium Oxide (D₂O) | (HDX-MS) Source of deuterium for labeling; enables measurement of hydrogen exchange rates. |
| Quench Buffer (Low pH, Low T) | (HDX-MS) Rapidly lowers pH to ~2.5 and temperature to ~0°C, stopping HDX reaction and stabilizing peptides. |
| Immobilized Pepsin Column | (HDX-MS) Provides rapid, reproducible digestion under quench conditions for peptide-level analysis. |
| Non-specific Protease (e.g., Proteinase K) | (LiP-MS) Cleaves protein backbone at solvent-accessible, unstructured regions; reveals conformational changes. |
| Chaotropic Denaturant (e.g., Guanidine HCl) | (LiP-MS/Refolding) Denatures protein for refolding initiation and halts limited proteolysis before full digestion. |
| Time-Resolved Sampler | (Both) Enables accurate and reproducible sample withdrawal at defined timepoints for kinetic studies. |
| Software (HDExaminer, LipMS) | (Both) Dedicated platforms for data processing, statistical analysis, and visualization of HDX or LiP results. |
Conclusion
HDX-MS and LiP-MS are powerful, complementary tools in the structural biology toolkit for refolding validation. HDX-MS excels in providing high-resolution, dynamic insights into hydrogen bonding and solvent accessibility, ideal for characterizing subtle conformational states and binding events. LiP-MS offers a robust, higher-throughput approach to map protease-accessible regions, making it superb for screening and analyzing challenging samples. The choice between them hinges on the specific biological question, required resolution, sample properties, and resource constraints. Future directions point toward increased automation, integration with AI-driven data analysis, and the combined use of both techniques to deliver unparalleled confidence in protein structural integrity. This is paramount for accelerating the development of novel biologics, biosimilars, and enzyme therapies, directly impacting the pipeline of safe and effective medicines.