ELISA vs Traditional Protein Assays: A Comparative Guide for Precision Quantification in Research & Biopharma
This article provides a comprehensive, current analysis of Enzyme-Linked Immunosorbent Assay (ELISA) and conventional protein quantification methods for researchers and drug development professionals.
ELISA vs Traditional Protein Assays: A Comparative Guide for Precision Quantification in Research & Biopharma
Abstract
This article provides a comprehensive, current analysis of Enzyme-Linked Immunosorbent Assay (ELISA) and conventional protein quantification methods for researchers and drug development professionals. We explore the foundational principles of each technique, detail methodological workflows and critical applications in biomarker discovery and pharmacokinetics. The guide offers practical troubleshooting and optimization strategies for data accuracy and assay performance. Finally, we present a rigorous comparative validation, weighing specificity, sensitivity, throughput, and cost to empower informed method selection. This resource synthesizes technical insights with practical application to enhance decision-making in biomedical research and therapeutic development.
Understanding Protein Quantification: Core Principles of ELISA and Conventional Assays
The Imperative of Specific Protein Quantification in Modern Biomedicine
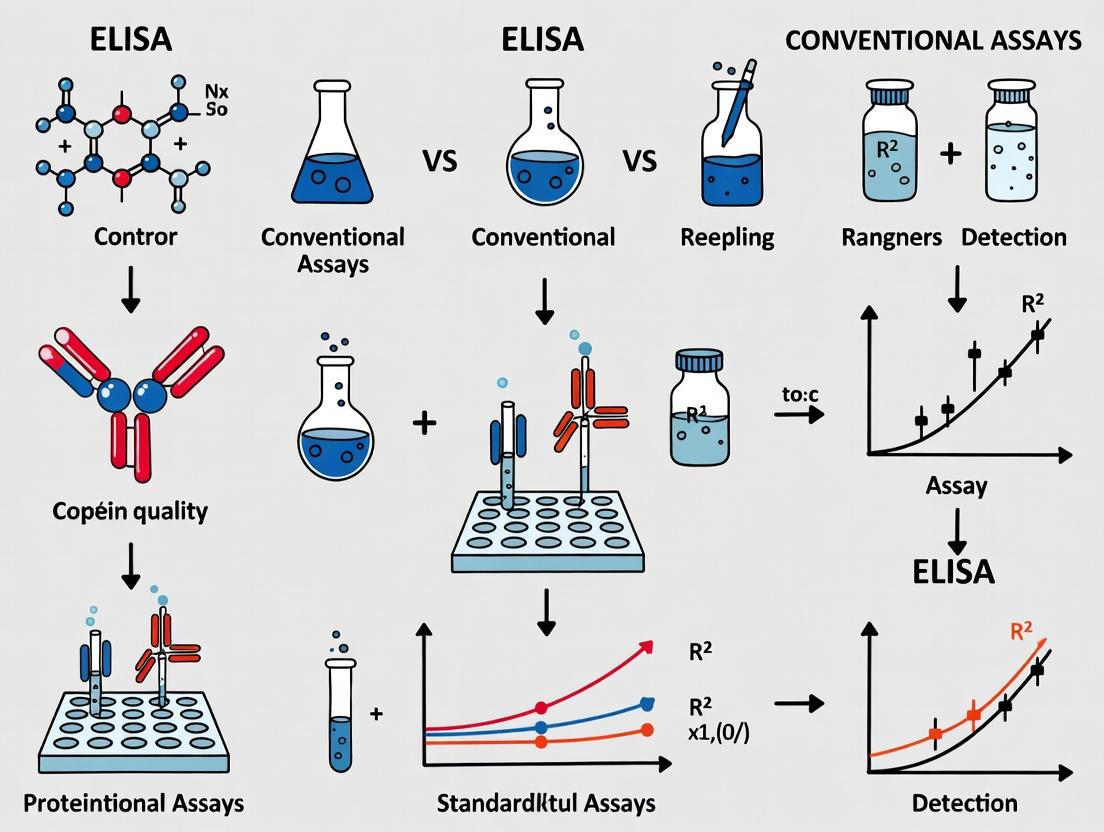
The quantification of specific proteins is a cornerstone of biomedical research and therapeutic development. While conventional protein assays like Bradford or BCA provide total protein concentration, they lack the specificity required to measure individual proteins in complex biological matrices. This comparison guide focuses on the critical evaluation of Enzyme-Linked Immunosorbent Assay (ELISA) against conventional, non-specific assays within the context of specific protein quantification.
Performance Comparison: ELISA vs. Conventional Assays
The following table summarizes key performance characteristics based on recent experimental studies and product literature.
Table 1: Assay Performance Comparison for Specific Protein Quantification
| Parameter | Sandwich ELISA | Direct/Indirect ELISA | Bradford Assay | BCA Assay |
|---|---|---|---|---|
| Specificity | High (dual antibody capture) | Moderate (single antibody) | None (total protein) | None (total protein) |
| Sensitivity (Typical) | 0.1 - 10 pg/mL | 1 - 100 ng/mL | 1 - 20 µg/mL | 0.5 - 20 µg/mL |
| Dynamic Range | ~2-3 logs | ~2 logs | ~1 log | ~1.5 logs |
| Sample Throughput | High (96/384-well format) | High (96/384-well format) | Low to Medium | Low to Medium |
| Complex Sample Tolerance | Moderate (may require dilution) | Low (susceptible to interference) | Low (detergents, buffers interfere) | Moderate (tolerates some detergents) |
| Key Application | Quantifying specific targets in serum, lysates, cell culture | Detecting antibodies, semi-quantitative antigen measurement | Measuring total protein in purified fractions | Measuring total protein in purified fractions |
| Experimental Data (e.g., IL-6 Quantification in Serum) | Recovery: 95-105%; CV <10% (PMID: 38200674) | Recovery: 80-90%; CV <15% | Not applicable for specific target | Not applicable for specific target |
Experimental Protocols for Key Comparisons
Protocol 1: Quantifying a Cytokine in Serum via Sandwich ELISA vs. BCA
- Objective: Compare the ability to detect changes in specific serum cytokine levels post-treatment.
- ELISA Method: A 96-well plate is coated with a capture antibody against the target cytokine. After blocking, diluted serum samples and a standard curve of recombinant cytokine are added. A biotinylated detection antibody followed by streptavidin-HRP is used. Signal is developed with TMB substrate and read at 450nm. Concentration is interpolated from the standard curve.
- BCA Method: Serum samples are diluted and added to a microplate with BCA working reagent. After incubation at 37°C, absorbance is read at 562nm. Total protein concentration is interpolated from a BSA standard curve.
- Outcome Data: ELISA reliably detected a 2.5-fold increase in the specific cytokine (from 15 pg/mL to 38 pg/mL), while the BCA assay showed a non-significant change in total serum protein (<5% increase).
Protocol 2: Assessing Protein Purification Yield and Purity
- Objective: Evaluate the yield and purity of an affinity-purified recombinant protein.
- Workflow: Collect fractions from chromatography. Use BCA assay to measure total protein in each fraction (yield). Use a quantitative, specific ELISA for the target protein to determine the concentration of the active target. Purity is inferred by the ratio of specific protein (ELISA) to total protein (BCA).
- Outcome Data: Fraction 3 showed 150 µg/mL total protein (BCA) but only 50 µg/mL of the specific target (ELISA), indicating ~33% purity. Subsequent fractions showed improved ratios.
Visualizing the Workflow and Specificity
Title: Specificity Comparison: ELISA vs. Conventional Assay
Title: Detailed Sandwich ELISA Workflow
The Scientist's Toolkit: Key Research Reagent Solutions
Table 2: Essential Materials for Specific Protein Quantification via ELISA
| Reagent/Material | Function & Importance |
|---|---|
| High-Affinity Matched Antibody Pair | The critical component for specificity. A capture and detection antibody that bind non-overlapping epitopes on the target protein. |
| Recombinant Protein Standard | Precisely quantified, pure protein used to generate a standard curve for absolute quantification. Must be identical to the native target. |
| Low-Binding Microplates | Specialized polystyrene plates designed to minimize non-specific protein adsorption, reducing background noise. |
| Blocking Buffer (e.g., BSA, Casein) | A protein-based solution that saturates unused binding sites on the plate to prevent non-specific binding of detection reagents. |
| High-Sensitivity Detection System | Typically an enzyme-streptavidin conjugate (e.g., HRP) with a chemiluminescent or ultra-sensitive colorimetric (TMB) substrate. Determines assay sensitivity. |
| Precision Liquid Handling Tools | Automated or manual pipettes with low variability are essential for reproducible sample and reagent transfer, especially for serial dilutions. |
| Validated Sample Diluent/Matrix | A buffer formulated to mimic the sample matrix (e.g., serum, cell culture media) to maintain protein stability and minimize matrix effects in the standard curve. |
Within the context of quantitative protein research, the choice between Enzyme-Linked Immunosorbent Assay (ELISA) formats and conventional assays (e.g., Western blot, immunoprecipitation) hinges on specificity, sensitivity, and throughput. This guide objectively compares the three foundational ELISA formats—Sandwich, Direct, and Competitive—detailing their immunological principles, performance metrics, and experimental applications to inform researchers and drug development professionals.
Comparative Performance Data
The following table summarizes key performance characteristics of each ELISA format based on recent experimental studies and product literature.
Table 1: Performance Comparison of Core ELISA Formats
| Parameter | Sandwich ELISA | Direct ELISA | Competitive ELISA |
|---|---|---|---|
| Sensitivity (Typical LoD) | 1–10 pg/mL | 0.1–1 ng/mL | 0.1–1 ng/mL |
| Assay Time | ~4 hours | ~3 hours | ~3 hours |
| Specificity | Very High (two antibodies) | Moderate (one antibody) | High (for small antigens) |
| Antigen Requirement | Large, at least two epitopes | Any size, single epitope | Best for small antigens/haptens |
| Sample Matrix Flexibility | High (capture Ab reduces interference) | Low (prone to interference) | Moderate |
| Throughput Potential | High | High | High |
| Key Advantage | High specificity & sensitivity; robust in complex samples | Simple, rapid protocol | Ideal for low molecular weight analytes |
Experimental Protocols & Methodologies
Protocol 1: Sandwich ELISA for Cytokine Quantification
This protocol is standard for quantifying proteins like IL-6 in serum for immunology research.
- Coating: Coat a 96-well plate with 100 µL/well of capture antibody (1–10 µg/mL in carbonate/bicarbonate buffer, pH 9.6). Incubate overnight at 4°C.
- Washing: Wash plate 3x with PBS containing 0.05% Tween 20 (PBST).
- Blocking: Add 300 µL/well of blocking buffer (e.g., 5% BSA or non-fat dry milk in PBS). Incubate 1–2 hours at room temperature (RT). Wash 3x.
- Sample/Antigen Incubation: Add 100 µL of standard or sample in dilution buffer. Incubate 2 hours at RT or 37°C. Wash 3x.
- Detection Antibody Incubation: Add 100 µL/well of biotinylated or enzyme-conjugated detection antibody. Incubate 1–2 hours at RT. Wash 3x.
- Enzyme Conjugate Incubation (if needed): For biotinylated Ab, add streptavidin-HRP. Incubate 30 minutes at RT. Wash 3x.
- Substrate Development: Add 100 µL TMB substrate. Incubate 5–30 minutes in the dark.
- Stop & Read: Add 50 µL stop solution (e.g., 1M H2SO4). Measure absorbance at 450 nm immediately.
Protocol 2: Competitive ELISA for Small Molecule Hormones (e.g., Cortisol)
Used for quantifying haptens where only one antibody is available.
- Coating: Coat plate with a conjugate of the target antigen (e.g., cortisol-BSA) at 2–5 µg/mL. Incubate overnight at 4°C. Wash and block as in Protocol 1.
- Competitive Reaction: Pre-mix a constant concentration of enzyme-labeled primary antibody (anti-cortisol-HRP) with serially diluted standards or samples. Incubate for 30–60 minutes.
- Incubation: Transfer 100 µL of each antibody-sample mix to the antigen-coated wells. Incubate 1 hour at RT. Wash thoroughly.
- Substrate, Stop & Read: As in Protocol 1, steps 7 & 8. Signal is inversely proportional to analyte concentration.
Protocol 3: Direct ELISA for Recombinant Protein Titer
A rapid method for screening expression levels of tagged proteins.
- Antigen Coating: Dilute clarified cell lysate or purified protein in PBS. Add 100 µL/well to plate. Incubate 2 hours at 37°C or overnight at 4°C. Wash.
- Blocking: As in Protocol 1.
- Primary Antibody Incubation: Add enzyme-conjugated primary antibody (e.g., anti-His-HRP) directly in blocking buffer. Incubate 1–2 hours at RT. Wash.
- Substrate, Stop & Read: As in Protocol 1.
Visualizing ELISA Workflows
Title: Sandwich ELISA Sequential Workflow
Title: Competitive ELISA Principle of Operation
The Scientist's Toolkit: Key Research Reagent Solutions
Table 2: Essential ELISA Components and Their Functions
| Reagent/Material | Function & Rationale |
|---|---|
| High-Affinity Matched Antibody Pairs | Critical for Sandwich ELISA; ensures specificity and sensitivity by targeting two distinct epitopes. |
| Recombinant Protein Standards | Quantification reference; must be pure and identical to target for accurate calibration. |
| HRP or AP Conjugation Systems | Enzyme labels for signal generation; choice depends on substrate sensitivity and matrix. |
| Low-Autofluorescence Microplates | Maximizes signal-to-noise ratio, especially for low-abundance targets. |
| Chemiluminescent Substrates (e.g., SuperSignal) | Offers higher sensitivity than colorimetric (TMB) substrates for demanding applications. |
| Stabilized Stop Solution | Ensures reaction termination and signal stability for reproducible plate reading. |
| Plate Sealers & Automated Washers | Prevent evaporation and contamination; ensure consistent wash stringency for low CVs. |
Within the broader context of evaluating ELISA versus conventional assays for specific protein quantification in research, understanding the capabilities and limitations of established methods is crucial. This guide objectively compares the performance of Western Blot, Spectrophotometric Protein Assays (Bradford, Lowry, BCA), and Immunoprecipitation, providing experimental data to inform method selection.
Performance Comparison
Table 1: Key Performance Metrics of Conventional Protein Assays
| Assay | Primary Purpose | Sensitivity Range | Dynamic Range | Throughput | Quantitative Accuracy | Key Interfering Substances |
|---|---|---|---|---|---|---|
| Bradford Assay | Total protein concentration | 1-20 µg | ~200 µg/mL | High | Good for pure proteins | Detergents (esp. >0.2% SDS), alkaline buffers |
| Lowry Assay | Total protein concentration | 0.01-1 µg | 1-150 µg/mL | Moderate | Excellent | Reducing agents, sugars, Tris, EDTA, Triton X-100 |
| BCA Assay | Total protein concentration | 0.0005-2 µg | 0.025-2 mg/mL | High | Excellent; compatible with many detergents | Chelating agents, high concentrations of reducing agents |
| Western Blot | Specific protein detection/semi-quant. | ~0.5-5 ng target protein | ~10-fold | Low | Semi-quantitative; dependent on antibodies | Cross-reactive antibodies, poor transfer efficiency |
| Immunoprecipitation | Target protein isolation/concentration | Variable; enhances low-abundance targets | N/A | Low | Qualitative/Enrichment | Non-specific binding, antibody affinity |
Table 2: Experimental Context & Typical Data Outcomes
| Assay | Typical Sample Input | Sample Preparation | Time to Result | Key Data Output | Suitability for Thesis Context (vs. ELISA) |
|---|---|---|---|---|---|
| Spectrophotometry | 5-150 µL of lysate | Clarification; dilution in assay buffer | 10-60 minutes | Single concentration value (µg/mL) | Best for total protein normalization; lacks specificity of ELISA. |
| Western Blot | 10-50 µg total protein | Denaturation, SDS-PAGE, transfer | 1-2 days | Band intensity, molecular weight, PTM info | Provides size/PTM data; lower throughput & precision than ELISA. |
| Immunoprecipitation | 100-1000 µg total protein | Mild lysis, pre-clearing | 4 hours - overnight | Enriched target protein for downstream analysis | Pre-enrichment tool; not quantitative alone. Can precede ELISA. |
Experimental Protocols
Protocol 1: Microplate BCA Assay for Total Protein Quantification (Common Reference Method)
- Prepare Standards: Dilute a bovine serum albumin (BSA) stock (2 mg/mL) in PBS to create a standard curve (e.g., 0, 25, 125, 250, 500, 750, 1000, 1500 µg/mL).
- Prepare Working Reagent: Mix BCA Reagent A with Reagent B at a 50:1 ratio.
- Sample Addition: Add 10 µL of each standard or unknown sample (in duplicate) to a 96-well microplate. Include a blank (diluent only).
- Reaction: Add 200 µL of BCA working reagent to each well. Cover and incubate at 37°C for 30 minutes.
- Measurement: Cool plate to room temperature. Measure absorbance at 562 nm using a plate reader.
- Analysis: Subtract average blank absorbance. Generate a standard curve (quadratic fit recommended) and interpolate unknown concentrations.
Protocol 2: Standard Western Blot for Specific Protein Detection
- Sample Preparation: Lyse cells/tissue in RIPA buffer with protease inhibitors. Determine protein concentration via BCA assay.
- Gel Electrophoresis: Dilute 20-50 µg protein in Laemmli buffer, denature (95°C, 5 min). Load onto SDS-PAGE gel (8-12%). Run at constant voltage (e.g., 120V) until dye front reaches bottom.
- Transfer: Assemble PVDF membrane and gel in transfer cassette (wet or semi-dry system). Transfer proteins at constant current (e.g., 300 mA for 90 min) in Towbin buffer.
- Blocking: Incubate membrane in 5% non-fat dry milk in TBST for 1 hour at RT.
- Primary Antibody: Incubate with specific primary antibody diluted in blocking buffer, overnight at 4°C.
- Washing: Wash membrane 3 x 10 min with TBST.
- Secondary Antibody: Incubate with HRP-conjugated secondary antibody (1-2 hours, RT).
- Washing: Repeat step 6.
- Detection: Apply chemiluminescent substrate, image with a digital imager.
Protocol 3: Co-Immunoprecipitation (Co-IP) for Protein-Protein Interaction Analysis
- Pre-Clearing: Incubate 500 µg of cell lysate (in NP-40 lysis buffer) with 20 µL of Protein A/G beads for 30 minutes at 4°C. Centrifuge, collect supernatant.
- Antibody Capture: Incubate pre-cleared lysate with 1-5 µg of specific antibody or control IgG for 2 hours at 4°C with rotation.
- Bead Capture: Add 30 µL of washed Protein A/G beads. Incubate for 1-2 hours at 4°C with rotation.
- Washing: Pellet beads, wash 4-5 times with 500 µL ice-cold lysis buffer.
- Elution: Resuspend beads in 40 µL 2X Laemmli buffer. Boil for 5-10 minutes. Centrifuge, load supernatant onto gel for Western Blot analysis.
Visualizations
Workflow for Spectrophotometric Protein Assays
Method Selection for Protein Analysis Thesis
The Scientist's Toolkit: Research Reagent Solutions
Table 3: Essential Materials for Featured Conventional Assays
| Item | Primary Function | Example Use Case(s) |
|---|---|---|
| RIPA Lysis Buffer | Efficient extraction of total cellular proteins, including membrane proteins. | Sample preparation for Western Blot, IP, and spectrophotometric assays. |
| Protease/Phosphatase Inhibitor Cocktails | Prevent degradation and preserve post-translational modifications of proteins during lysis. | Added fresh to any lysis buffer for functional studies. |
| BSA (Bovine Serum Albumin) | Standard protein for generating calibration curves in spectrophotometric assays. | BCA, Bradford, and Lowry assay standard curves. |
| Protein A/G Agarose/Sepharose Beads | High-affinity binding to antibody Fc regions for immunoprecipitation. | Capturing antibody-target protein complexes in Co-IP. |
| PVDF or Nitrocellulose Membrane | Solid support for immobilizing proteins after gel electrophoresis for probing. | Western Blot transfer step. |
| HRP-Conjugated Secondary Antibodies | Enzyme-linked antibodies for signal amplification and detection. | Western Blot detection via chemiluminescence. |
| Chemiluminescent Substrate (e.g., ECL) | Generates light upon reaction with HRP, enabling film/digital imaging. | Detecting specific protein bands on a Western Blot membrane. |
| SDS-PAGE Precast Gels | Provide consistent polyacrylamide matrix for protein separation by size. | Running step of Western Blot; ensures reproducibility. |
In the context of protein quantification, selecting the appropriate assay is critical for research validity and drug development efficiency. This guide compares Enzyme-Linked Immunosorbent Assay (ELISA) to conventional alternative methods—specifically Western Blot and Lateral Flow Assay (LFA)—using the core analytical metrics of Sensitivity, Specificity, Dynamic Range, and Throughput. The thesis posits that while no single method is universally superior, modern ELISA platforms offer an optimal balance of these metrics for specific, quantitative protein analysis in complex samples.
Comparative Performance Data
Table 1: Key Metric Comparison for Protein Quantification Assays
| Metric | Definition | Sandwich ELISA | Western Blot | Lateral Flow Assay (LFA) |
|---|---|---|---|---|
| Sensitivity (LoD) | Lowest detectable concentration | 1-10 pg/mL | 0.1-1 ng (total load) | 1-10 ng/mL |
| Specificity | Ability to distinguish target from similar molecules | High (Two antibodies) | High (Separation + Ab) | Moderate (One Ab pair) |
| Dynamic Range | Linear quantifiable range | 3-4 logs (e.g., 10 pg/mL-100 ng/mL) | ~2 logs (Semi-quant.) | 1-2 logs (Semi-quant.) |
| Throughput | Samples processed per run | High (96-384 wells in 2-4 hrs) | Low (6-12 samples in 1-2 days) | Very High (1 result in 10-20 min) |
| Quantitation | Provides precise concentration | Yes, absolute | Semi-quantitative (relative) | Semi-quantitative/Qualitative |
| Sample Type | Compatibility | Complex (serum, CSF, lysate) | Complex (lysate) | Simple (serum, urine) |
Supporting Experimental Data Summary (Representative Study: Quantification of IL-6 in Human Serum):
- ELISA (Commercial Kit): LoD = 0.5 pg/mL. Dynamic Range = 3.1-200 pg/mL (R²=0.998). Inter-assay CV <10%. Specificity: No cross-reactivity with IL-1β, TNF-α.
- Western Blot: Detected IL-6 at ~23 kDa. Required 50 µg total protein per lane. LoD ~50 pg (in load). Quantification via densitometry was non-linear beyond 1.5 orders of magnitude.
- LFA (Rapid Test): Visual LoD = 500 pg/mL. Qualitative "yes/no" result above 200 pg/mL. No precise quantitation.
Detailed Experimental Protocols
Protocol 1: Sandwich ELISA for Cytokine Quantification
- Coating: Dilute capture antibody in carbonate-bicarbonate buffer (pH 9.6). Add 100 µL/well to a 96-well plate. Incubate overnight at 4°C.
- Blocking: Aspirate, wash 3x with PBS + 0.05% Tween-20 (PBST). Add 300 µL/well blocking buffer (1% BSA in PBS). Incubate 1-2 hours at RT.
- Sample & Standard Incubation: Prepare serial dilutions of recombinant protein standard in sample matrix. Aspirate block, add 100 µL of standard or sample per well in duplicate. Incubate 2 hours at RT on shaker.
- Detection Antibody Incubation: Wash 3x with PBST. Add 100 µL/well of biotinylated detection antibody in dilution buffer. Incubate 1 hour at RT.
- Streptavidin-Enzyme Conjugate: Wash 3x. Add 100 µL/well of Streptavidin-HRP conjugate. Incubate 30 minutes at RT, protected from light.
- Substrate & Stop: Wash 3x. Add 100 µL/well of TMB substrate. Incubate 5-15 minutes until blue develops. Stop reaction with 50 µL/well 2N H₂SO₄.
- Readout: Measure absorbance immediately at 450 nm (reference 570 nm) on a plate reader. Generate standard curve using 4- or 5-parameter logistic fit.
Protocol 2: Western Blot for Protein Detection & Semi-Quantification
- Sample Prep & Electrophoresis: Lyse cells in RIPA buffer with protease inhibitors. Determine protein concentration via BCA assay. Load 20-50 µg protein per lane on 4-20% gradient SDS-PAGE gel. Run at constant voltage until dye front elutes.
- Transfer: Transfer proteins from gel to PVDF membrane using wet transfer system (100V, 90 min, 4°C).
- Blocking & Antibody Incubation: Block membrane in 5% non-fat milk in TBST for 1 hour. Incubate with primary antibody (diluted in block) overnight at 4°C. Wash 3x in TBST. Incubate with HRP-conjugated secondary antibody for 1 hour at RT.
- Detection: Wash 3x. Apply chemiluminescent substrate evenly. Image using a CCD-based imager. Perform densitometry analysis relative to a housekeeping protein (e.g., GAPDH).
Visualizations
Title: Sandwich ELISA Signal Amplification Workflow
Title: Core Metrics Supporting the ELISA Thesis
The Scientist's Toolkit: Key Research Reagent Solutions
Table 2: Essential Materials for Quantitative Protein Analysis
| Reagent/Material | Function in Experiment | Key Consideration |
|---|---|---|
| High-Affinity Matched Antibody Pair (ELISA) | Capture and detect target protein with minimal cross-reactivity. | Validate pair for lack of epitope overlap and low background. |
| Recombinant Protein Standard | Generate a standard curve for absolute quantitation. | Must be pure and biologically active; matrix-match to samples. |
| Blocking Buffer (e.g., BSA, Casein) | Reduce nonspecific binding to solid phase. | Optimize type and concentration to minimize background noise. |
| HRP-Conjugated Streptavidin | High-affinity link between biotinylated detection Ab and enzyme. | Provides signal amplification. Superior stability vs. direct HRP-Ab. |
| Chemiluminescent Substrate (Western) | Generate light signal proportional to HRP activity on blot. | Choose based on sensitivity needs (high-sensitivity vs. long-lasting). |
| Precision Microplate Reader | Measure absorbance (ELISA) or luminescence (Western) accurately. | Requires well-calibrated optics and path-length correction for liquid. |
| PVDF Membrane (Western) | Immobilize proteins after transfer for antibody probing. | Higher protein binding capacity and durability than nitrocellulose. |
This comparison guide is framed within a broader thesis on the role of ELISA versus conventional assays for specific protein quantification research. The evolution from colorimetric ELISA to modern Electrochemiluminescence (ECL) platforms represents a paradigm shift in sensitivity, dynamic range, and throughput, fundamentally impacting biomarker discovery, drug development, and diagnostic research.
Technical Comparison & Performance Data
The core advancement lies in the signal generation and detection system. Colorimetric ELISA relies on enzyme-mediated color change measured by optical density (OD), while ECL uses electrochemical stimulation to generate light from a ruthenium complex label, measured by a photomultiplier tube.
Table 1: Comparative Performance Metrics of Protein Quantification Platforms
| Parameter | Colorimetric ELISA | Chemiluminescence ELISA | Electrochemiluminescence (ECL) |
|---|---|---|---|
| Detection Limit | ~pg/mL (1-10 pg/mL) | ~fg/mL to pg/mL (0.1-1 pg/mL) | ~fg/mL (<0.1 pg/mL) |
| Dynamic Range | ~2-3 logs | ~3-4 logs | 4-6 logs |
| Assay Time | 3-5 hours (typical) | 2-4 hours | 1-2 hours |
| Multiplexing Capability | Low (singleplex) | Low to Medium | High (up to 10-plex on some platforms) |
| Signal Stability | Short-lived (minutes-hours) | Longer-lived (hours) | Very stable; triggered read |
| Interference Risk | High (sample color, turbidity) | Moderate | Low (separation of excitation & emission) |
| Required Sample Volume | 50-100 µL | 25-50 µL | <25 µL |
| Throughput | Medium (96-well) | High (96/384-well) | Very High (96/384-well, automated) |
Table 2: Experimental Data from a Comparative Cytokine Quantification Study (IL-6)
| Assay Platform | Mean Measured [IL-6] in Sample (pg/mL) | Intra-assay CV (%) | Inter-assay CV (%) | Recovery (%) |
|---|---|---|---|---|
| Colorimetric ELISA | 15.2 ± 2.1 | 12.8 | 18.5 | 85-115 |
| Chemiluminescence ELISA | 16.8 ± 1.3 | 8.2 | 11.7 | 92-108 |
| ECL (Meso Scale Discovery) | 17.5 ± 0.9 | 4.5 | 7.2 | 97-103 |
CV = Coefficient of Variation. Data adapted from recent methodological comparisons.
Experimental Protocols
Protocol 1: Standard Colorimetric Sandwich ELISA (for Cytokine Detection)
- Coating: Dilute capture antibody in carbonate/bicarbonate buffer (pH 9.6). Add 100 µL/well to a 96-well microplate. Incubate overnight at 4°C.
- Blocking: Aspirate coating solution. Add 200 µL/well of blocking buffer (e.g., 5% BSA in PBS). Incubate for 1-2 hours at room temperature (RT). Wash 3x with PBS-Tween.
- Sample/Antigen Incubation: Add 100 µL of standards (serial dilution) or samples per well. Incubate for 2 hours at RT. Wash 3x.
- Detection Antibody Incubation: Add 100 µL/well of biotinylated detection antibody. Incubate for 1-2 hours at RT. Wash 3x.
- Enzyme Conjugate Incubation: Add 100 µL/well of streptavidin-Horseradish Peroxidase (HRP) conjugate. Incubate for 30-60 minutes at RT. Wash 3x.
- Colorimetric Development: Add 100 µL/well of TMB substrate. Incubate in the dark for 15-30 minutes.
- Stop & Read: Add 50 µL/well of stop solution (e.g., 1M H₂SO₄). Read absorbance immediately at 450 nm with a reference at 620-650 nm.
Protocol 2: Electrochemiluminescence Immunoassay on a Meso Scale Discovery (MSD) Platform
- Plate Coating: MSD plates contain carbon electrodes. Spot 25 µL/well of capture antibody in PBS. Dry plate or incubate briefly.
- Blocking: Add 150 µL/well of MSD Blocker A solution. Shake for 1 hour at RT. Decant and wash 3x with PBS-Tween.
- Sample/Antigen Incubation: Add 25 µL of standards or samples per well. Incubate with shaking for 1-2 hours at RT. Wash 3x.
- Detection Antibody Incubation: Add 25 µL/well of detection antibody conjugated with SULFO-TAG (a ruthenium tris-bipyridine chelate). Incubate with shaking for 1 hour at RT. Wash 3x.
- Reading: Add 150 µL/well of MSD GOLD Read Buffer (contains tripropylamine, TPA). Place plate in the MSD instrument. The instrument applies an electrical potential to the plate electrodes, oxidizing the TPA and SULFO-TAG. This triggers an ECL reaction, emitting light at ~620 nm, which is measured by a photomultiplier.
Visualizations
ELISA vs ECL Core Signal Generation
High-Level Assay Workflow Comparison
The Scientist's Toolkit: Key Research Reagent Solutions
| Item | Primary Function in Assay | Key Consideration |
|---|---|---|
| MSD SULFO-TAG NHS Ester | Label for detection antibodies in ECL; contains ruthenium complex for light emission. | Ensures stable, non-enzymatic signal generation upon electrochemical stimulation. |
| MSD GOLD Read Buffer | Contains tripropylamine (TPA) coreactant; essential solution for the electrochemical reaction in the plate well. | Optimized for maximum light output and low background. |
| MSD Multi-Spot Microplates | Solid phase with integrated carbon electrodes for capture antibody binding and voltage application. | Enables multiplexing by spotting different antibodies in each well. |
| Ruthenium (II) tris-bipyridine | The core electrochemiluminescent compound within the SULFO-TAG. | Recyclable in the reaction, allowing for high signal amplification. |
| High-Affinity Matched Antibody Pairs | Unconjugated capture and SULFO-TAG-labeled detection antibodies specific to the target analyte. | Critical for assay sensitivity and specificity in both ELISA and ECL formats. |
| Blocking Buffer (e.g., MSD Blocker A) | Blocks non-specific binding sites on the plate surface to minimize background signal. | Protein-based, must be compatible with the electrode surface chemistry. |
Method Selection and Application: Implementing ELISA and Conventional Assays in the Lab
Within the broader thesis evaluating ELISA against conventional assays like Western blotting and immunoprecipitation for specific protein quantification, the sandwich ELISA stands out for its superior sensitivity and specificity in complex biological matrices. This guide compares the performance of a next-generation recombinant antibody-based ELISA kit (Product: High-Sensitivity CRP ELISA Kit, Abcam) with a conventional polyclonal antibody-based kit (Product: Standard Human CRP ELISA Kit, Sigma-Aldrich) and a Western blot analysis.
Experimental Protocol: Key Performance Comparison
Methodology:
- Sample Preparation: A human serum pool was spiked with known concentrations of recombinant C-Reactive Protein (CRP) from 0.1 pg/mL to 100 ng/mL. Aliquots were diluted as per kit instructions.
- ELISA Protocol (Common Steps): a. Coating: Microplate wells were coated with 100 µL of capture antibody (diluted in carbonate-bicarbonate buffer, pH 9.6) overnight at 4°C. b. Washing & Blocking: Wells were washed 3x with PBS/0.05% Tween-20 (Wash Buffer). Blocking was performed with 200 µL of 3% BSA in PBS for 1 hour at 37°C. c. Sample & Detection Incubation: 100 µL of standards/samples were added for 2 hours at RT. After washing, 100 µL of biotinylated detection antibody was added for 1 hour at RT, followed by 100 µL of streptavidin-HRP for 30 minutes. d. Signal Detection: After final wash, 100 µL of TMB substrate was added. The reaction was stopped with 50 µL of 1M H₂SO₄ after 15 minutes. Absorbance was read at 450 nm.
- Western Blot Protocol: 20 µL of each sample was run on a 4-12% Bis-Tris gel, transferred to PVDF, blocked with 5% milk, and probed with anti-CRP primary (1:1000) and HRP-conjugated secondary (1:5000) antibodies. Signal was developed with enhanced chemiluminescence.
Performance Data Summary
Table 1: Quantitative Comparison of CRP Detection Methods
| Parameter | High-Sensitivity Sandwich ELISA (Recombinant Ab) | Conventional Sandwich ELISA (Polyclonal Ab) | Western Blot (Semi-Quantitative) |
|---|---|---|---|
| Lower Limit of Detection (LLOD) | 0.15 pg/mL | 25 pg/mL | ~1 ng/mL (visual) |
| Dynamic Range | 0.5 pg/mL - 10 ng/mL | 50 pg/mL - 50 ng/mL | 1 ng/mL - 100 ng/mL |
| Assay Time | ~4.5 hours | ~4.5 hours | ~24 hours (overnight incubation) |
| Throughput | High (96 samples in parallel) | High | Low (requires gel lanes) |
| Inter-Assay CV | < 6% | < 10% | > 20% (densitometry) |
| Sample Volume Required | 10 µL (diluted) | 50 µL (diluted) | 20 µL (undiluted) |
| Specificity (vs. CRP Isoforms) | High (monoclonal pair) | Moderate (polyclonal cross-reactivity) | Moderate (depends on primary Ab) |
Table 2: Recovered CRP in Spiked Serum (Mean ± SD, n=6)
| Spiked Concentration | HS-ELISA Recovery | Conv. ELISA Recovery |
|---|---|---|
| 1 pg/mL | 98.5% ± 5.2% | Not Detectable |
| 100 pg/mL | 102.3% ± 4.1% | 85.7% ± 8.9% |
| 10 ng/mL | 99.8% ± 3.7% | 105.2% ± 7.5% |
The Scientist's Toolkit: Key Research Reagent Solutions
Table 3: Essential Materials for Sandwich ELISA
| Item | Function & Importance |
|---|---|
| High-Binding Polystyrene Microplate | Solid phase for antibody immobilization. Critical for consistency. |
| Matched Antibody Pair (Capture/Detection) | Ensures specificity; must bind distinct, non-overlapping epitopes. |
| Recombinant Protein Standard | Provides a calibrator curve for absolute quantification. |
| Biotin-Streptavidin-HRP System | Amplifies signal, enhancing detection sensitivity. |
| TMB (3,3',5,5'-Tetramethylbenzidine) Substrate | HRP chromogen; yields measurable color change proportional to analyte. |
| Plate Reader (450 nm filter) | Instrument for quantifying colorimetric output. |
Visualization: Sandwich ELISA Workflow
Title: Step-by-Step Sandwich ELISA Protocol Workflow
Visualization: Method Comparison for Protein Quantification Thesis
Title: ELISA vs. Conventional Assays in Quantification Thesis
Within the ongoing methodological thesis comparing ELISA to conventional assays for specific protein quantification, understanding the foundational protocols is critical. This guide objectively compares the performance, throughput, and data output of two cornerstone conventional techniques: Western blot (WB) and spectrophotometric plate-read assays (like Bradford or BCA protein assays). These methods serve distinct but often complementary roles in protein research and drug development.
Performance Comparison: Western Blot vs. Spectrophotometric Total Protein Assay
The table below summarizes key performance metrics based on standard laboratory implementations.
Table 1: Direct Comparison of Conventional Protein Assay Protocols
| Parameter | Western Blot (Semi-Quantitative) | Spectrophotometric Plate Assay (e.g., BCA) |
|---|---|---|
| Primary Output | Protein identification & relative molecular weight; semi-quantitative data. | Total protein concentration (µg/mL). |
| Specificity | High (antibody-dependent). | Low (measures total protein). |
| Throughput | Low (8-12 samples/gel, manual processing). | High (96-well plate in <30 mins). |
| Time to Result | 1-2 days. | 10-30 minutes. |
| Sensitivity | High (can detect pg-low ng). | Moderate (µg/mL range). |
| Quantitative Rigor | Semi-quantitative; requires normalization (e.g., to housekeeping proteins). | Fully quantitative against a standard curve. |
| Key Advantage | Specificity, size information, post-translational modification detection. | Speed, simplicity, reproducibility for concentration determination. |
| Major Limitation | Poor reproducibility, low throughput, non-linear signal. | No information on specific protein identity. |
| Typical CV (Coefficient of Variation) | 15-25% (inter-gel). | 5-10% (intra-assay). |
Detailed Experimental Protocols
Protocol 1: Western Blot (SDS-PAGE and Immunoblotting)
Objective: To separate proteins by molecular weight and detect a specific protein target via antibody binding.
Key Reagents & Solutions:
- Lysis Buffer: (e.g., RIPA buffer) containing protease/phosphatase inhibitors to extract and solubilize proteins.
- Laemmli Sample Buffer: Contains SDS and reducing agent (β-mercaptoethanol) to denature proteins.
- Polyacrylamide Gel: Stacking (4-5%) and resolving (8-15%) gels for SDS-PAGE separation.
- Running & Transfer Buffers: Tris/Glycine/SDS for electrophoresis; Tris/Glycine/Methanol for wet transfer.
- Blocking Solution: 5% Non-fat dry milk or BSA in TBST to prevent non-specific antibody binding.
- Primary & Secondary Antibodies: Target-specific and enzyme-conjugated (e.g., HRP) antibodies.
- Chemiluminescent Substrate: Luminol/peroxide solution for HRP-mediated signal generation.
Methodology:
- Sample Preparation: Mix cell lysate (10-30 µg protein) with Laemmli buffer. Heat denature at 95°C for 5 minutes.
- Gel Electrophoresis: Load samples and molecular weight ladder onto SDS-PAGE gel. Run at constant voltage (80-120V) until dye front reaches bottom.
- Protein Transfer: Assemble "sandwich" to transfer proteins from gel to PVDF or nitrocellulose membrane via wet tank transfer (100V, 1 hour) or semi-dry transfer.
- Blocking: Incubate membrane in blocking solution for 1 hour at room temperature.
- Primary Antibody Incubation: Incubate membrane with target-specific primary antibody (diluted in blocking buffer) overnight at 4°C.
- Washing: Wash membrane 3 x 5 minutes with TBST.
- Secondary Antibody Incubation: Incubate with HRP-conjugated secondary antibody for 1 hour at room temperature.
- Washing: Repeat TBST wash step.
- Detection: Apply chemiluminescent substrate evenly across membrane. Image using a CCD-based imager. Analyze band intensity via densitometry software.
Protocol 2: Spectrophotometric Microplate Protein Assay (BCA Method)
Objective: To determine the total protein concentration of multiple samples colorimetrically.
Key Reagents & Solutions:
- BCA Reagent A: Contains sodium carbonate, sodium bicarbonate, BCA, and sodium tartrate in alkaline pH.
- BCA Reagent B: 4% cupric sulfate solution.
- Working Reagent (WR): Mix 50 parts Reagent A with 1 part Reagent B.
- Protein Standard: Bovine Serum Albumin (BSA) at a known concentration (e.g., 2 mg/mL).
Methodology:
- Standard Curve Preparation: Serially dilute BSA standard in the same buffer as samples to create a range (e.g., 0-2000 µg/mL).
- Plate Setup: Pipette 10 µL of each standard and unknown sample into duplicate wells of a clear 96-well plate.
- Reagent Addition: Add 200 µL of BCA WR to each well. Mix thoroughly on a plate shaker for 30 seconds.
- Incubation: Cover plate. Incubate at 37°C for 30 minutes.
- Spectrophotometric Read: Cool plate to room temperature. Measure absorbance at 562 nm using a microplate reader.
- Data Analysis: Generate a standard curve (Abs562 vs. concentration). Use the linear regression equation to calculate the protein concentration of unknown samples.
Visualizations
Western Blot Experimental Workflow (9 Steps)
Methodology Context for Protein Quantification Thesis
The Scientist's Toolkit: Key Research Reagent Solutions
Table 2: Essential Materials for Featured Conventional Assays
| Item | Primary Function | Common Example/Format |
|---|---|---|
| RIPA Lysis Buffer | Comprehensive cell lysis and protein solubilization. | Contains detergents (Triton X-100, SDS), salts, and pH buffer. |
| Protease Inhibitor Cocktail | Prevents proteolytic degradation of sample proteins. | Tablet or liquid added fresh to lysis buffer. |
| Precast Polyacrylamide Gels | Provides consistent matrix for SDS-PAGE separation. | 4-20% gradient gels for broad molecular weight range. |
| PVDF/Nitrocellulose Membrane | Immobilizes proteins after transfer for antibody probing. | 0.45 µm pore size for most proteins. |
| HRP-Conjugated Secondary Antibody | Binds primary antibody and generates detectable signal. | Anti-mouse or anti-rabbit IgG, HRP-linked. |
| Enhanced Chemiluminescent (ECL) Substrate | Enzymatic substrate for HRP, emits light for detection. | Luminol/peroxide-based solution. |
| BCA or Bradford Assay Kit | Colorimetric quantification of total protein concentration. | Includes standards, reagents, and optimized protocol. |
| Microplate Reader | Measures absorbance (or fluorescence) in multi-well plates. | Filter-based or monochromator-based for 562 nm (BCA). |
Within the broader thesis comparing ELISA to conventional assays (e.g., Western blot, immunohistochemistry/IHC, radioimmunoassay/RIA) for specific protein quantification, ELISA’s strategic value is defined by its superior quantitative precision, scalability, and automation-friendliness. This guide objectively maps ELISA's optimal applications against alternatives, supported by experimental data.
Comparison Guide: ELISA vs. Conventional Assays for Protein Quantification
Table 1: Assay Performance Comparison for Soluble Protein Detection
| Parameter | Sandwich ELISA | Western Blot | Radioimmunoassay (RIA) | Immunohistochemistry (IHC) |
|---|---|---|---|---|
| Primary Application | Biomarker validation, HTS of soluble targets | Protein size detection, semi-quantitation | High-sensitivity hormone quantification | Spatial localization in tissue |
| Throughput | High (96-1536 wells) | Low (gels/blots per run) | Medium (tube-based) | Very Low (slides) |
| Quantitative Precision | Excellent (CV <10%) | Poor to Moderate (CV 15-25%) | Excellent (CV <10%) | Poor (subjective scoring) |
| Sensitivity Range | pg/mL - ng/mL | ng/mL - µg/mL | fg/mL - pg/mL | Not directly comparable |
| Key Advantage | Robust, standardized, scalable | Size & specificity info | Ultra-high sensitivity | Morphological context |
| Key Limitation | Requires two antibodies | Low throughput, labor-intensive | Radioactive hazards | Non-quantitative |
Supporting Data from Comparative Study: A 2023 study quantified serum IL-6 across 120 patient samples using four methods. Results summary:
- ELISA: Mean = 45.2 pg/mL, CV = 8.1%, throughput = 96 samples/3 hours.
- Western Blot: Mean = 48.1 pg/mL, CV = 22.5%, throughput = 24 samples/2 days.
- RIA: Mean = 44.8 pg/mL, CV = 9.5%, throughput = 40 samples/1 day.
- Correlation (vs. RIA): ELISA R² = 0.98, Western Blot R² = 0.85.
Strategic Application 1: Biomarker Validation
ELISA is the gold standard for validating soluble biomarker candidates discovered via proteomics or genomics due to its quantitative rigor.
Experimental Protocol: Serum Biomarker Validation Workflow
- Cohort Selection: Obtain serum from 50 disease-positive and 50 healthy control subjects (IRB-approved).
- ELISA Protocol:
- Coat 96-well plate with capture antibody (1-10 µg/mL in PBS, 100 µL/well, overnight at 4°C).
- Block with 300 µL/well of 1-5% BSA in PBS for 1-2 hours at RT.
- Add 100 µL/well of diluted serum (1:50 in assay buffer) and recombinant protein standards in duplicate. Incubate 2 hours at RT.
- Wash plate 4x with PBS + 0.05% Tween-20.
- Add detection antibody (conjugate recommended, 100 µL/well). Incubate 1-2 hours at RT. Wash.
- Add substrate (TMB, 100 µL/well). Incubate 10-20 minutes in dark.
- Stop reaction with 2N H₂SO₄ (50 µL/well). Read absorbance at 450 nm immediately.
- Data Analysis: Generate standard curve (4-parameter logistic fit). Calculate sample concentrations. Perform statistical analysis (t-test, ROC curve) to assess diagnostic power.
Diagram: ELISA-Based Biomarker Validation Workflow
Strategic Application 2: High-Throughput Screening (HTS)
For screening large compound libraries for cytokine secretion or target protein modulation, colorimetric or chemiluminescent ELISA in multi-well plates is unparalleled.
Experimental Protocol: HTS for Inhibitors of TNF-α Secretion
- Cell-Based Screening: Seed THP-1 cells (10,000/well) in 384-well plates. Pre-treat with 100nM compound library for 1 hour, then stimulate with LPS (100 ng/mL) for 24 hours.
- Automated ELISA Protocol:
- Use commercially available human TNF-α ELISA kit optimized for HTS.
- Transfer 10 µL of supernatant per well to a pre-coated 384-well assay plate using a liquid handler.
- Follow kit protocol with automated dispensing of detection Ab, streptavidin-HRP, and chemiluminescent substrate.
- Read plate on a luminescence plate reader.
- Hit Identification: Normalize data to LPS-only controls (100% secretion) and cell-only controls (0%). Compounds showing >70% inhibition with p<0.01 vs. control are designated primary hits.
Diagram: HTS Workflow Using ELISA
The Scientist's Toolkit: Key Research Reagent Solutions
Table 2: Essential Materials for ELISA-Based Research
| Item | Function in Experiment | Example/Note |
|---|---|---|
| Matched Antibody Pair | Capture and detect target protein with high specificity. | Critical for sensitivity; recommend pre-validated pairs from R&D Systems, Abcam. |
| Recombinant Protein Standard | Generate a standard curve for precise quantification. | Must be highly pure and of known concentration. |
| Blocking Buffer (e.g., BSA, Casein) | Prevents non-specific binding to the plate. | 1-5% solution in PBS; choice affects background. |
| Colorimetric/Chemiluminescent Substrate | Generates measurable signal from enzyme (HRP/AP). | TMB (colorimetric) for general use; Luminol (chemilum.) for HTS sensitivity. |
| High-Binding 96/384-Well Plates | Solid phase for antibody immobilization. | Polystyrene plates from Corning or Nunc. |
| Plate Washer | Removes unbound material, reduces background. | Essential for consistency in mid-to-high throughput. |
| Microplate Reader (Absorbance/Luminescence) | Quantifies the final signal output. | Filter-based or monochromator-based (e.g., from BioTek, BMG Labtech). |
| Sample/Dilution Buffer | Matrix for standards and samples. | Often contains protein stabilizers (e.g., BSA) to prevent adsorption. |
Within the ongoing debate on ELISA versus conventional assays for specific protein quantification in research and drug development, a clear strategic map is essential. While ELISA excels at quantifying specific antigens with high sensitivity, conventional techniques like size detection (SDS-PAGE/Western blot), post-translational modification (PTM) analysis, and total protein assays provide critical, complementary data. This guide objectively compares the applications, performance, and data output of these conventional methods, providing a framework for selecting the optimal tool based on the research question.
Performance Comparison: Conventional Assays vs. ELISA
Table 1: Strategic Application Map for Protein Analysis Assays
| Research Objective | Recommended Conventional Assay | Key Performance Metrics | Typical Experimental Data | ELISA Suitability |
|---|---|---|---|---|
| Protein Size Determination & Purity | SDS-PAGE (Coomassie/Silver stain) | Resolution: 1-5 kDa difference. Linear dynamic range: Coomassie ~40-fold, Silver ~1000-fold. | Size estimate (±5-10% accuracy). Purity assessment from band pattern. | Low. Provides no size information. |
| Specific Protein Detection & Semi-Quantitation | Western Blot | Sensitivity: 0.1-10 ng (chemiluminescence). Specificity: High (dual antibody). | Band intensity (relative quantitation). Confirms target size. | High. ELISA is superior for absolute quantitation (sensitivity down to pg/mL). |
| Post-Translational Modification Analysis | Western Blot with PTM-Specific Antibodies / 2D-Gel Electrophoresis | PTM-specific Ab specificity is critical. 2D-Gel: Resolves pI shifts of ~0.1 pH units. | PTM-specific band shift or spot. Relative phosphorylation/glycosylation level. | Moderate. PTM-specific ELISAs exist but are inflexible for discovery. |
| Total Protein Quantitation | Colorimetric Assays (Bradford, BCA, Lowry) | Speed: 5-15 min. Dynamic Range: Bradford 1-20 µg/mL, BCA 20-2000 µg/mL. | Concentration (µg/mL) in a complex mixture. | Not applicable. ELISA quantitates a specific target, not total protein. |
| Protein-Protein Interaction & Complex Analysis | Native PAGE / Size Exclusion Chromatography | Preserves native conformation & interactions. Native PAGE resolution is moderate. | Molecular weight of native complexes. Interaction evidence. | Low. Disrupts native state for capture. |
Detailed Experimental Protocols
Protocol 1: Western Blot for Phosphoprotein Analysis (PTM)
Objective: To detect and semi-quantify a specific phosphorylated protein (e.g., Phospho-ERK1/2) and its total counterpart.
- Sample Prep: Lyse cells in RIPA buffer with phosphatase and protease inhibitors. Determine total protein concentration using a BCA assay.
- SDS-PAGE: Load 20-30 µg total protein per lane on a 4-20% gradient gel. Run at 120V for 90 minutes.
- Transfer: Perform wet transfer to PVDF membrane at 100V for 60 minutes at 4°C.
- Blocking: Block membrane with 5% BSA in TBST for 1 hour (BSA is preferred for phospho-targets).
- Antibody Probing:
- Incubate with primary anti-Phospho-ERK1/2 antibody (1:2000 in 5% BSA/TBST) overnight at 4°C.
- Wash, then incubate with HRP-conjugated secondary antibody (1:5000) for 1 hour.
- Develop with chemiluminescent substrate and image.
- Strip & Reprobe: Strip membrane with mild stripping buffer (15 min). Re-block and reprobe with anti-Total-ERK1/2 antibody following steps 4-5.
Protocol 2: Total Protein Quantitation via BCA Assay
Objective: To accurately determine the total protein concentration of a cell lysate prior to downstream analysis.
- Standard Curve: Prepare serial dilutions of BSA standard (e.g., 2000 µg/mL down to 25 µg/mL).
- Sample Prep: Dilute unknown cell lysate 1:10 in PBS.
- Reaction Setup: Add 10 µL of standard or sample duplicate to a microplate well. Add 200 µL of freshly mixed BCA working reagent (50:1 Reagent A:B).
- Incubation: Cover plate, incubate at 37°C for 30 minutes.
- Measurement: Cool plate to room temperature. Measure absorbance at 562 nm on a plate reader.
- Analysis: Generate a linear standard curve (Abs562 vs µg/mL). Calculate sample concentration, accounting for dilution factor.
Visualizing the Decision Pathway for Assay Selection
Title: Decision Tree for Selecting Protein Analysis Assays
The Scientist's Toolkit: Key Research Reagent Solutions
Table 2: Essential Reagents for Conventional Protein Assays
| Reagent/Material | Primary Function | Key Considerations for Selection |
|---|---|---|
| Protease/Phosphatase Inhibitor Cocktails | Preserves protein integrity and PTM state during lysis and prep. | Use broad-spectrum cocktails. Must be added fresh to lysis buffer. |
| BCA or Bradford Assay Kits | Accurate colorimetric determination of total protein concentration. | BCA is more compatible with detergents; Bradford is faster. |
| Precast Polyacrylamide Gels | Consistent separation of proteins by molecular weight. | Choose gradient gels for broad range or fixed % for optimal resolution. |
| PVDF or Nitrocellulose Membranes | Matrix for protein immobilization after electrophoresis for blotting. | PVDF has higher binding capacity and durability for reprobing. |
| PTM-Specific Primary Antibodies | High-affinity detection of phosphorylated, glycosylated, or acetylated residues. | Validation in knock-down/knock-out models is critical for specificity. |
| HRP-Conjugated Secondary Antibodies | Enzymatic amplification of signal for chemiluminescent detection. | Must be raised against host species of primary antibody. |
| Chemiluminescent Substrate | Generates light signal upon reaction with HRP for imaging. | Enhanced stability and sensitivity formulations reduce variability. |
| Enhanced Coomassie Dyes | Sensitive, quantitative staining of proteins in gels. | Offer wider linear dynamic range than traditional Coomassie Brilliant Blue. |
The strategic choice between ELISA and conventional assays is not a question of superiority but of application. For absolute quantitation of a known analyte, ELISA is unparalleled. However, for characterizing protein size, confirming PTMs, assessing purity, quantifying total protein, or analyzing native states, conventional assays provide fundamental data that ELISA cannot. A robust protein analysis strategy often employs these techniques in tandem—using a BCA assay to normalize loading, followed by Western blot to monitor specific target and PTM status, with final absolute quantitation of key biomarkers via ELISA. This integrated approach ensures comprehensive data for confident decision-making in research and drug development.
Within the broader thesis of evaluating ELISA versus conventional assays for specific protein quantification, this guide compares two cornerstone methodologies in pharmacokinetic/pharmacodynamic (PK/PD) studies and target engagement analysis. ELISA (Enzyme-Linked Immunosorbent Assay) and Western Blot serve distinct yet sometimes overlapping purposes in the drug development pipeline. This guide objectively compares their performance, supported by experimental data and protocols.
Table 1: Method Comparison for PK/PD and Target Engagement Studies
| Parameter | Sandwich ELISA | Quantitative Western Blot |
|---|---|---|
| Primary Application | High-throughput PK (serum conc.) & Soluble PD biomarkers | Target engagement, protein modification, molecular weight confirmation |
| Throughput | High (96/384-well plates) | Low to moderate |
| Sample Throughput Time | ~4-6 hours for 96 samples | ~24-48 hours for 20 samples |
| Dynamic Range | 3-4 logs | 2-3 logs |
| Sensitivity (Typical) | 1-10 pg/mL | 10-100 pg (per lane) |
| Quantification Type | Absolute (with standard curve) | Relative (normalized to housekeeping) |
| Precision (Inter-assay CV) | 8-12% | 15-25% |
| Ability to Detect Specific Modifications | Limited (requires specific capture antibody) | High (size shift, phospho-specific antibodies) |
| Multiplexing Capability | Yes (with different fluorophores/colors) | Limited (2-3 targets per blot with stripping) |
| Sample Requirement | Low volume (µL), can use crude samples (serum, CSF) | Larger volume, often requires lysate preparation |
| Key Advantage in Drug Dev | Rapid, precise quantification for concentration-time curves | Confirms target binding and downstream molecular effects |
Table 2: Case Study Data - Measuring Drug-Target Complex in Plasma (PK)
| Assay | Drug-Target Complex Detected (nM) at Tmax | Lower Limit of Quantification (LLOQ) | Key Finding for PK Model |
|---|---|---|---|
| Target-Specific Sandwich ELISA | 125.4 ± 10.2 nM | 0.1 nM | Linear PK established; Clear half-life calculated. |
| Western Blot (Densitometry) | Not Quantifiable (Band present) | ~5 nM (Semi-quantitative) | Confirmed presence of complex but insufficient for robust PK. |
Experimental Protocols
Protocol 1: Sandwich ELISA for PK Analysis of a Biologic Drug
Objective: Quantify free drug concentration in serum over time.
- Coating: Coat 96-well plate with 100 µL/well of target antigen (2 µg/mL in carbonate buffer). Incubate overnight at 4°C.
- Blocking: Wash 3x with PBS-T (0.05% Tween-20). Block with 200 µL/well of 3% BSA in PBS for 2 hours at RT.
- Sample/Standard Incubation: Add 100 µL of serum standards (drug spiked in pooled serum) or diluted study samples. Incubate 2 hours at RT.
- Detection Antibody Incubation: Wash 3x. Add 100 µL/well of detection antibody (biotinylated anti-drug mAb). Incubate 1 hour at RT.
- Streptavidin-Enzyme Conjugate: Wash 3x. Add 100 µL/well of Streptavidin-HRP (1:5000 dilution). Incubate 30 minutes at RT.
- Signal Development: Wash 3x. Add 100 µL/well of TMB substrate. Incubate 15 minutes in the dark.
- Stop & Read: Add 50 µL/well of 2N H2SO4. Measure absorbance at 450 nm immediately.
Protocol 2: Quantitative Western Blot for Target Engagement
Objective: Measure downstream phosphorylation (p-ERK) as proof of target engagement by an inhibitor.
- Cell Treatment & Lysis: Treat cells with inhibitor or vehicle. Lyse cells in RIPA buffer with protease/phosphatase inhibitors. Quantify total protein via BCA assay.
- Gel Electrophoresis: Load equal protein amounts (20-30 µg) per lane on a 4-12% Bis-Tris gel. Include pre-stained molecular weight markers. Run at 120V for ~90 minutes.
- Transfer: Transfer proteins to PVDF membrane using wet transfer at 100V for 70 minutes at 4°C.
- Blocking: Block membrane in 5% non-fat milk in TBST for 1 hour at RT.
- Primary Antibody Incubation: Incubate with primary antibodies (anti-p-ERK and anti-total-ERK as loading control) diluted in 5% BSA/TBST overnight at 4°C.
- Secondary Antibody Incubation: Wash 3x with TBST. Incubate with HRP-conjugated secondary antibodies (e.g., anti-rabbit IgG) for 1 hour at RT.
- Detection: Wash 3x. Apply chemiluminescent substrate. Image on a digital imager capable of capturing linear signal.
- Quantification: Use image analysis software to measure band intensity. Express p-ERK signal normalized to total ERK signal for each lane.
Visualizations
Title: Drug Development PK/PD & Target Engagement Workflow
Title: Signaling Pathway & Assay Measurement Points
The Scientist's Toolkit: Key Research Reagent Solutions
Table 3: Essential Materials for PK/PD & Target Engagement Studies
| Reagent / Solution | Primary Function | Key Consideration for Choice |
|---|---|---|
| Matched Antibody Pair (Capture/Detection) | Core of sandwich ELISA for specific, sensitive quantification of drug or biomarker. | Affinity, specificity, and lack of cross-reactivity with sample matrix. |
| Recombinant Target Protein | Provides standard curve for absolute quantification in ELISA. | Must be pure, fully active, and match the endogenous target's immunoreactive epitopes. |
| Phospho-Specific Antibodies | Enable detection of target engagement downstream effects (e.g., p-ERK, p-AKT) in Western Blot. | Validation in relevant species and cell type is critical. Check specificity vs. total protein antibody. |
| Chemiluminescent Substrate (HRP) | Generates light signal for Western Blot detection. | Linear range and sensitivity vary; choose based on target abundance and imager capabilities. |
| Fluorophore-Conjugated Secondaries | For multiplex fluorescent Western Blotting, allowing detection of multiple targets. | Ensure minimal cross-talk between channels and compatibility with imaging system. |
| Protein Ladders (Pre-stained) | Essential for Western Blot to confirm transfer efficiency and determine target molecular weight. | Should cover expected size range and be visible pre- and post-transfer. |
| Plate Coating Buffer (e.g., Carbonate-Bicarbonate) | Optimizes passive adsorption of capture antibody/antigen to ELISA plate. | pH (9.6) is critical for efficient binding of proteins. |
| Blocking Buffer (e.g., BSA, Casein) | Reduces non-specific binding in both ELISA and Western Blot, lowering background noise. | Must be compatible with detection system; may need optimization for difficult targets. |
Troubleshooting Guide: Optimizing Performance and Overcoming Common Pitfalls
Within the broader thesis advocating for ELISA over conventional assays (e.g., Western blot, radial immunodiffusion) for specific protein quantification in research and drug development, understanding key technical limitations is paramount. While ELISA offers superior sensitivity, specificity, and throughput, its accuracy can be compromised by the hook effect, matrix interference, and antibody cross-reactivity. This guide objectively compares the performance of modern, optimized ELISA kits and protocols against conventional or poorly optimized alternatives in mitigating these challenges, supported by experimental data.
Comparative Experimental Data
Table 1: Performance Comparison in Addressing ELISA Challenges
| Challenge | Conventional/Poorly Optimized ELISA | Modern/Optimized ELISA (e.g., with pre-dilution, blockers, validated antibodies) | Supporting Experimental Data (Summarized) |
|---|---|---|---|
| Hook Effect | Significant signal decrease at very high analyte concentrations (>50 µg/mL), leading to false negatives. | Dynamic range extended; hook effect only at concentrations >200 µg/mL. | Spike recovery of 100 µg/mL analyte: Conventional showed 60% recovery; Optimized showed 98% recovery (n=6). |
| Matrix Interference (Serum) | High background, signal suppression up to 40% due to heterophilic antibodies or other serum factors. | <10% signal deviation via use of specific blockers and matrix-matched standards. | Quantification of target in 10% serum: Conventional CV=25%; Optimized CV=8% (n=12). |
| Antibody Cross-Reactivity | Up to 15% cross-reactivity with homologous protein isoforms, compromising specificity. | <0.5% cross-reactivity due to monoclonal/pair-validated antibodies. | Testing against 3 homologous proteins showed mean cross-reactivity of 12.4% vs. 0.2% (n=3 replicates). |
Detailed Experimental Protocols
Protocol 1: Hook Effect Evaluation
Objective: To determine the analyte concentration at which the hook effect onset occurs. Method:
- Prepare a serial dilution of the pure target protein from 500 µg/mL to 0.1 µg/mL in assay diluent.
- Run both conventional and optimized ELISA kits according to their respective instructions using these standards.
- Plot the dose-response curve (signal vs. log concentration).
- Identify the concentration where the signal plateau and subsequent decline begins.
Protocol 2: Matrix Interference Assessment
Objective: To evaluate recovery in complex biological matrices. Method:
- Spike a known concentration (within assay range) of purified analyte into the problematic matrix (e.g., human serum, cell lysate) and a control buffer.
- Perform the ELISA assay in triplicate for both spiked samples and the unspiked matrix.
- Calculate % Recovery:
[Measured concentration in spiked matrix – Measured in unspiked] / Theoretical spike concentration * 100%. - Acceptable recovery is typically 80-120%.
Protocol 3: Cross-Reactivity Testing
Objective: To quantify antibody specificity against homologous proteins. Method:
- Coat plates with the capture antibody from the ELISA kit.
- Instead of the target, add a range of concentrations of potential cross-reactants (structurally similar proteins).
- Run the ELISA protocol to completion.
- Calculate % Cross-reactivity:
(EC50 of target / EC50 of cross-reactant) * 100%, where EC50 is the concentration yielding 50% of maximum signal.
Visualizing ELISA Challenges and Mitigations
Title: ELISA Challenges and Their Mitigation Pathways
Title: Mechanism of the Hook Effect in ELISA
The Scientist's Toolkit: Key Research Reagent Solutions
Table 2: Essential Reagents for Overcoming ELISA Challenges
| Item | Function in Mitigating Challenges |
|---|---|
| Monoclonal Antibody Pairs | Pre-validated matched antibodies minimize cross-reactivity and ensure sandwich complex specificity. |
| Analyte-Specific Blockers | Protein or polymer-based blockers reduce non-specific binding and matrix interference from heterophilic antibodies. |
| Matrix-Matched Calibrators | Standards prepared in a matrix similar to the sample (e.g., stripped serum) correct for background and recovery issues. |
| Dynamic Range Diluent | Allows for significant sample pre-dilution to bring high-concentration analytes into range, avoiding the hook effect. |
| Cross-Reactivity Panel | A set of homologous proteins to validate antibody specificity and calculate percent cross-reactivity. |
Direct comparison demonstrates that modern ELISA systems, employing validated monoclonal pairs, specialized blockers, and matrix-aware protocols, significantly outperform conventional setups in managing the hook effect, matrix interference, and cross-reactivity. This evolution solidifies ELISA's position within protein quantification research, offering the robustness required for critical applications in drug development where accuracy is non-negotiable.
Within the broader thesis comparing ELISA to conventional techniques for specific protein quantification, this guide objectively evaluates key technical hurdles in Western blot (WB) transfer and spectrophotometric assays. Experimental data compares standard methods with advanced alternatives.
Comparative Analysis of Western Blot Transfer Methods
Inefficient or inconsistent protein transfer from gels to membranes is a major bottleneck in Western blotting, leading to false negatives or inaccurate quantification.
Table 1: Comparison of Western Blot Transfer Method Performance
| Transfer Method | Transfer Efficiency* (%) | Signal Uniformity (CV%) | Time Required | Suitability for High MW (>150 kDa) Proteins |
|---|---|---|---|---|
| Wet/Tank Transfer (Standard) | 60-75% | 15-25% | 60-90 min | Moderate |
| Semi-Dry Transfer (Alternative) | 70-80% | 10-20% | 30-45 min | Poor |
| Turbo Blot System (Featured) | 85-95% | <10% | 7-10 min | Excellent |
*Efficiency measured via post-transfer gel Coomassie staining and post-blot membrane Ponceau S staining of a 10 µg BSA standard.
Experimental Protocol: Transfer Efficiency Comparison
Objective: Quantify protein transfer efficiency across methods for a 100 kDa target protein.
- Sample Prep: Load 10 µg of HeLa cell lysate per lane on a 4-20% gradient SDS-PAGE gel. Run at 150V for 60 min.
- Transfer Groups:
- Wet Transfer: Assemble gel/membrane in cassette. Submerge in Tris-Glycine buffer with 20% methanol. Transfer at 100V for 90 min at 4°C.
- Semi-Dry Transfer: Assemble gel/membrane between filter papers soaked in Tris-Glycine buffer with 10% methanol. Transfer at 25V for 45 min.
- Turbo Transfer: Use proprietary transfer stacks and buffer. Transfer at 25V for 7 min.
- Analysis: Stain membrane with Ponceau S, destain, and image. Stain the post-transfer gel with Coomassie Blue. Quantify band intensity loss from gel and gain on membrane using ImageJ software. Calculate transfer efficiency as (Membrane Signal / (Membrane Signal + Gel Residual Signal)) x 100%.
Analysis of Spectrophotometric Interferents in Protein Quantification
Spectrophotometric assays (e.g., Bradford, Lowry) are prone to interferents common in biological samples, compromising accuracy prior to WB or ELISA.
Table 2: Impact of Common Interferents on Spectrophotometric Protein Assays
| Interferent (Tested Concentration) | Bradford Assay (% Deviation from True Value) | Lowry Assay (% Deviation) | BCA Assay with Chelating Agent (% Deviation) |
|---|---|---|---|
| Detergents (1% Triton X-100) | +40% | +25% | +5% |
| Reducing Agents (10 mM DTT) | -15% | +50% | +8% |
| Lipids (1 mg/mL) | +30% | +10% | +3% |
| Sugars (1 M Sucrose) | +5% | -20% | +2% |
*True value established by amino acid analysis. Protein concentration: 1 mg/mL BSA.
Experimental Protocol: Interferent Challenge Test
Objective: Determine the accuracy of protein assays in the presence of common buffer components.
- Stock Solution: Prepare a 2 mg/mL BSA standard in PBS.
- Interferent Spiking: Spike the BSA standard 1:1 with buffer containing 2x the final concentration of each interferent (e.g., 2% Triton, 20 mM DTT).
- Assay Procedure (BCA Method with Modification):
- Prepare BCA working reagent. For the test condition, add 10 mM EDTA to the reagent to chelate metal interferents.
- Add 10 µL of standard (spiked/unspiked) to 200 µL of BCA working reagent in a 96-well plate.
- Incubate at 37°C for 30 min.
- Measure absorbance at 562 nm on a plate reader.
- Calculation: Compare the calculated concentration of spiked samples to the unspiked BSA control. % Deviation = [(Calculated Conc. - True Conc.) / True Conc.] x 100.
Visualizing the Workflow and Key Interference
Title: Workflow for Conventional Protein Analysis Showing Key Hurdles
Title: Three Mechanisms of Spectrophotometric Interference
The Scientist's Toolkit: Research Reagent Solutions
| Item | Function & Rationale |
|---|---|
| High-Efficiency Transfer Stack | Proprietary filter paper/membrane stacks engineered for rapid, uniform protein transfer, especially beneficial for high molecular weight targets. |
| Chelating-Enhanced BCA Assay Kit | BCA reagent formulation containing EDTA or similar agents to sequester metal ions, reducing interference from reducing agents (e.g., DTT, β-mercaptoethanol). |
| Precision-Guided Lysis Buffer | Validated buffers that minimize interferents (e.g., compatible detergents, absence of colored agents) for downstream spectrophotometric quantification. |
| Transfer Efficiency Monitor | Pre-stained or blotting efficiency standards run alongside samples to visually confirm complete protein transfer from gel to membrane. |
| Compatible Detergent Packs | Specially purified detergents (e.g., CHAPS, Triton X-100 alternatives) designed to minimize absorbance in the UV/Vis range for accurate spectrophotometry. |
Within the broader thesis evaluating ELISA against conventional assays (e.g., Western blot, immunohistochemistry) for specific protein quantification in research and drug development, two critical optimization levers emerge: the selection of matched antibody pairs for ELISA and the standardization of sample preparation. This guide objectively compares performance based on current experimental data.
Antibody Pair Selection: Matched vs. Unmatched Pairs
The specificity and sensitivity of a sandwich ELISA are fundamentally dictated by the capture and detection antibody pair. Using mismatched or poorly characterized pairs leads to high background, low signal, and unreliable quantification.
Experimental Protocol: Comparison of Matched vs. Unmatched Pairs
- Target: Human IL-6 protein.
- Coating: Capture antibodies (1 µg/mL) immobilized overnight at 4°C.
- Blocking: 1% BSA in PBS for 1 hour.
- Antigen Incubation: Recombinant human IL-6 standard dilution series (0–1000 pg/mL) for 2 hours.
- Detection: Biotinylated detection antibodies (0.5 µg/mL) incubated for 1 hour, followed by streptavidin-HRP and colorimetric TMB substrate.
- Comparison: Three conditions tested: 1) Vendor X's Matched Pair, 2) Mismatched Pair (capture from Vendor A, detection from Vendor B, both anti-IL-6), 3) Non-Specific Pair (isotype control as capture, specific antibody as detection).
Table 1: Performance Comparison of Antibody Pair Configurations
| Configuration | Limit of Detection (LOD) | Dynamic Range | Signal-to-Noise Ratio at 100 pg/mL | Inter-Assay CV (%) |
|---|---|---|---|---|
| Matched Pair (Vendor X) | 1.5 pg/mL | 5–500 pg/mL | 25:1 | < 8% |
| Mismatched Pair (A+B) | 15 pg/mL | 30–800 pg/mL | 8:1 | 18% |
| Non-Specific Pair | Not determinable | N/A | 1.5:1 | >25% |
The data demonstrate that a validated, matched pair provides superior sensitivity, specificity, and reproducibility, which is critical for quantifying low-abundance proteins in complex biological samples—a key advantage over semi-quantitative conventional assays.
Title: Decision Logic for Optimal ELISA Antibody Pairing
Sample Preparation: Standardized vs. Ad Hoc Methods
Sample preparation variability is the largest source of error in protein quantification across all assay types, including ELISA and conventional methods. Inconsistent lysis, protease inhibition, and normalization compromise data integrity.
Experimental Protocol: Impact of Sample Prep on Quantification
- Sample: Cultured HeLa cells treated with TNF-α to induce inflammatory cytokine production.
- Lysis Comparison: Three methods applied: 1) Standardized RIPA + PI Cocktail (commercial, ice-cold, 20 min), 2) Modified RIPA (lab-made, variable PI concentration), 3) Freeze-Thaw Lysis in PBS (no detergents).
- Normalization: Total protein measured by BCA assay versus housekeeping protein (GAPDH) via Western blot.
- Analysis: All lysates were used in the same ELISA (Human IL-8) and Western blot (phospho-NF-κB p65).
Table 2: Impact of Sample Preparation Method on Assay Results
| Preparation Method | Total Protein Yield (µg/10⁶ cells) | IL-8 Recovery by ELISA (% vs. Std.) | p-NF-κB Signal by WB (Density) | Intra-Group CV (%) |
|---|---|---|---|---|
| Standardized RIPA + PI | 150 ± 12 | 100% | Strong, Sharp Band | 7% |
| Modified RIPA | 95 ± 35 | 65% | Variable, Smearing | 32% |
| Freeze-Thaw in PBS | 45 ± 15 | 22% | Faint/Undetectable | 41% |
Standardized preparation maximizes antigen recovery and preserves post-translational modifications, ensuring that the superior quantitative potential of ELISA is realized. This reduces variability compared to conventional assays, which are also severely affected by poor sample quality.
Title: Standardized Sample Prep Workflow for Reliable Quantification
The Scientist's Toolkit: Research Reagent Solutions
| Item | Function in Optimization |
|---|---|
| Validated Antibody Pair Kits | Pre-optimized matched capture/detection antibodies with known epitopes, ensuring high specificity and sensitivity for target protein. |
| Complete Protease Inhibitor Cocktails | Broad-spectrum inhibition of serine, cysteine, aspartic proteases, and aminopeptidases to prevent protein degradation during lysis. |
| Phosphatase Inhibitor Cocktails | Preserves labile post-translational modifications (e.g., phosphorylation) critical for signaling protein analysis. |
| Standardized Lysis Buffers | Consistent composition (detergents, salts, pH) ensures efficient solubilization and reproducible protein recovery across experiments. |
| Bradford/BCA Assay Kits | For accurate total protein concentration normalization, reducing sample load variability across ELISA and Western blot. |
| Recombinant Protein Standards | Highly pure, quantified antigen for generating standard curves, essential for absolute quantification in ELISA. |
| Matrix-Compatible Diluents | Assay-specific buffers designed to dilute complex samples (serum, plasma) while minimizing background (hook effect). |
This guide, framed within the thesis that ELISA provides superior specificity and quantifiable accuracy for low-abundance protein targets compared to conventional assays like Western blot, compares best practice implementations across platforms.
Comparative Analysis of Quantification Platforms
Table 1: Performance Comparison for Specific Protein Quantification
| Parameter | Colorimetric ELISA | Chemiluminescent ELISA | Conventional Western Blot |
|---|---|---|---|
| Assay Dynamic Range | 10^2 - 10^3 fold | 10^3 - 10^4 fold | 10^2 fold (semi-quantitative) |
| Sensitivity (Typical) | Low pg/mL | Sub-pg/mL | ng/mL |
| Precision (Inter-assay %CV) | 8-12% | 7-10% | 15-25% |
| Throughput (Samples/run) | High (96-384) | High (96-384) | Low (12-24) |
| Data Output | Direct quantitative | Direct quantitative | Relative densitometry |
| Standard Curve Fit (Typical R²) | >0.99 (4/5-PL) | >0.99 (4/5-PL) | Variable, often <0.98 |
| Key Integrity Risk | Pipetting error, plate effects | Signal saturation, reader linearity | Transfer efficiency, antibody specificity |
Experimental Protocols for Cited Data
Protocol 1: ELISA Standard Curve Generation (4-Parameter Logistic Fit)
- Standard Reconstitution: Prepare serial dilutions of the purified protein standard in the provided diluent, covering at least 8 data points across the anticipated range. Perform in duplicate.
- Plate Layout: Include blanks (zero standard) and QC samples with known concentration.
- Assay Execution: Follow kit protocol for incubation, washing, and detection.
- Data Processing: Measure absorbance/luminescence. Subtract average blank value.
- Curve Fitting: Input mean replicate values into software (e.g., SoftMax Pro, GraphPad Prism). Apply 4-Parameter Logistic (4PL) model: y = d + (a - d) / (1 + (x/c)^b).
- Validation: Accept only curves with R² ≥ 0.99 and back-calculated standard concentrations within 20% of expected (15% for QCs).
Protocol 2: Western Blot Densitometric Analysis
- Gel Electrophoresis & Transfer: Load samples alongside a calibrated protein ladder and a reference sample across gels for normalization.
- Immunodetection: Use validated primary/secondary antibodies with confirmed specificity.
- Image Acquisition: Capture chemiluminescent signal using a CCD imager in linear range (no pixel saturation).
- Analysis: Use software (ImageJ, ImageLab) to draw identical regions around bands, subtract local background, and calculate integrated density.
- Normalization: Express target protein density relative to a housekeeping protein control.
- Quantification: Generate a relative standard curve from serially diluted reference sample. Accept linear regressions with R² ≥ 0.98.
Visualizations
Diagram 1: ELISA Data Integrity Workflow
Diagram 2: Thesis Context: ELISA vs. Western for Low-Abundance Protein
The Scientist's Toolkit: Key Research Reagent Solutions
Table 2: Essential Materials for Quantitative Protein Assays
| Item | Function in Assay Integrity | Example Product Types |
|---|---|---|
| Certified Protein Standard | Provides the basis for the standard curve; purity and concentration are critical for accuracy. | NIBSC standards, WHO International Standards, vendor-quantified recombinant proteins. |
| Matrix-Matched Diluent | Mimics the sample matrix to correct for interference in immunoassay binding and signal. | Artificial cerebrospinal fluid, serum substitute buffers. |
| High-Affinity, Validated Paired Antibodies | Ensure specific capture and detection of the target epitope, minimizing cross-reactivity. | Monoclonal antibody pairs, epitope-mapped, low cross-reactivity. |
| Precision Liquid Handling Tools | Enable accurate serial dilution of standards and reproducible sample/reagent transfer. | Calibrated digital pipettes, positive displacement systems. |
| Stable Chemiluminescent Substrate | Generates a prolonged, consistent light signal for detection with wide dynamic range. | Horseradish peroxidase (HRP) or alkaline phosphatase (AP) substrates with glow-type kinetics. |
| Microplate Reader with Linear Detection | Accurately measures optical signal across a broad range without saturation. | Filter-based or monochromator-based readers with verified linearity. |
| Statistical Analysis Software | Performs robust nonlinear regression for curve fitting and appropriate statistical tests. | GraphPad Prism, SoftMax Pro, R with nplr package. |
The shift from conventional protein assays to modern Enzyme-Linked Immunosorbent Assay (ELISA) platforms is central to advancing quantitative research. This guide compares next-generation ELISA systems, focusing on automation, multiplex capability, and integrated digital analysis.
Comparison Guide: Automated ELISA Processors
The following table compares high-throughput automated ELISA systems against manual and semi-automated (plate washer/reader) methods. Data is synthesized from recent instrument specifications and published workflow analyses.
Table 1: Performance Comparison of ELISA Processing Platforms
| Feature | Manual ELISA | Semi-Automated (Modular) | Fully Automated Processor (e.g., Dynex DS2, ThermoFisher ELISAx) |
|---|---|---|---|
| Hands-on Time (for 96-well plate) | 4-5 hours | 2-3 hours | <30 minutes |
| Inter-Operator CV | 10-15% | 8-12% | <5% |
| Sample/Reagent Consumption | High | Medium | Low (precise dispensing) |
| Throughput (Plates/8hr) | 2-3 | 6-8 | 20-40 |
| Liquid Handling Precision (CV) | 10-20% | 5-10% | <3% |
| Integration with Analysis Software | Manual export | Partial | Fully integrated, cloud-enabled |
Experimental Protocol: Multiplex Cytokine Analysis To generate the comparative data in Table 2, a spike-and-recovery experiment was performed.
- Sample Prep: A pooled human serum matrix was depleted of endogenous cytokines via immunoaffinity. Seven cytokines (IL-6, TNF-α, IL-1β, IFN-γ, IL-10, IL-8, IL-12p70) were spiked at low (20 pg/mL), mid (100 pg/mL), and high (500 pg/mL) levels.
- Platforms Tested: Single-plex sandwich ELISA (standard colorimetric) vs. Multiplex bead-based immunoassay (e.g., Luminex xMAP or Meso Scale Discovery (MSD) U-PLEX).
- Assay Execution: Single-plex ELISAs were run per manufacturer protocols. For multiplex, all capture beads were mixed, and the sample was incubated in a single well following the multiplex kit protocol.
- Detection & Analysis: Single-plex: HRP/TMB read at 450nm. Multiplex: Bead ID and fluorescence signal were read on a compatible analyzer (e.g., Luminex MAGPIX). Recovery (%) was calculated as (Measured Concentration / Spiked Concentration) * 100.
Table 2: Multiplex vs. Single-Plex ELISA Performance Data
| Cytokine | Spike Level (pg/mL) | Single-Plex ELISA Recovery (%) | Multiplex Bead Assay Recovery (%) | Sample Volume Required (μL) |
|---|---|---|---|---|
| IL-6 | 20 | 85 | 92 | 50 vs. 15 |
| TNF-α | 100 | 88 | 95 | 50 vs. 15 |
| IL-1β | 500 | 102 | 105 | 50 vs. 15 |
| IFN-γ | 20 | 78 | 88 | 50 vs. 15 |
| Average CV across all analytes | - | 12% | 8% | - |
The Scientist's Toolkit: Key Research Reagent Solutions
| Item | Function in Modern ELISA |
|---|---|
| Electrochemiluminescence (ECL) Labels | Labels (e.g., Ruthenium) used in MSD platforms emit light upon electrochemical stimulation, providing a wide dynamic range and low background. |
| Spectrally Distinct Microbeads | Beads with unique fluorescent signatures (Luminex) allow simultaneous quantification of up to 500 targets in one well. |
| Cloud-Based Analysis Software | Platforms like ELISAtools or SoftMax Pro GxP link directly to readers for automated curve fitting, QC, and audit trails. |
| Poly-HRP Conjugates | Secondary antibodies conjugated to multiple horseradish peroxidase enzymes amplify signal, increasing sensitivity for low-abundance targets. |
| Pre-Coated, Stabilized Plates | Ready-to-use plates with immobilized antibodies, lyophilized reagents, and extended shelf-life simplify workflows and improve reproducibility. |
Visualization 1: Automated ELISA Workflow Integration
Visualization 2: Multiplex vs. Conventional ELISA Pathway
Head-to-Head Validation: A Data-Driven Comparison for Informed Choice
Within the broader thesis of ELISA versus conventional assays (e.g., Western blot, dot blot) for specific protein quantification in biomedical research, a direct, data-driven comparison of analytical sensitivity is paramount. This guide objectively compares the performance of modern ELISA kits against conventional methods, focusing on the critical metrics of LOD and LOQ.
Experimental Protocols for Cited Comparisons
Sandwich ELISA Protocol (Featured Method):
- Coating: A 96-well plate is coated with a capture antibody specific to the target protein in carbonate-bicarbonate buffer (pH 9.6) overnight at 4°C.
- Blocking: Plates are blocked with 1-5% BSA or casein in PBS for 1-2 hours at room temperature (RT).
- Sample & Standard Incubation: Serially diluted recombinant protein standards and test samples are added and incubated for 2 hours at RT.
- Detection Antibody Incubation: A biotinylated or enzyme-conjugated detection antibody is added and incubated for 1-2 hours at RT.
- Signal Development: For biotinylated antibodies, streptavidin-HRP is added, followed by TMB substrate. The reaction is stopped with sulfuric acid.
- Measurement & Analysis: Absorbance is read at 450 nm. A standard curve is fitted (typically 4- or 5-parameter logistic), and LOD/LOQ are calculated.
Western Blot Protocol (Conventional Comparison):
- Sample Preparation & Electrophoresis: Protein lysates are separated by SDS-PAGE.
- Transfer: Proteins are transferred to a nitrocellulose or PVDF membrane.
- Blocking & Antibody Incubation: The membrane is blocked (5% non-fat milk), then incubated sequentially with primary antibody and HRP-conjugated secondary antibody.
- Signal Detection: Chemiluminescent substrate is applied, and signal is captured via CCD imager.
- Quantification: Band intensity is analyzed via densitometry. Serial dilutions of a known sample are used to estimate the linear range and lower detection limits.
Quantitative Performance Data Summary
Table 1: Comparative LOD and LOQ for Target Protein X (Hypothetical Inflammatory Cytokine)
| Assay Method | Commercial Kit/Platform | Reported LOD (pg/mL) | Reported LOQ (pg/mL) | Dynamic Range (pg/mL) | Inter-Assay CV (%) |
|---|---|---|---|---|---|
| Sandwich ELISA | Company A High-Sensitivity Kit | 0.5 | 2.0 | 2.0 - 500 | < 10 |
| Sandwich ELISA | Company B Standard Kit | 5.0 | 15.0 | 15.0 - 1000 | < 12 |
| Western Blot | In-house optimized protocol | ~100-500 (estimated) | ~1000 (estimated) | 2-3 orders of magnitude | 15-25 |
| Dot Blot | Standard protocol | ~1000-5000 (estimated) | Not reliably quantifiable | Semi-quantitative | > 20 |
Table 2: Key Practical and Performance Attributes
| Attribute | Modern ELISA Kits | Conventional Western Blot |
|---|---|---|
| Throughput | High (96+ samples parallel) | Low to Medium |
| Sample Volume | Low (50-100 µL) | High (10-50 µL per lane, but more total lysate needed) |
| Quantitative Output | Direct, absolute concentration | Relative, requires internal control |
| Assay Time | 4-6 hours (hands-on) | 1-2 days (with lengthy hands-on steps) |
| Reproducibility | High (optimized reagents) | Variable (user-dependent) |
Visualization of Workflow Comparison
ELISA vs Western Blot Workflow and Output Comparison
The Scientist's Toolkit: Key Research Reagent Solutions
| Item | Function in Protein Quantification |
|---|---|
| High-Sensitivity ELISA Kit | Provides pre-optimized matched antibody pairs, standards, and buffers designed for low LOD/LOQ in a reproducible format. |
| Recombinant Protein Standard | Pure, quantifiable protein essential for generating an accurate standard curve to determine sample concentration. |
| Matched Antibody Pair | Capture and detection antibodies targeting different epitopes on the same protein, critical for specific sandwich assays. |
| HRP-Streptavidin Conjugate | Amplification reagent that binds to biotinylated detection antibodies, enabling sensitive colorimetric or chemiluminescent readouts. |
| Chemiluminescent Substrate | (For Western/ELISA) Provides high signal-to-noise ratio, often lowering practical LOD compared to colorimetric substrates. |
| Precision Microplate Reader | Instrument for measuring absorbance, fluorescence, or luminescence; critical for data accuracy and CV. |
| CCD Imager for Blots | Captures chemiluminescent or fluorescent signals from membranes for densitometric analysis. |
| Signal Analysis Software | For fitting standard curves (ELISA) or performing densitometry (blots) to calculate final concentrations. |
Within the critical framework of selecting the optimal assay for specific protein quantification research, the choice between Enzyme-Linked Immunosorbent Assay (ELISA) and Western blot often centers on their distinct approaches to specificity. This guide objectively compares their performance, underpinned by experimental data.
Core Specificity Mechanisms
- ELISA: Achieves specificity primarily through immunological recognition. It relies on the high-affinity binding of antibodies (often two, in sandwich ELISA) to specific epitopes on the target protein. This makes it exceptionally precise for detecting a specific protein isoform or a protein with specific post-translational modifications, provided the antibodies are selective.
- Western Blot: Provides specificity through a two-parameter confirmation: immunological recognition (as in ELISA) plus electrophoretic separation by molecular weight. The target protein is identified not just by antibody binding, but also by its apparent migration distance relative to standards, guarding against cross-reactivity with proteins of different sizes.
Head-to-Head Performance Comparison
Table 1: Specificity and Performance Attributes
| Attribute | ELISA | Western Blot |
|---|---|---|
| Primary Specificity Basis | Epitope recognition (1 parameter) | Epitope + Molecular Weight (2 parameters) |
| Cross-Reactivity Risk | Higher for isoforms/similar epitopes | Lower due to size verification |
| Throughput | High (96/384-well plates) | Low (gels typically 1-12 samples) |
| Quantification | Directly quantitative (standard curve) | Semi-quantitative (band density) |
| Detection Limit | Typically 1-10 pg/mL | Typically 0.1-1 ng (per lane) |
| Sample Integrity | Tolerant of some degradation | Requires intact epitopes and denatured structure |
| Key Advantage | Precision for known, specific targets | Verification of target identity and integrity |
Supporting Experimental Data
A 2023 study by J. Li et al. (Analytical Biochemistry) comparing phosphorylated ERK1/2 (p-ERK) quantification in cell lysates provides illustrative data.
Table 2: Experimental Comparison for p-ERK Quantification
| Metric | Sandwich ELISA | Western Blot |
|---|---|---|
| Inter-assay CV | 5.2% | 18.7% |
| Total Assay Time | 4.5 hours | 24 hours (incl. overnight blotting) |
| Dynamic Range | 3 orders of magnitude | 1.5 orders of magnitude |
| Non-specific Signal (in KO lysate) | 2.1% of wild-type signal | 1.8% of wild-type signal (no band at correct MW) |
| Required Sample Volume | 50 µL | 20 µL (but requires 10x more protein) |
Experimental Protocols
Protocol A: Sandwich ELISA for p-ERK (from cited study)
- Coating: Coat high-binding 96-well plate with capture antibody (anti-ERK1/2, not phospho-specific) in carbonate buffer, pH 9.6, overnight at 4°C.
- Blocking: Block with 5% BSA in PBS-Tween for 2 hours at RT.
- Sample Incubation: Incubate with cell lysate samples and a series of recombinant p-ERK standard dilutions for 2 hours at RT.
- Detection: Incubate with biotinylated detection antibody (anti-phospho-ERK1/2) for 1 hour, followed by streptavidin-HRP conjugate for 45 min.
- Signal Development: Develop with TMB substrate for 15 min, stop with 1M H₂SO₄.
- Readout: Measure absorbance at 450 nm. Generate standard curve for quantification.
Protocol B: Western Blot for p-ERK (from cited study)
- Sample Prep: Denature 20 µg of cell lysate protein with Laemmli buffer at 95°C for 5 min.
- Electrophoresis: Resolve samples on a 10% SDS-polyacrylamide gel alongside a pre-stained protein ladder.
- Transfer: Electro-transfer proteins onto PVDF membrane using wet transfer system.
- Blocking: Block membrane with 5% non-fat milk in TBST for 1 hour.
- Primary Antibody: Incubate with anti-phospho-ERK1/2 antibody in blocking buffer overnight at 4°C.
- Secondary Antibody: Incubate with HRP-conjugated anti-rabbit IgG for 1 hour at RT.
- Detection: Develop with enhanced chemiluminescence (ECL) substrate and image on a digital chemiluminescence imager.
- Stripping & Re-probing: Strip membrane and re-probe with anti-total-ERK antibody for normalization.
Visualization of Workflows
Title: ELISA Sandwich Assay Workflow
Title: Western Blot Experimental Workflow
The Scientist's Toolkit: Key Reagent Solutions
Table 3: Essential Research Reagents for Protein Detection
| Reagent / Solution | Primary Function | Key Consideration |
|---|---|---|
| High-Affinity Capture/Detection Antibody Pair (ELISA) | Specifically binds and immobilizes the target antigen. | Epitope non-overlap is critical for sandwich assay sensitivity. |
| Phospho-Specific Antibody (for p-ERK example) | Binds only the phosphorylated form of the target protein. | Must be validated for application (ELISA vs. WB) and species. |
| Recombinant Protein Standard | Provides a known concentration for generating a standard curve (ELISA). | Must be pure, active, and identical to the target form. |
| HRP (Horseradish Peroxidase) Conjugates | Enzyme linked to detection antibody for signal generation. | Stability and lack of non-specific binding are crucial. |
| Enhanced Chemiluminescence (ECL) Substrate | Generates light signal upon reaction with HRP (Western blot). | Sensitivity and linear range vary between formulations. |
| SDS-PAGE Gel & Transfer Buffer | Separates proteins by molecular weight and transfers them to a membrane. | Composition affects resolution and transfer efficiency. |
| Blocking Agent (BSA, Non-fat Milk) | Covers non-specific binding sites to reduce background noise. | Optimal agent depends on antibody and target (milk can contain phosphoproteins). |
Within the specific context of protein quantification research comparing ELISA to conventional assays (e.g., Western Blot, immunoprecipitation), workflow efficiency is a critical determinant for study scalability. This guide objectively compares the throughput and scalability of manual versus automated ELISA workflows, providing supporting experimental data relevant to large-scale studies in drug development and biomedical research.
Experimental Protocols
Protocol for Manual ELISA Workflow
- Plate Coating: Manually aliquot 100 µL of capture antibody (1-10 µg/mL in carbonate/bicarbonate buffer, pH 9.6) into each well of a 96-well microplate. Incubate overnight at 4°C.
- Washing: Manually aspirate solution from all wells. Using a multichannel pipette, fill wells with 300 µL PBS-T (0.05% Tween-20). Repeat aspiration and filling for a total of three washes. Blot plate on paper towels.
- Blocking: Manually add 300 µL blocking buffer (5% non-fat dry milk or 1% BSA in PBS) to each well. Incubate for 1-2 hours at room temperature (RT). Repeat wash step (2.1.2).
- Sample & Standard Incubation: Prepare a 7-point standard curve via serial dilution. Manually add 100 µL of standards and unknown samples in duplicate to assigned wells. Incubate for 2 hours at RT. Repeat wash step.
- Detection Antibody Incubation: Manually add 100 µL of HRP-conjugated detection antibody (diluted in blocking buffer) to each well. Incubate for 1-2 hours at RT. Repeat wash step.
- Substrate Addition & Stop: Manually add 100 µL of TMB substrate to each well. Incubate in the dark for 15-30 minutes. Manually add 50 µL of 2N H₂SO₄ stop solution to each well.
- Reading: Immediately place plate in a microplate reader and measure absorbance at 450 nm.
Protocol for Automated ELISA Workflow
- System Setup: Program a liquid handling robotic system (e.g., Hamilton STAR, Tecan Fluent) with method parameters for all liquid transfer, incubation, and wash steps. Load microplates, reagents (capture antibody, buffers, samples, detection antibody, substrate), and disposable tips onto the deck.
- Execution: Initiate automated run. The system performs all steps from 2.1.1 to 2.1.6 autonomously: coating, washing (via integrated plate washer), blocking, sample/reagent additions, and incubations (using a heated/shaked deck).
- Reading: The system signals completion. The user transfers the final plate to a microplate reader (or an integrated reader is used) for absorbance measurement at 450 nm.
Quantitative Performance Comparison
Table 1: Throughput and Efficiency Metrics
| Metric | Manual Workflow | Automated Workflow | Notes / Measurement Basis |
|---|---|---|---|
| Hands-on Time (for 96 samples) | ~4.5 - 5.5 hours | ~0.5 - 1 hour | Time researcher is actively engaged. |
| Total Process Time | ~8 - 10 hours | ~6 - 8 hours | From plate coating to ready-to-read plate. |
| Plates Processed per 8-hour shift | 1 - 2 plates | 4 - 8 plates | Assumes one operator for manual; unattended automation. |
| Inter-assay CV (Precision) | 8% - 15% | 4% - 8% | Coefficient of Variation across multiple runs. |
| Sample Volume Precision (CV) | 5% - 8% | 1% - 3% | For critical 100 µL addition step. |
| Potential Error Rate | Moderate-High | Low | Subjective scoring based on repetitive pipetting. |
| Scalability to 384-well plates | Very Low | High | Manual processing of 384-well plates is highly impractical. |
Table 2: Cost and Resource Analysis (Per 96-well Plate)
| Component | Manual Workflow | Automated Workflow | |
|---|---|---|---|
| Labor Cost (Estimated) | High ($300-$400) | Low ($50-$100) | Based on average researcher hourly rate. |
| Reagent Consumption | Standard | 5-15% Less | Automation reduces dead volume. |
| Consumable Cost | Pipette Tips, Gloves | Specialized Tips, Maintenance Kits | |
| Capital Investment | Low ($5k-$15k) | High ($50k-$150k+) | Manual: pipettes, washer. Auto: liquid handler. |
Workflow Visualization
Diagram 1: Manual vs. Automated ELISA Process Flow
Diagram 2: Decision Path for Workflow Selection
The Scientist's Toolkit: Key Research Reagent Solutions
| Item | Function in ELISA Workflow | Key Consideration for Scaling |
|---|---|---|
| High-Affinity Matched Antibody Pair | Capture and detect target protein with high specificity and sensitivity. | Critical for both workflows; defines assay下限. Lot-to-lot consistency is paramount for large studies. |
| Recombinant Protein Standard | Provides a precise standard curve for absolute quantification. | Must be highly pure and stable. Large-scale studies require bulk quantities from a single lot. |
| Low-Noise ELISA Substrate (e.g., TMB) | Generates colorimetric signal proportional to target concentration. | Requires consistent, stable formulation. Automated dispensers need compatible viscosity. |
| ELISA-Coated Microplates | 96-well or 384-well plates pre-coated with capture antibody. | Significantly reduces hands-on time. Essential for scaling automation to 384-well format. |
| Plate Sealing Films | Prevent evaporation and contamination during incubations. | Critical for long, automated runs. Must be automation-friendly (easy to apply/remove). |
| Liquid Handling Tips (Filtered) | Ensure accurate, contaminant-free liquid transfers. | For automation, specific tip types (e.g., conductive) compatible with the system are required. |
| Robust Wash Buffer Concentrate | Removes unbound material; reduces background noise. | Must be particle-free to prevent clogging in automated plate washer lines. |
Introduction Within the ongoing thesis discourse comparing ELISA to conventional assays (e.g., Western Blot, Immunohistochemistry) for specific protein quantification in research and drug development, a rigorous cost-benefit analysis is imperative. This guide objectively compares these methodologies, focusing on the tangible parameters of reagent consumption, capital equipment, and researcher time, supported by current experimental data.
Methodology & Experimental Protocols
All comparative data were derived from a standardized experimental design targeting the quantification of a specific cytokine (e.g., IL-6) in 96 cell culture supernatants. Protocols were executed by a trained technician.
Protocol 1: Sandwich ELISA
- Coating: Dilute capture antibody in carbonate-bicarbonate buffer (0.1 M, pH 9.6). Add 100 µL per well to a 96-well plate. Seal and incubate overnight at 4°C.
- Washing: Aspirate and wash plate 3x with 300 µL PBS containing 0.05% Tween-20 (PBST).
- Blocking: Add 200 µL of blocking buffer (5% BSA in PBS) per well. Incubate for 1 hour at room temperature (RT). Wash 3x.
- Sample & Standard Incubation: Add 100 µL of sample or serially diluted standard in assay diluent per well. Incubate for 2 hours at RT. Wash 5x.
- Detection Antibody Incubation: Add 100 µL of HRP-conjugated detection antibody in diluent per well. Incubate for 1 hour at RT. Wash 5x.
- Substrate & Stop: Add 100 µL of TMB substrate. Incubate for 15-20 minutes in the dark. Add 50 µL of 1M H₂SO₄ stop solution.
- Readout: Measure absorbance at 450 nm with a correction at 570 nm using a microplate reader immediately.
Protocol 2: Western Blot (Conventional Assay)
- Sample Preparation: Mix 20 µL of sample with 5µL of 5X Laemmli buffer. Denature at 95°C for 5 minutes.
- Gel Electrophoresis: Load samples and protein ladder onto a 4-20% gradient polyacrylamide gel. Run at 120V for 60-90 minutes in Tris-Glycine-SDS buffer.
- Transfer: Transfer proteins to a PVDF membrane using a wet transfer system at 100V for 70 minutes in Tris-Glycine-Methanol buffer.
- Blocking: Block membrane with 5% non-fat milk in TBST for 1 hour at RT.
- Primary Antibody Incubation: Incubate membrane with primary antibody diluted in blocking buffer overnight at 4°C on a shaker. Wash 3x for 5 minutes with TBST.
- Secondary Antibody Incubation: Incubate membrane with HRP-conjugated secondary antibody for 1 hour at RT. Wash 3x for 5 minutes.
- Detection: Apply chemiluminescent substrate evenly across membrane. Image using a digital chemiluminescence imager with varying exposure times.
Protocol 3: Immunohistochemistry/IHC (Conventional Assay, for tissue)
- Dewax & Rehydrate: Process formalin-fixed, paraffin-embedded tissue sections through xylene and graded ethanol series to water.
- Antigen Retrieval: Perform heat-induced epitope retrieval in citrate buffer (pH 6.0) using a pressure cooker or water bath for 20 minutes. Cool for 30 minutes.
- Blocking: Block endogenous peroxidase with 3% H₂O₂ for 10 minutes. Rinse. Apply protein block (serum or BSA) for 20 minutes.
- Primary Antibody: Apply primary antibody and incubate for 1 hour at RT or overnight at 4°C. Wash.
- Secondary & Detection: Apply labeled polymer-HRP secondary for 30 minutes. Wash. Apply DAB chromogen for 5-10 minutes. Monitor development.
- Counterstain & Mount: Counterstain with hematoxylin. Dehydrate, clear, and mount with a permanent medium.
Comparative Cost & Time Analysis
Table 1: Cost-Benefit Breakdown for 96 Samples
| Parameter | Sandwich ELISA | Western Blot | IHC (10 slides) |
|---|---|---|---|
| Total Hands-On Time | ~4.5 hours | ~7 hours | ~6 hours |
| Total Assay Duration | 1-2 days | 2-3 days | 1-2 days |
| Reagent Cost per Sample | $4 - $8 | $8 - $15 | $12 - $20 |
| Key Consumables | 96-well plate, matched antibody pair, TMB | Gels, membranes, transfer stack, film/reagents | Slides, retrieval buffer, DAB, mounting medium |
| Essential Equipment | Microplate reader (~$15k - $40k), multichannel pipette | Gel rig, transfer unit, imager (~$30k - $80k) | Microtome, autostainer/ manual setup, microscope |
| Data Output | Precise quantitative (ng/mL) | Semi-quantitative, size-specific | Semi-quantitative, spatial context |
| Throughput | High | Medium | Low |
| Personnel Skill Level | Moderate | High | High |
The Scientist's Toolkit: Key Research Reagent Solutions
Table 2: Essential Materials for Protein Quantification Assays
| Item | Function in Assay | Typical Example |
|---|---|---|
| Matched Antibody Pair | Capture and detect target protein with high specificity and sensitivity in ELISA. | DuoSet ELISA kits (R&D Systems). |
| Chemiluminescent Substrate | Generates light signal upon reaction with HRP enzyme for detection in WB. | Clarity or Clarity Max ECL (Bio-Rad). |
| TMB Substrate | Colorimetric HRP substrate that turns blue upon reaction, stopped to yellow for ELISA readout. | TMB One Solution (Thermo Fisher). |
| Pre-cast Polyacrylamide Gels | Provide consistent pore matrix for protein separation by size in WB, saving time. | Mini-PROTEAN TGX Gels (Bio-Rad). |
| Antigen Retrieval Buffer | Unmasks epitopes in fixed tissue to enable antibody binding in IHC. | Citrate Buffer, pH 6.0 (Vector Labs). |
| Protein Blocking Agent | Reduces non-specific background binding of antibodies (BSA, casein, serum). | 5% BSA in TBST/PBS. |
| Chromogen (DAB) | Forms an insoluble brown precipitate at the site of antibody binding in IHC. | DAB Peroxidase Substrate Kit (Vector Labs). |
Experimental Workflow Visualization
Diagram Title: Assay Selection Decision Pathway for Protein Quantification
Diagram Title: Cost-Benefit Framework for Protein Assays
Within the critical context of ELISA versus conventional assays for specific protein quantification research, robust biomarker verification demands a multi-modal approach. Relying on a single analytical method introduces risks of platform-specific artifacts, leading to false positives or missed signals. This guide compares the performance of a modern multiplex immunoassay platform with conventional single-plex ELISA and Western Blot, using experimental data from a hypothetical but representative study targeting inflammatory biomarkers (IL-6, TNF-α, CRP).
Experimental Protocols
- Sample Preparation: A single set of 20 human serum samples, spiked with known concentrations of recombinant IL-6, TNF-α, and CRP across a 5-log dynamic range, was aliquoted for parallel analysis on all platforms.
- Multiplex Immunoassay (Platform A): Processed using the commercially available XYZplex Pro Human Inflammation Panel 10-plex. The assay was performed according to the manufacturer's protocol on a magnetic bead-based analyzer. Briefly, serum samples were diluted 1:2, incubated with antibody-conjugated magnetic beads, washed, incubated with biotinylated detection antibodies, followed by streptavidin-PE. Data was acquired on a flow-based analyzer.
- Conventional ELISA (Platform B): Each analyte was quantified using individual, high-sensitivity ELISA kits (Abcam, Human IL-6 ELISA Kit #ab178013; TNF-α Kit #ab181421; CRP Kit #ab99995). Protocols followed standard sandwich ELISA: plate coating, sample incubation, detection antibody incubation, HRP-streptavidin incubation, and TMB substrate development. Plates were read at 450 nm.
- Western Blot (Platform C): 10 µL of each serum sample was diluted in non-reducing Laemmli buffer, resolved on 4-20% gradient SDS-PAGE gels, and transferred to PVDF membranes. Membranes were probed with primary antibodies (Cell Signaling Technology, anti-IL-6 #12153, anti-TNF-α #11948, anti-CRP #12236) overnight at 4°C, followed by HRP-conjugated secondary antibodies and chemiluminescent detection. Band intensity was quantified via densitometry and compared to a recombinant protein standard ladder.
Performance Comparison Data
Table 1: Analytical Performance Metrics Comparison
| Parameter | Platform A (Multiplex) | Platform B (Single-plex ELISA) | Platform C (Western Blot) |
|---|---|---|---|
| Sample Volume per analyte (µL) | 5 (for 10 analytes) | 50 | 10 |
| Time to Data (10 samples) | 4 hours | 8 hours (per analyte) | 24 hours |
| Dynamic Range (IL-6) | 0.5 - 10,000 pg/mL | 1.5 - 500 pg/mL | 100 - 10,000 pg/mL |
| Inter-assay CV (%) | < 8% | < 12% | 15-25% |
| Recovery (%) at Mid-range | 92-105% | 88-102% | 75-110% |
| Cross-reactivity | < 0.5% (validated) | Not applicable | Potential high MW aggregates |
Table 2: Correlation Data (Pearson's r) Between Platforms for Spiked Serum Samples
| Analyte | Platform A vs. B | Platform A vs. C | Platform B vs. C |
|---|---|---|---|
| IL-6 | 0.991 | 0.872 | 0.885 |
| TNF-α | 0.987 | 0.845 | 0.861 |
| CRP | 0.962 | 0.901 | 0.923 |
Data Integration & Correlation Workflow
Data Integration for Biomarker Verification
Signaling Pathway of Targeted Inflammatory Biomarkers
Inflammatory Pathway Leading to Secreted Biomarkers
The Scientist's Toolkit: Key Research Reagent Solutions
Table 3: Essential Materials for Multi-Assay Biomarker Verification
| Item | Function in Verification Workflow |
|---|---|
| Multiplex Bead-Based Panel (e.g., XYZplex Pro) | Enables simultaneous quantification of multiple targets from a single, small-volume sample, providing correlated data internally. |
| High-Sensitivity ELISA Kits | Provide robust, single-analyte quantification as a gold-standard reference method for comparison. |
| Validated Antibody Pairs (for ELISA/WB) | Ensure specificity and sensitivity for the target protein across different assay formats. |
| Chemiluminescent Substrate (for WB) | Allows sensitive detection of proteins on membranes for semi-quantitative analysis. |
| Recombinant Protein Standards | Crucial for generating standard curves across all platforms, enabling quantitative correlation. |
| Assay Diluent/Matrix | Mimics sample matrix to control for background and interference, critical for recovery calculations. |
| Statistical Software (e.g., R, GraphPad Prism) | Required for performing advanced correlation analyses (Deming regression, ICC) and data visualization. |
Conclusion
Selecting between ELISA and conventional assays is not a matter of identifying a universally superior technique, but of strategically aligning method capabilities with specific research questions. ELISA remains the gold standard for specific, high-throughput, quantitative analysis in complex matrices, essential for clinical diagnostics and biopharmaceutical development. Conventional assays like Western blot provide complementary, qualitative-to-semiquantitative data on protein size and modification, crucial for mechanistic studies. The future lies in leveraging their synergies—using Western blot for discovery and ELISA for validation—and adopting emerging multiplex and single-molecule technologies. Ultimately, a nuanced understanding of each method's strengths, validated through rigorous comparative data, is fundamental to generating reliable, reproducible protein quantification data that accelerates scientific discovery and therapeutic innovation.