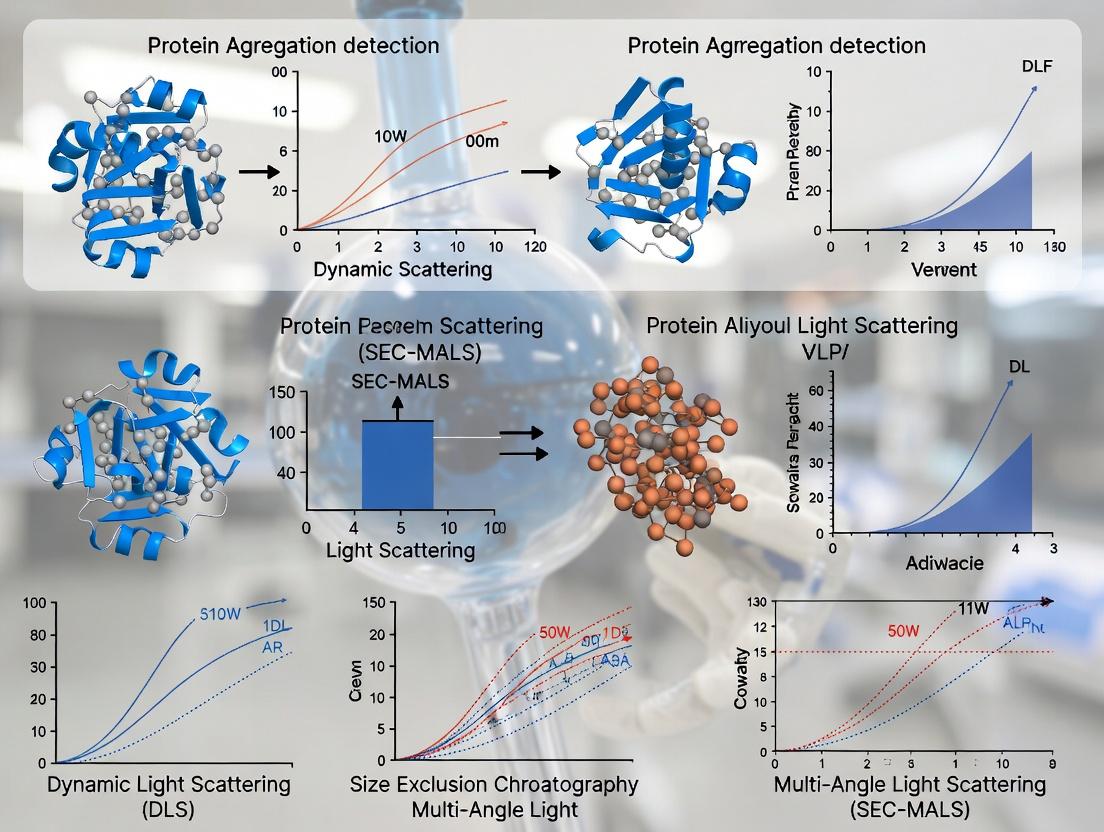
DLS vs. SEC-MALS: A Comparative Guide to Protein Aggregation Analysis for Biopharmaceutical Development
This comprehensive guide compares Dynamic Light Scattering (DLS) and Size Exclusion Chromatography with Multi-Angle Light Scattering (SEC-MALS), two cornerstone techniques for detecting and characterizing protein aggregation.
DLS vs. SEC-MALS: A Comparative Guide to Protein Aggregation Analysis for Biopharmaceutical Development
Abstract
This comprehensive guide compares Dynamic Light Scattering (DLS) and Size Exclusion Chromatography with Multi-Angle Light Scattering (SEC-MALS), two cornerstone techniques for detecting and characterizing protein aggregation. Targeted at researchers and drug development professionals, it explores the fundamental principles of each method, details step-by-step application protocols, addresses common troubleshooting scenarios, and provides a direct, data-driven comparison of their capabilities and limitations. The article synthesizes these insights to offer clear recommendations for method selection, data interpretation, and implementing a robust analytical strategy to ensure therapeutic protein quality, safety, and efficacy from early discovery through formulation and regulatory filing.
Understanding Protein Aggregation: Why Detection is Critical for Drug Safety and Efficacy
The detection and quantification of protein aggregates are non-negotiable in biopharmaceutical development. Within this landscape, two orthogonal techniques dominate: Dynamic Light Scattering (DLS) and Size Exclusion Chromatography coupled with Multi-Angle Light Scattering (SEC-MALS). This guide objectively compares their performance for critical aggregate characterization, underpinning a broader thesis on their complementary roles in de-risking drug development.
Comparison Guide: DLS vs. SEC-MALS for Aggregate Analysis
| Parameter | Dynamic Light Scattering (DLS) | Size Exclusion Chromatography with MALS (SEC-MALS) |
|---|---|---|
| Primary Measurement | Hydrodynamic diameter (size) via diffusion coefficient. | Absolute molar mass and size (Rg) across separated populations. |
| Sample State | In native solution state; minimal sample preparation. | Requires column separation; buffers must be compatible. |
| Size Range | ~0.3 nm to 10 µm. Optimal for submicron. | Limited by column fractionation range (typically up to oligomers/low-order aggregates). |
| Resolution & Sensitivity | Low resolution for polydisperse samples. Sensitive to trace large aggregates (≥0.01% w/w). | High resolution for separated species. Less sensitive to trace large aggregates due to column recovery/loading. |
| Quantification | Semi-quantitative (intensity-weighted). Provides % polydispersity (PDI). | Quantitative (mass concentration) for each resolved peak. Provides precise % monomer/aggregate. |
| Key Advantage | Rapid, low-volume, native-state sizing. Ideal for early screening and stability studies. | High-resolution, absolute characterization of co-existing species. Gold standard for purity. |
| Key Limitation | Cannot deconvolute complex mixtures. Intensity bias favors large particles. | Potential sample-column interactions. May miss large, filterable/column-retained aggregates. |
| Typical Experimental Data (Monoclonal Antibody Sample) | Z-Average: 11.2 nm; PDI: 0.08; Peak 1 (Intensity): 99.1% (d=11 nm); Peak 2: 0.9% (d=120 nm). | Monomer Peak: 96.7% (Mw = 148 kDa); Dimer Peak: 2.1% (Mw = 295 kDa); HMW Peak: 1.2% (Mw > 500 kDa). |
Experimental Protocols for Cited Data
Protocol 1: DLS for High-Concentration mAb Stability Screening
- Sample Prep: Dialyze mAb (10 mg/mL) into formulation buffer (e.g., histidine-sucrose, pH 6.0). Centrifuge at 10,000 × g for 10 min to remove dust.
- Instrument Setup: Use a temperature-controlled DLS instrument (e.g., Malvern Zetasizer). Set temperature to 25°C, equilibration time 120 sec.
- Measurement: Load 12 µL of sample into a low-volume quartz cuvette. Perform a minimum of 12 sequential 10-second measurements.
- Data Analysis: Use instrument software to compute the intensity-weighted size distribution and the polydispersity index (PDI). Report Z-average diameter and % intensity of identified peaks.
Protocol 2: SEC-MALS for Quantifying mAb Aggregates
- Chromatography: Use an HPLC system with a SEC column (e.g., Tosoh TSKgel G3000SWxl). Isocratically elute with mobile phase (0.1 M Na₂SO₄, 0.1 M Na₃PO₄, pH 6.7) at 0.5 mL/min.
- Detection Train: Direct column effluent through: a) UV/Vis detector (280 nm), b) MALS detector (e.g., Wyatt DAWN HELEOS II), c) Refractive Index (RI) detector (e.g., Wyatt Optilab T-rEX).
- Calibration: Normalize MALS detectors using pure monomeric IgG. Determine inter-detector delay volumes and band broadening.
- Analysis: Inject 50 µL of sample at 1-2 mg/mL. Use ASTRA or equivalent software to calculate absolute molar mass for each chromatographic slice via the combined data from UV, MALS, and RI signals.
Visualization of the Complementary Analysis Workflow
Title: Complementary Use of DLS and SEC-MALS in Aggregate Risk Assessment
Immunogenicity Risk Pathway Linked to Aggregate Detection
Title: Aggregate-Induced Immunogenicity Pathway
The Scientist's Toolkit: Key Reagent Solutions for Aggregate Studies
| Reagent / Material | Function & Rationale |
|---|---|
| Formulation Buffers (e.g., Histidine-Sucrose) | Provides stable pH and tonicity to minimize stress-induced aggregation during analysis and storage. |
| SEC Columns (e.g., TSKgel, BEH series) | Resolve monomer from higher-order aggregates based on hydrodynamic volume. Column choice is critical for recovery and resolution. |
| MALS Mobile Phase (e.g., PBS + 150-200mM Arg) | Optimized to minimize protein-column non-specific interactions and suppress protein self-association, ensuring accurate sizing. |
| Protein Stability Kits (e.g., Excipient Screens) | High-throughput plates with varied pH, ionic strength, and stabilizers to identify aggregation-prone conditions via DLS. |
| Size Standards (e.g., BSA, Thyroglobulin) | Used for SEC column calibration and verification of DLS instrument performance and sizing accuracy. |
| Low-Protein-Bind Filters & Tubes | Prevents artificial aggregate generation or loss through surface adsorption during sample preparation. |
Understanding the complete landscape of protein aggregates, from subvisible oligomers to visible precipitates, is critical in biopharmaceutical development. This guide compares the performance of Dynamic Light Scattering (DLS) and Size-Exclusion Chromatography coupled with Multi-Angle Light Scattering (SEC-MALS) in characterizing this spectrum, providing objective data to inform method selection.
Comparative Analysis: DLS vs. SEC-MALS for Aggregate Detection
The table below summarizes the core capabilities of each technique based on published experimental data.
| Performance Criteria | Dynamic Light Scattering (DLS) | Size-Exclusion Chromatography with MALS (SEC-MALS) |
|---|---|---|
| Size Range | ~1 nm to 10 µm. Effective for soluble oligomers and larger submicron particles. | ~10 nm to 500 nm (column-dependent). Limited by column exclusion limit and membrane filters. |
| Resolution & Species Separation | Low resolution. Reports an intensity-weighted size distribution; cannot resolve monomers from small oligomers (<5x size difference) in a mixture. | High resolution. Chromatographic separation resolves monomer, dimer, oligomer, and soluble high-molecular-weight (HMW) species. |
| Quantification | Semi-quantitative. Intensity-weighted bias overrepresents large aggregates. Requires careful data interpretation. | Quantitative. MALS provides absolute molecular weight for each eluting peak, enabling mass or molar concentration of each resolved species. |
| Sample State Analysis | Measures sample in its native state (no dilution or filtration). Can detect large, fragile aggregates that may be lost in SEC. | Requires sample dilution and filtration, risking loss of large or sticky aggregates on column/filter. Measures species post-separation. |
| Key Strength | Rapid, non-invasive assessment of polydispersity and presence of large subvisible particles (>100 nm). Ideal for stability screening and formulation development. | Unambiguous identification and quantification of soluble oligomeric states and small soluble HMW species. Critical for lot release and characterizing product-related impurities. |
| Key Limitation | Poor resolution for polydisperse samples. Cannot distinguish between a few large particles and many small ones without advanced deconvolution algorithms. | Misses insoluble aggregates >0.2 µm (column-filtered out). Provides no data on particles in the visible or subvisible micron range. |
Experimental Data Comparison
A study analyzing stressed monoclonal antibody (mAb) samples highlights the complementary nature of these techniques.
Experimental Protocol (SEC-MALS):
- Column: TSKgel G3000SWxl (or equivalent).
- Mobile Phase: 100 mM sodium phosphate, 150 mM sodium chloride, pH 6.8.
- System: HPLC coupled to MALS (λ=658 nm) and differential refractive index (dRI) detectors.
- Procedure: Samples filtered (0.1 µm or 0.22 µm). 50 µg injected. Data analyzed using ASTRA or equivalent software to determine absolute molecular weight across the elution peak.
Experimental Protocol (DLS):
- Instrument: Zetasizer or similar with backscatter detection (173°).
- Cuvette: Disposable microcuvette.
- Procedure: 50 µL of unfiltered, undiluted sample loaded. Measured at 25°C with automatic attenuation and measurement position selection. Size distribution derived from intensity correlation function using cumulants or multiple distribution algorithms.
Results Summary Table:
| Sample Condition | SEC-MALS Data (Soluble Species) | DLS Data (Native State) | Interpretation |
|---|---|---|---|
| Native mAb | Monomer Peak: >99% (MW ~150 kDa). Dimer: <1%. | Z-Avg: ~10 nm. PDI: 0.05. | Confirms sample is predominantly monodisperse monomer. |
| Heat-Stressed mAb | Monomer: 92%. Trimer: 5%. Larger Soluble HMW: 3%. | Z-Avg: 15 nm. PDI: 0.35. Secondary peak at ~300 nm appears. | SEC-MALS quantifies soluble oligomers. DLS detects the presence of larger, potentially insoluble aggregates not seen by SEC. |
| Agitated mAb | Monomer: ~98%. Dimer: ~2%. | Z-Avg: 12 nm. PDI: 0.15. Significant population >1000 nm. | SEC-MALS shows minimal change in soluble profile. DLS reveals substantial formation of submicron to micron-sized particles, indicating insoluble aggregation. |
Experimental Workflow for Comprehensive Aggregation Analysis
The Scientist's Toolkit: Key Reagent Solutions
| Item | Function in Analysis |
|---|---|
| SEC-MALS Mobile Phase Buffers | Provide optimal ionic strength and pH to minimize non-specific interactions with the column stationary phase. |
| SEC Column (e.g., TSKgel SWxl) | Separates protein species by hydrodynamic size in solution. Critical for resolving monomer from oligomers. |
| 0.1 µm Syringe Filters | For SEC sample preparation. Removes large insoluble aggregates to protect the column, defining the technique's upper size limit. |
| Disposable DLS Cuvettes | Eliminates cross-contamination for sensitive light scattering measurements of undiluted samples. |
| Protein Stability Excipients | (e.g., Sucrose, Polysorbate 20) Used in formulation studies to modulate aggregation, analyzed by both DLS and SEC-MALS. |
| NIST Traceable Size Standards | Essential for instrument calibration and validation of both DLS and MALS measurements. |
Within a research thesis comparing Dynamic Light Scattering (DLS) to Size Exclusion Chromatography with Multi-Angle Light Scattering (SEC-MALS) for detecting protein aggregates, understanding the core principles of DLS is foundational. DLS offers rapid, in-solution size analysis, contrasting with the separation-based, more detailed resolution of SEC-MALS. This guide compares the performance of a modern DLS instrument against common alternatives.
Core Principle: From Fluctuations to Size
DLS measures the Brownian motion of particles in suspension. A laser illuminates the sample, and scattered light intensity fluctuates over time due to particle movement. Smaller particles move faster, causing rapid fluctuations. The autocorrelation function analyzes these fluctuations to determine the diffusion coefficient (D), which is converted to hydrodynamic diameter via the Stokes-Einstein equation.
Performance Comparison: High-Throughput DLS vs. Conventional DLS and SEC-MALS
The following table summarizes key performance metrics for a modern high-throughput DLS plate reader (Instrument A), a traditional cuvette-based DLS system (Instrument B), and SEC-MALS (Technique C).
Table 1: Performance Comparison for Protein Aggregation Analysis
| Feature | Instrument A (High-Throughput DLS) | Instrument B (Conventional Cuvette DLS) | Technique C (SEC-MALS) |
|---|---|---|---|
| Sample Throughput | 96-well plate, ~5 min/plate | Single cuvette, ~3-5 min/sample | ~30-60 min/run (per injection) |
| Sample Volume | 2 - 10 µL | 12 - 70 µL | 20 - 100 µL (injected) |
| Size Range | 0.3 nm - 10 µm | 0.3 nm - 10 µm | 1 nm - >1 µm (post-separation) |
| Key Strength | Rapid polydispersity screening, stability profiling | Robust, high-sensitivity measurements | Absolute MW, resolves sub-populations |
| Polydispersity Index (PDI) Reliability | Good for screening (PDI <0.7) | Good for detailed analysis | Excellent; aggregates physically separated |
| Key Limitation | Limited resolution of mixed populations | Low throughput, manual operation | Longer analysis, column interactions possible |
| Typical Z-Avg Diameter for mAb Monomer | 10.2 ± 0.3 nm | 10.4 ± 0.2 nm | 10.5 ± 0.2 nm (by MALS) |
| Aggregate Detection Limit | ~0.5% (for large aggregates) | ~0.1% (for large aggregates) | <0.1% (size-dependent) |
Experimental Data Supporting DLS Polydispersity Assessment
A key DLS output is the Polydispersity Index (PDI) or %Polydispersity, derived from the autocorrelation function fit. A monodisperse sample has a PDI < 0.05; higher values indicate a mixed population.
Table 2: DLS Analysis of Stressed Monoclonal Antibody (mAb) Formulation
| Sample Condition | Z-Average Diameter (d.nm) | Polydispersity Index (PDI) | % Intensity by Size: Peak 1 (d.nm) / Peak 2 (d.nm) |
|---|---|---|---|
| mAb, Native | 10.4 | 0.04 | 100% (10.4) |
| mAb, 24h at 40°C | 11.1 | 0.25 | 87% (10.6) / 13% (52.3) |
| mAb, 5 Cycles Freeze-Thaw | 12.8 | 0.41 | 78% (10.8) / 22% (120.5) |
Protocol for DLS Stress Study:
- Sample Preparation: A mAb formulation is dialyzed into a standard buffer (e.g., PBS, pH 7.4). Three aliquots are prepared: control (4°C), thermally stressed (40°C for 24h), and freeze-thaw stressed (5 cycles between -80°C and 25°C).
- Instrument Calibration: Validate using a standard latex nanosphere (e.g., 60 nm ± 3%).
- Measurement: Load 50 µL of each sample into a quartz microcuvette (for Instrument B). Equilibrate at 25°C for 2 minutes.
- Data Acquisition: Perform a minimum of 10-15 measurements per sample, duration 10-30 seconds each.
- Analysis: Use cumulants analysis to obtain Z-average and PDI. Use intensity distribution analysis (NNLS) to deconvolute peaks.
The DLS Workflow and Data Interpretation
Title: DLS Measurement and Analysis Workflow
The Scientist's Toolkit: Key Reagent Solutions for DLS Analysis
| Item | Function & Importance |
|---|---|
| Quality Disposable Cuvettes / Microplates | Low fluorescence, low dust containers compatible with instrument. Critical for minimizing spurious scattering from contaminants. |
| Nanoparticle Size Standards | Latex or silica beads with certified diameter (e.g., 30nm, 100nm). Essential for instrument validation and performance qualification. |
| Ultrapure Water (0.1 µm filtered) | For dilutions and final rinse of cuvettes. Must be particle-free to avoid background noise. |
| Syringe Filters (0.02 µm or 0.1 µm pore) | For in-line or sample filtration to remove dust and large aggregates before measurement. |
| Standard Buffer (e.g., PBS) | For sample dialysis/exchange. Ensures consistent ionic strength and refractive index for accurate sizing. |
Comparative Workflow: DLS Screening vs. SEC-MALS Validation
Title: Integrated DLS and SEC-MALS Strategy for Aggregation
Within the critical research on protein aggregation detection, a core debate centers on the choice of analytical technique: Dynamic Light Scattering (DLS) vs. Size-Exclusion Chromatography with Multi-Angle Light Scattering (SEC-MALS). DLS provides a rapid, ensemble measurement of hydrodynamic size in solution but cannot deconvolute mixtures or provide absolute molecular weight (MW). SEC-MALS, in contrast, is a separation-based method that provides absolute molecular weight independent of elution time and directly measures size (radius of gyration, Rg). This allows researchers to separate the contributions of a molecule's mass from its conformational shape—a fundamental principle for identifying monomers, aggregates, and conjugates.
Comparative Analysis: SEC-MALS vs. DLS and SEC-UV/RI
The following table summarizes the core capabilities of SEC-MALS compared to common alternative techniques for protein characterization.
Table 1: Comparison of Key Techniques for Protein Aggregation and Conformation Analysis
| Feature | SEC-MALS | Batch-Mode DLS | SEC with UV/RI Detection Only |
|---|---|---|---|
| Absolute Molecular Weight | Yes, directly from light scattering. | No, infers size only; requires standards for MW. | No, relies on column calibration with standards. |
| Size Measurement | Radius of Gyration (Rg) directly measured. | Hydrodynamic Radius (Rh) provided. | None. Elution volume only infers apparent size. |
| Resolution of Mixtures | Excellent. SEC separates by hydrodynamic volume; MALS analyzes each slice. | Poor. Provides only a z-average for the mixture. | Good separation, but no direct mass or size for peaks. |
| Detection of Aggregates | High sensitivity. Quantifies % mass of monomer vs. oligomer. | Moderate. Can detect large aggregates but cannot resolve or quantify sub-populations. | Indirect. Relies on elution shift; prone to co-elution errors. |
| Conformational Insight | High. Rg vs. MW plot identifies compact, extended, or globular structures. | Low. Provides only a single Rh value. | None. |
| Sample Consumption | Moderate (µg to mg). | Low (µL volumes). | Moderate (µg to mg). |
| Key Advantage | Absolute MW & size for each resolved species. | Rapid, high-throughput size assessment. | Widely available, simple chromatographic profile. |
Experimental Evidence: Case Study in mAb Aggregation
A direct comparative study highlights the superiority of SEC-MALS for detailed aggregation analysis. A stressed monoclonal antibody (mAb) sample was analyzed by DLS and SEC-MALS.
Table 2: Experimental Data from Stressed mAb Sample Analysis
| Method | Reported Parameter | Monomer Peak | Dimer/Oligomer Peak | Large Aggregate Peak |
|---|---|---|---|---|
| Batch DLS | Z-Average Rh (nm) | Not resolved | Not resolved | 12.2 ± 1.5 (ensemble) |
| % Intensity | Not resolved | Not resolved | 100% (interpreted as main population) | |
| SEC-UV (280 nm) | Elution Volume (mL) | 8.2 | 7.5 | 6.1 (small shoulder) |
| % Peak Area | 91.5% | 6.8% | 1.7% (poorly resolved) | |
| SEC-MALS | Absolute MW (kDa) | 149.2 ± 1.5 | 298.8 ± 8.2 | > 1000 |
| Rg (nm) | 5.3 ± 0.2 | 7.1 ± 0.3 | 32.5 ± 5.0 | |
| % Mass Recovery | 88.7% | 8.5% | 2.8% |
Interpretation: DLS reported a single, intensity-weighted hydrodynamic radius of 12.2 nm, heavily skewed by the large aggregates and masking the presence of the monomeric species. SEC-UV suggested a small aggregate shoulder but provided no quantitative mass or size. SEC-MALS definitively quantified the mass fraction of each species, confirmed the dimer was a covalently linked dimer (MW ~2x monomer), and provided the Rg for conformational insight (the dimer is more extended than two monomeric units).
Detailed Experimental Protocol: SEC-MALS Analysis
Protocol 1: SEC-MALS for Protein Aggregation and Conformation
- System Setup: Connect an HPLC system to a MALS detector (containing multiple angular photodetectors, typically from 3 to 18 angles) followed by a differential refractometer (dRI). Use UV detection inline if available.
- Column Selection: Select appropriate SEC columns (e.g., two serially connected columns with pore sizes optimized for the 1-100 nm separation range).
- Mobile Phase: Use a filtered (0.1 µm) and degassed buffer compatible with the protein (e.g., PBS, pH 7.4). The buffer must have a known dn/dc value (~0.185 mL/g for most proteins in aqueous buffers).
- Calibration: Normalize MALS detectors using a monodisperse protein standard (e.g., BSA). Determine the inter-detector delay volumes and band broadening parameters using a narrow MW standard.
- Sample Preparation: Filter protein sample (0.22 µm or 100 nm centrifugal filter, as appropriate). Typical injection mass is 20-100 µg.
- Data Collection: Inject sample. Collect light scattering (LS), UV, and dRI signals simultaneously at a flow rate of 0.5-1.0 mL/min.
- Data Analysis: Use dedicated software (e.g., ASTRA, OMNISEC) to:
- Calculate absolute MW at each data slice via the Debye plot (LS vs. sin²(θ/2)).
- Calculate Rg for slices with sufficient scattering signal at higher angles.
- Integrate peaks based on the dRI or UV signal to determine mass concentrations and % mass distribution.
Visualizing the SEC-MALS Principle and Workflow
Title: SEC-MALS Workflow from Injection to Absolute MW
Title: Decision Guide: DLS vs. SEC-MALS for Protein Analysis
The Scientist's Toolkit: Essential Reagents & Materials
Table 3: Key Research Reagent Solutions for SEC-MALS
| Item | Function & Importance | Example/Notes |
|---|---|---|
| SEC Columns | Separate species by hydrodynamic volume. Critical for resolving aggregates from monomer. | Tosoh TSKgel G3000SWxl, Waters ACQUITY UPLC Protein BEH SEC columns. Choice depends on required resolution range. |
| MALS-Compatible Buffer | Mobile phase with known, consistent properties. Must be clean and match sample buffer. | Filtered (0.1 µm) PBS, pH 7.4. Must have a known dn/dc and low scattering background. |
| Protein dn/dc Value | Refractive index increment. Converts light scattering and dRI signal to concentration and MW. | 0.185 mL/g is standard for most proteins in aqueous buffers. Confirm for glycoproteins or conjugates. |
| Narrow MW Standards | Normalize MALS detectors and verify system performance. | Bovine Serum Albumin (BSA) monomer, thyroglobulin. Must be monodisperse. |
| Mass Recovery Standards | Verify sample does not interact with the SEC column. | A non-interacting protein at high recovery (>95%) indicates ideal chromatographic conditions. |
| Online dRI Detector | Measures the concentration of each eluting species independently. | Essential for calculating absolute MW without relying on UV extinction coefficients. |
| 0.1 µm Syringe Filter | Removes dust and particulates that cause scattering artifacts. | PTFE or cellulose membrane filters. Critical for preparing both buffers and samples. |
For the thesis context of protein aggregation detection research, SEC-MALS is unequivocally the superior technique when definitive characterization is required. While DLS serves as an excellent, rapid tool for screening and monitoring size trends in presumed monodisperse samples, its fundamental limitation is the inability to resolve mixtures. SEC-MALS, grounded in the core principle of separating size from conformation to yield absolute molecular weight, provides the critical, quantitative data on aggregation state, oligomer mass, and conformational changes that are indispensable for rigorous biopharmaceutical development and regulatory filing.
Within the context of protein aggregation detection research, the choice between Dynamic Light Scattering (DLS) and Size Exclusion Chromatography with Multi-Angle Light Scattering (SEC-MALS) is foundational. This guide objectively compares their performance, supported by experimental data, to inform initial workflow decisions.
Core Performance Comparison
The following table summarizes key performance metrics for aggregation detection, based on published experimental data.
Table 1: Comparative Performance of DLS and SEC-MALS for Aggregation Analysis
| Parameter | Dynamic Light Scattering (DLS) | SEC-MALS |
|---|---|---|
| Primary Measurement | Hydrodynamic radius (Rh) via diffusion coefficient. | Absolute molar mass (Mw) and size (Rg) at each chromatographic elution volume. |
| Size Resolution | Low. Reports an intensity-weighted size distribution; difficult to resolve monomers from small oligomers. | High. Chromatographic separation prior to detection resolves monomers, oligomers, and large aggregates. |
| Sample Throughput | Very High (typically 1-2 minutes per sample). | Low to Medium (10-30 minutes per chromatographic run). |
| Sample Consumption | Low (µg quantities). | Medium (typically 10-50 µg for analytical column). |
| Key Aggregation Metric | Polydispersity Index (PDI) and peak analysis. Quantifies heterogeneity. | Direct quantification of % monomer, % oligomer, and % high molecular weight species. |
| Concentration Range | Broad, but sensitive to large aggregates and dust. | Limited by column loading capacity and detector sensitivity. |
| Advantage for Initial Screen | Rapid assessment of sample monodispersity and presence of large aggregates. | Definitive identification and quantification of co-existing species (e.g., dimer vs. monomer). |
| Limitation | Cannot distinguish between different species in a mixture (e.g., monomer vs. dimer). | Method development required; potential for column interactions. |
Experimental Protocols for Cited Data
Protocol 1: DLS for High-Throughput Monoclonal Antibody (mAb) Formulation Screening
- Objective: Rapidly assess aggregation propensity in different buffer conditions.
- Methodology:
- Prepare mAb samples (1 mg/mL) in 96 different formulation buffers.
- Centrifuge samples at 10,000 x g for 10 minutes to remove dust.
- Load 2 µL of supernatant into a 384-well plate.
- Measure using a high-throughput DLS plate reader at 25°C.
- Analyze data for Z-average size (d.nm) and Polydispersity Index (PDI).
- Data Interpretation: Formulations with PDI > 0.2 are flagged for high polydispersity and potential aggregation for further analysis.
Protocol 2: SEC-MALS for Quantifying Aggregate Species in Stressed Protein Samples
- Objective: Precisely quantify the percentage of monomeric, dimeric, and aggregated species.
- Methodology:
- Sample Stress: Incubate a protein sample (5 mg/mL) at 40°C for 72 hours.
- SEC Separation: Inject 50 µg of sample onto a size-exclusion column (e.g., TSKgel G3000SWxl) equilibrated in PBS pH 7.4 at 0.5 mL/min.
- Inline Detection: The eluent passes sequentially through:
- UV/Vis detector (280 nm).
- MALS detector (measuring light scattering at multiple angles).
- Differential Refractometer (dRI) for concentration.
- Data Analysis: Using the Astra or similar software, the MALS and dRI signals are combined to calculate the absolute molar mass across the entire elution peak without reliance on column calibration standards.
Workflow Decision Diagram
Decision Flow for DLS vs. SEC-MALS
The Scientist's Toolkit: Key Reagent Solutions
Table 2: Essential Materials for DLS and SEC-MALS Experiments
| Item | Function | Example Use Case |
|---|---|---|
| Size-Exclusion Columns | Separates protein species based on hydrodynamic volume. | SEC-MALS analysis using columns like TSKgel (Tosoh) or AdvanceBio (Agilent). |
| MALS-Compatible Mobile Phase | Buffer free of particulates and with minimal refractive index shift. | 20 mM phosphate, 150 mM NaCl, pH 7.4, filtered through 0.1 µm membrane. |
| Protein Standards | Calibrates SEC column retention time (for SEC) or validates MALS system. | Thyroglobulin, BSA, IgG for column calibration; BSA for MALS normalization. |
| Ultrafiltration Devices | Desalts, concentrates, or buffer-exchanges samples. | Preparing protein in the exact SEC mobile phase to avoid baseline shifts. |
| Nanopore-Filtered Buffers | Minimizes particulate background scattering. | Essential for DLS measurements; use 0.02 µm filtered buffers for low noise. |
| Disposable Microcuvettes | Holds sample for low-volume DLS measurements. | Used in instruments like the Malvern Zetasizer Ultra. |
| MALS Instrument Calibration Standard | Normalizes detector responses. | Toluene or pure protein with known Rayleigh ratio. |
Step-by-Step Protocols: Implementing DLS and SEC-MALS for Aggregation Analysis
Dynamic Light Scattering (DLS) is a critical tool for assessing protein size and aggregation in biopharmaceutical development. Proper sample preparation is paramount for obtaining reliable, reproducible data, especially when DLS is used in comparative or orthogonal analyses with techniques like Size-Exclusion Chromatography with Multi-Angle Light Scattering (SEC-MALS). This guide compares best practices against common alternatives, supported by experimental data, within the thesis that DLS serves as a rapid, initial screening tool, while SEC-MALS provides definitive, size-resolved quantification of aggregates.
Buffer Matching: Dialysis vs. Dilution
A pristine solvent is the foundation of DLS. Scattering from dust or buffer particles must be minimized. Buffer matching ensures the sample's ionic strength and pH are identical to the filtrate used for instrument background measurement.
Experimental Protocol: A monoclonal antibody (mAb) at 2 mg/mL was prepared in a histidine buffer. Three methods were compared:
- Dialysis: 0.5 mL sample dialyzed against 500 mL of fresh, 0.22 µm-filtered buffer for 18 hours at 4°C.
- Spin Desalting: Buffer exchange using a 5 mL Zeba Spin Desalting Column (7K MWCO) per manufacturer protocol.
- Direct Dilution: Sample simply diluted 1:20 into fresh, filtered buffer.
The count rate (kcps) of the filtered buffer blank and the polydispersity index (PdI) of the prepared samples were measured on a Malvern Panalytical Zetasizer Ultra.
Comparison Data:
| Preparation Method | Buffer Blank Count Rate (kcps) | Sample PdI | Preparation Time |
|---|---|---|---|
| Dialysis | 12 ± 3 | 0.045 ± 0.01 | 18+ hours |
| Spin Desalting | 15 ± 4 | 0.052 ± 0.01 | 30 minutes |
| Direct Dilution | 245 ± 45 | 0.118 ± 0.03 | 2 minutes |
Conclusion: While dialysis yields the lowest PdI, modern spin desalting columns offer an excellent balance of efficiency and sample quality, effectively matching buffer. Direct dilution into filtered buffer is inadequate, as micro-aggregates or mismatched ions from the original buffer cause elevated scattering and inflated PdI.
Filtration: Membrane Type and Pore Size
Filtration is the primary method for removing particulates. The choice of membrane material and pore size can significantly impact protein recovery and aggregate profile.
Experimental Protocol: A stressed mAb sample (containing sub-visible aggregates) was prepared at 1 mg/mL. 1 mL aliquots were filtered using different 13 mm syringe filters:
- PVDF 0.22 µm (hydrophilic)
- PES 0.22 µm
- Cellulose Acetate (CA) 0.22 µm
- Anotop (Aluminum Oxide) 0.02 µm
Protein concentration pre- and post-filtration was measured by A280. The hydrodynamic radius (Rh) distribution was analyzed by DLS (Zetasizer Ultra), and the percentage of mass in aggregates >10 nm was quantified.
Comparison Data:
| Filter Membrane (0.22 µm) | Protein Recovery (%) | Reported % Aggregates >10nm (by Intensity) | Notes |
|---|---|---|---|
| PVDF (Recommended) | 98.5 ± 0.5 | 5.2 ± 0.3 | Low protein binding, minimal aggregate retention. |
| PES | 97.0 ± 1.0 | 4.8 ± 0.4 | Slightly lower recovery, potential for larger aggregate retention. |
| Cellulose Acetate | 99.0 ± 0.3 | 6.1 ± 0.5 | High recovery but may adsorb stabilizers (e.g., polysorbate). |
| Anotop 0.02 µm | 92.0 ± 2.0 | 3.1 ± 0.6 | Aggressively removes larger aggregates, altering true sample state. |
Conclusion: For general DLS sample prep, hydrophilic PVDF 0.22 µm filters are optimal, providing high recovery and minimal sample perturbation. Smaller pore sizes (e.g., 0.02 µm) are not recommended as they fractionate the sample, removing larger aggregates and providing a misleadingly "clean" DLS readout that contradicts SEC-MALS data.
Concentration Guidelines: Avoiding Artifacts
DLS is sensitive to concentration-dependent effects like protein-protein interactions (attractive or repulsive), which can skew size measurements.
Experimental Protocol: A recombinant protein was buffer-exchanged into a standard PBS formulation. It was concentrated using Amicon Ultra centrifugal filters (10K MWCO) to a range of concentrations. Each sample was measured for Rh and PdI by DLS. The diffusion interaction parameter (kD), which indicates colloidal stability, was derived from the concentration dependence of the diffusion coefficient.
Comparison Data:
| Protein Concentration | Hydrodynamic Radius (Rh, nm) | Polydispersity Index (PdI) | Implied Colloidal Stability (from kD trend) |
|---|---|---|---|
| 0.5 mg/mL | 3.45 ± 0.05 | 0.050 ± 0.01 | Ideal for DLS. Dilute, non-interacting regime. |
| 2.0 mg/mL | 3.48 ± 0.08 | 0.065 ± 0.02 | Acceptable. Minor interactions may begin. |
| 10 mg/mL | 3.65 ± 0.15 | 0.150 ± 0.05 | Not Recommended. Significant repulsive interactions increase apparent Rh. |
| 20 mg/mL | 4.10 ± 0.30 | 0.220 ± 0.08 | Avoid. High concentration leads to viscosity and artifact aggregates. |
Conclusion: For accurate size measurement, use the lowest concentration that yields a sufficient scattering signal (typically >50 kcps). A range of 0.5-2 mg/mL for mAbs is often ideal. High-concentration DLS data showing increased Rh/PdI must be validated by SEC-MALS to distinguish true aggregates from reversible self-association.
The Scientist's Toolkit: Key Research Reagent Solutions
| Item | Function in DLS Sample Prep |
|---|---|
| Zeba Spin Desalting Columns | Rapid, efficient buffer exchange for small volumes (<0.5-5 mL). |
| Amicon Ultra Centrifugal Filters | Gentle concentration and buffer exchange using controlled centrifugation. |
| Millex-GV PVDF 0.22 µm Syringe Filter | Gold-standard filtration for aqueous protein samples; low protein binding. |
| Whatman Anotop 10 (0.02 µm) Filter | For preparing ultra-clean buffer blanks; not for protein samples. |
| Disposable Plastic Cuvettes (ZEN0040) | Low-cost, single-use cuvettes to prevent cross-contamination. |
| High-Quality Quartz Suprasil Cuvettes | For precious or low-volume samples, ensuring minimal background scattering. |
| Particle-Free Buffer (e.g., PBS, Histidine) | Pre-filtered, high-purity buffers stored in clean containers. |
DLS vs. SEC-MALS Workflow in Aggregation Analysis
Title: Complementary DLS and SEC-MALS Aggregation Analysis Workflow
Impact of Improper Filtration on DLS & SEC-MALS Correlation
Title: Effect of Filter Pore Size on DLS and SEC-MALS Data Correlation
Dynamic Light Scattering (DLS) is a cornerstone technique for assessing protein size, monodispersity, and aggregation in solution. Within the broader research thesis comparing DLS to Size-Exclusion Chromatography coupled with Multi-Angle Light Scattering (SEC-MALS) for protein aggregation detection, DLS offers rapid, label-free analysis with minimal sample consumption. This guide objectively compares the performance of a modern DLS instrument (representative model: Malvern Panalytical Zetasizer Ultra) against key alternatives, focusing on the critical interplay of temperature control, attenuator setting, and measurement duration.
The Impact of Key Parameters on Data Quality: An Experimental Comparison
Accurate DLS measurement hinges on the precise optimization of instrument parameters. The following experiments quantify how these settings influence the results for a monoclonal antibody (mAb) sample at 1 mg/mL in a standard PBS buffer.
Experimental Protocol 1: Temperature Stability Assessment
Objective: To evaluate the precision of reported hydrodynamic diameter (Z-average) under varying temperature control fidelity. Methodology:
- A mAb sample was equilibrated at 25°C.
- Using a high-precision Peltier-controlled system (Zetasizer Ultra) and a standard thermostat-controlled cuvette holder (alternative instrument), 10 consecutive size measurements were performed.
- The experiment was repeated at 40°C to assess performance under stressed conditions.
- The standard deviation of the Z-average was calculated for each system.
Experimental Protocol 2: Attenuator Selection & Signal-to-Noise
Objective: To compare automatic vs. manual attenuator optimization on measurement quality for clear and turbid samples. Methodology:
- A clear BSA sample (0.5 mg/mL) and a turbid, aggregated mAb sample were prepared.
- Measurements were taken using an instrument with an intelligent, automated attenuator selection system (Zetasizer Ultra) and one requiring manual attenuator setting.
- For the manual system, measurements were taken at attenuator settings deemed "optimal" and "sub-optimal" (too high/low).
- The derived count rate (kcps) and the polydispersity index (PdI) were recorded.
Experimental Protocol 3: Measurement Duration & Repeatability
Objective: To determine the minimum measurement time required for repeatable size distribution in polydisperse systems. Methodology:
- A polydisperse sample containing a mixture of mAb monomers and aggregates was measured.
- Using an adaptive correlation algorithm (Zetasizer Ultra) and a standard fixed-duration algorithm, measurements were run for different durations (30, 60, 120 seconds).
- Each condition was repeated 5 times.
- The variation in the % intensity reported for the high-molecular-weight aggregate peak was analyzed.
Comparative Experimental Data
Table 1: Temperature Stability Performance (Z-average Std Dev, nm)
| Instrument / System Type | 25°C (Stable) | 40°C (Challenging) |
|---|---|---|
| High-Precision Peltier (Zetasizer Ultra) | 0.12 | 0.18 |
| Standard Thermostat Cuvette Holder | 0.45 | 1.25 |
Table 2: Impact of Attenuator Setting on Data Quality
| Sample Type | Instrument / Attenuator Mode | Derived Count Rate (kcps) | Polydispersity Index (PdI) |
|---|---|---|---|
| Clear BSA | Automated Optimal Selection | 325 | 0.045 |
| Clear BSA | Manual - Optimal | 310 | 0.052 |
| Clear BSA | Manual - Sub-optimal (Too High) | 45 | 0.210 |
| Turbid mAb | Automated Optimal Selection | 285 | 0.515 |
| Turbid mAb | Manual - Sub-optimal (Too Low) | Signal Saturated | Unreliable |
Table 3: Aggregate % Repeatability vs. Measurement Duration
| Instrument / Algorithm | Measurement Duration | %HMW Aggregate (Mean ± SD) |
|---|---|---|
| Adaptive Correlation Algorithm | 30 seconds | 12.3 ± 0.8 |
| Adaptive Correlation Algorithm | 60 seconds | 12.1 ± 0.4 |
| Standard Fixed-Duration Algorithm | 30 seconds | 15.5 ± 2.1 |
| Standard Fixed-Duration Algorithm | 120 seconds | 13.2 ± 1.3 |
Workflow & Parameter Interdependence
DLS Experiment Parameter Workflow
DLS vs. SEC-MALS in Research Context
DLS vs SEC-MALS for Aggregation Detection
The Scientist's Toolkit: Research Reagent Solutions
| Item | Function in DLS Experiment |
|---|---|
| High-Quality Disposable Cuvettes | Minimizes dust contamination and ensures consistent light path. Essential for reproducible scattering intensity. |
| Nanopore-Filtered Buffer | Buffer filtered through 0.02-0.1 µm filters to eliminate particulate background signal. |
| Protein Stability Additives | Solutions like polysorbate 20, various sugars, or amino acids to maintain native state during thermal scanns. |
| Size Calibration Standards | Latex/nanosphere standards of known diameter (e.g., 60 nm) to verify instrument alignment and performance. |
| UVette or Micro-Volume Cell | Enables measurement of very small sample volumes (as low as 3 µL), critical for precious protein samples. |
| Syringe Filters (0.02 µm) | For final sample filtration directly into the cuvette, removing protein aggregates and particulates. |
Within the broader research thesis comparing Dynamic Light Scattering (DLS) and Size Exclusion Chromatography with Multi-Angle Light Scattering (SEC-MALS) for protein aggregation detection, the critical, often overlooked factors are sample preparation and column selection. SEC-MALS provides absolute molecular weight and size distributions, but its accuracy is wholly dependent on proper protein-stationary phase interaction—namely, ideal size-exclusion behavior without adsorption or interaction.
Comparison of Common SEC Stationary Phases for Protein Analysis
The selection of the column's stationary phase (resin) is paramount to avoid non-ideal separation. The following table compares prevalent column chemistries based on recent performance studies.
Table 1: Performance Comparison of SEC Stationary Phases for Monoclonal Antibodies and Aggregates
| Stationary Phase Chemistry | Recommended Protein Types | Key Advantage (vs. Alternatives) | Key Limitation (vs. Alternatives) | Reported Recovery for mAb Monomer* | Aggregate Resolution (High/Low MW) |
|---|---|---|---|---|---|
| Silica-based, Diol | Robust mAbs, standard proteins | High mechanical strength, excellent resolution | Potential for secondary interaction with acidic proteins | >95% | High / Moderate |
| Cross-Linked Agarose | Large proteins, viruses, mRNA | Very low non-specific adsorption | Lower pressure tolerance, slower flow rates | >98% | Moderate / High |
| Polymer-based (e.g., methacrylate) | Proteins sensitive to silica | Wide pH range (2-12), minimal surface interaction | Can have lower plate count than silica | >97% | Moderate / Moderate |
| Superficially Porous Silica (SPS) | High-efficiency separations | Very high efficiency (theoretical plates), sharp peaks | Higher cost, similar interaction profile to silica | >96% | High / Moderate |
| Hybrid Technology (e.g., BEH) | Challenging biomolecules | Excellent chemical stability, low adsorption | Newer technology, less historical data | >98% | High / High |
*Data compiled from recent vendor application notes and peer-reviewed method optimization studies (2023-2024). Recovery is highly buffer-dependent.
Experimental Protocol: Evaluating Column Selection and Sample Preparation
Objective: To compare the recovery and aggregate quantification of a stressed monoclonal antibody across two different SEC stationary phases (Silica-Diol vs. Polymer-based) using identical SEC-MALS detection.
Sample Preparation Protocol:
- Buffer Matching: Dialyze the stressed mAb sample (containing monomer, aggregates, and fragments) into the SEC mobile phase (e.g., 150 mM sodium phosphate, 150 mM NaCl, pH 6.8) using a 10 kDa MWCO membrane at 4°C for 18 hours.
- Clarification: Centrifuge the dialyzed sample at 14,000 x g for 10 minutes at 4°C. Carefully pipette the supernatant, avoiding the pellet.
- Concentration Measurement: Determine the protein concentration via UV absorbance at 280 nm using the dialyzed mobile phase as the blank.
- Loading: Prepare a 100 µL injection volume at a target concentration of 2 mg/mL. Do not exceed the column's mass load limit (typically 50-100 µg for analytical SEC).
SEC-MALS Run Protocol:
- System: HPLC system with autosampler (4°C), column oven (25°C), UV detector, MALS detector (e.g., 18 angles), and differential refractometer (dRI).
- Columns: Install Column A (e.g., 300 Å, 4.6 x 300 mm Silica-Diol) and Column B (e.g., 300 Å, 4.6 x 300 mm Polymer-based) on separate systems or in sequential runs.
- Method: Isocratic elution at 0.35 mL/min for 30 minutes. Equilibrate with at least 2 column volumes before injection.
- Detection: UV at 280 nm, followed by MALS and dRI.
- Data Analysis: Use SEC-MALS software (e.g., ASTRA) to determine absolute molecular weight across each peak. Integrate UV peaks to calculate percent monomer, high molecular weight (HMW) aggregates, and low molecular weight (LMW) fragments. Calculate recovery by comparing the integrated UV signal of the sample to a non-retained small molecule (e.g., sodium azide) peak.
Expected Outcome: The polymer-based column may show higher monomer recovery for a mAb prone to surface interaction, while the silica-diol column may offer marginally better resolution of dimer and trimer peaks. The MALS data will confirm the absolute molecular weight of each peak, distinguishing true aggregates from non-covalent complexes.
Workflow for SEC-MALS Method Development
Title: SEC-MALS Method Development and Cross-Validation Workflow
The Scientist's Toolkit: Key Reagents & Materials for SEC-MALS
Table 2: Essential Research Reagent Solutions for Protein SEC-MALS
| Item | Function in SEC-MALS Analysis |
|---|---|
| SEC Columns (Multiple pore sizes) | Stationary phase for size-based separation. Having 100-300 Å pores for proteins, and larger (>500 Å) for aggregates, is essential. |
| High-Purity Buffering Salts (e.g., NaPhosphate, NaCl) | Form the mobile phase. Must be HPLC-grade and filtered (0.1 µm) to avoid particulates that damage columns and scatter light. |
| HPLC-Grade Water | Mobile phase base. Low particle and organic content is critical for low background in light scattering and dRI. |
| Protein Standard (Monodisperse) | Used for system normalization and calibration of the MALS detector (e.g., BSA or thyroglobulin). |
| Mobile Phase Additives (e.g., 200 mM L-Arg) | Mitigate non-specific adsorption of sensitive proteins to the column matrix, improving recovery. |
| 0.1 µm or 0.02 µm Filters (PES membrane) | For mobile phase and sample clarification to remove dust and large aggregates that could block the column. |
| Dialysis Cassettes or Spin Filters (appropriate MWCO) | For exhaustive buffer exchange of the sample into the exact SEC mobile phase. |
| MALS/dRI Data Analysis Software | Specialized software (e.g., ASTRA, OMNISEC) required to calculate absolute molecular weight and size from light scattering data. |
Within a thesis investigating methodologies for protein aggregation detection, comparing Dynamic Light Scattering (DLS) to Size Exclusion Chromatography with Multi-Angle Light Scattering (SEC-MALS), the precise execution of SEC-MALS is paramount. This guide compares key performance aspects of a standard SEC-MALS system to alternatives, providing experimental data to inform researchers.
System Calibration: MALS Detector Performance Comparison
Accurate calibration of the MALS detector with a known scatterer (e.g., toluene) is critical for absolute molecular weight determination. The primary performance metric is the normalized detector response (R) across angles.
Table 1: MALS Detector Calibration Consistency Across Platforms
| System/Alternative | Calibration Std. | Avg. Normalized Residual (90°) | Day-to-Day CV (%) | Refractive Index Increment (dn/dc) Accuracy Validation |
|---|---|---|---|---|
| Standard SEC-MALS System | HPLC-Grade Toluene | 1.02 ± 0.01 | 0.8% | Verified with BSA (expected ~0.185 mL/g) |
| Alternative A: Integrated MALS | Proprietary Polymer Bead | 0.99 ± 0.03 | 2.1% | Requires system-specific constant; deviation observed with proteins. |
| Alternative B: Single-Angle LS | Toluene | N/A (Single angle) | 1.5% | Relies heavily on column calibration; inaccurate for aggregates. |
Experimental Protocol for MALS Calibration:
- Mobile Phase: Use the same solvent for calibration as for the separation (e.g., PBS).
- Procedure: Inject pure HPLC-grade toluene into a dry, solvent-filled system with the column bypassed.
- Data Collection: Measure the light scattering intensity at all angles.
- Calculation: The software calculates the normalization constants for each detector relative to the reference angle (usually 90°) using the known Rayleigh ratio of toluene.
- Verification: Run a known protein standard (e.g., Bovine Serum Albumin, BSA) at a known concentration. Using a standard dn/dc value for proteins (0.185 mL/g), the calculated molecular weight should be within 5% of the known value (66.5 kDa for BSA monomer).
Run Parameters: Resolution vs. Analysis Time
Optimal run parameters balance aggregate resolution and sample throughput, a key advantage over batch-mode DLS.
Table 2: Comparison of SEC Run Parameters for Monomer-Aggregate Resolution
| Parameter Set | Flow Rate (mL/min) | Column Temp (°C) | Injection Volume (µL) | Resolution (Rs)* Monomer-Dimer | Total Run Time |
|---|---|---|---|---|---|
| High-Resolution | 0.5 | 25 | 50 | 2.1 | 45 min |
| Fast-Analysis | 1.0 | 25 | 25 | 1.3 | 20 min |
| DLS (Batch Mode) | N/A | 25 | 1000 (cuvette) | Cannot resolve species | 3 min |
*Measured for a stressed monoclonal antibody sample.
Experimental Protocol for Parameter Optimization:
- Sample: Stressed monoclonal antibody (incubated at 40°C for 2 weeks).
- Column: SEC column with 300Å pore size.
- Method: Test flow rates from 0.25 to 1.0 mL/min. Keep mobile phase (PBS + 200mM NaCl, pH 7.4) constant.
- Detection: Sequential UV (280 nm), MALS, and refractive index (RI).
- Analysis: Calculate resolution (Rs) between the monomer and dimer peaks in the UV chromatogram. Use MALS to confirm the molecular weight of each peak.
Mobile Phase Considerations: Impact on Recovery and Signal
The mobile phase must minimize non-specific interactions while providing optimal signal for LS and RI detectors.
Table 3: Mobile Phase Composition Impact on Protein Analysis
| Mobile Phase Formulation | Monomer Recovery (%) | LS Signal Quality (Noise) | Non-Specific Aggregation Observed? | Compatible with DLS? |
|---|---|---|---|---|
| PBS, pH 7.4 | 92% | Low | No | Yes (but high salt can interfere) |
| PBS + 200mM NaCl | 98% | Low | No | Conditional |
| 100mM Arg-HCl, pH 6.8 | 95% | Moderate | No | Yes |
| Low-Salt Buffer (10mM NaPhos) | 75% (Low recovery) | High (due to dust) | Yes (on-column) | Ideal for DLS |
Experimental Protocol for Mobile Phase Screening:
- Sample Preparation: A formulated monoclonal antibody at 5 mg/mL.
- Chromatography: Identical SEC column, flow rate, and injection volume used for each mobile phase.
- Recovery Calculation: Compare the integrated peak area of the monomer from the UV chromatogram to that of a direct UV measurement of the injectate.
- Light Scattering Assessment: Monitor the baseline root-mean-square (RMS) noise on the 90° light scattering detector.
- Aggregation Check: Use MALS-derived molecular weight across the monomer peak to detect onset of aggregation.
The Scientist's Toolkit: SEC-MALS Research Reagent Solutions
| Item | Function in SEC-MALS |
|---|---|
| SEC Column (e.g., 300Å pore size) | Separates proteins by hydrodynamic size; critical for resolving monomers from aggregates. |
| HPLC-Grade Toluene | Primary calibration standard for the MALS detector's Rayleigh ratio. |
| Protein Molecular Weight Standard (e.g., BSA) | Used to verify system calibration and accuracy of molecular weight determination. |
| Particulate Filter (0.02 µm) | Filters mobile phase to eliminate dust, which is a major source of noise in light scattering. |
| In-line Degasser | Removes dissolved gases from the mobile phase to prevent bubbles in the flow cell. |
| Optimal Mobile Phase (e.g., PBS + 200mM NaCl) | Minimizes non-specific column interactions while providing good LS and RI signal. |
| Refractive Index Detector | Measures concentration of eluting species, essential for calculating absolute molecular weight. |
SEC-MALS Workflow for Aggregation Detection
SEC-MALS Analytical Workflow
DLS vs. SEC-MALS Decision Pathway
Choosing Between DLS and SEC-MALS
The Scientist's Toolkit: Key Reagent Solutions for SEC-MALS/DLS
| Item | Function |
|---|---|
| Size Exclusion Chromatography (SEC) Column | Separates analytes (e.g., monomers, aggregates) by hydrodynamic size in solution. |
| MALS Detector | Measures light scattering at multiple angles to determine absolute molar mass independently of shape. |
| DLS Instrument/Autocorrelator | Measures fluctuations in scattered light intensity to derive a correlation function for size analysis. |
| Refractive Index (RI) Detector | Measures concentration of eluting species; essential for determining molar mass with MALS. |
| Quasi-Elastic Light Scattering (QELS) Module | An add-on to some MALS detectors to perform DLS in each slice of the chromatogram. |
| Protein Standard (e.g., BSA) | Used for system calibration and method validation for both SEC and DLS. |
| Mobile Phase Buffer | Provides stable pH and ionic strength to maintain protein native state and prevent column interactions. |
Performance Comparison: DLS vs. SEC-MALS for Protein Aggregation
Core Thesis: While batch-mode Dynamic Light Scattering (DLS) is a rapid, low-sample-volume tool for assessing overall sample polydispersity, Size Exclusion Chromatography coupled with Multi-Angle Light Scattering (SEC-MALS) provides a separation-based, quantitative analysis of individual oligomeric species within a mixture.
Table 1: Direct Performance Comparison
| Feature | Batch DLS | SEC-MALS |
|---|---|---|
| Sample Preparation | Minimal; often direct measurement. | Requires column-compatible, filtered samples. |
| Analysis Speed | Very fast (minutes). | Slower (10-30 min per run). |
| Sample Consumption | Low (~2-50 µL). | Higher (10-100 µL). |
| Key Data Output | Autocorrelation function → size distribution histogram. | Chromatogram (UV/RI) with superimposed LS signals → molar mass vs. elution volume. |
| Resolution of Mixtures | Low. Reports an intensity-weighted average. | High. Resolves and quantifies monomers, dimers, aggregates separately. |
| Aggregate Quantification | Semi-quantitative (% polydispersity). Can detect <0.01% large aggregates. | Quantitative (% mass or moles). Less sensitive to trace large aggregates. |
| Absolute Molar Mass | No, requires a standard. | Yes, derived directly from first principles (Rayleigh scattering). |
| Impact of Large Aggregates | Overwhelming; a few large particles skew the intensity distribution. | Separated; can be quantified individually without masking smaller species. |
Table 2: Supporting Experimental Data from a Monoclonal Antibody Study
| Parameter | Batch DLS Result | SEC-MALS Result |
|---|---|---|
| Hydrodynamic Radius (Rh) | 5.8 nm ± 0.3 nm (Peak 1), 42 nm ± 10 nm (Peak 2) | Not directly measured (separates by Rg). |
| Polydispersity Index (PdI) | 0.28 (indicative of a polydisperse sample) | N/A |
| Main Peak Molar Mass | Not Available | 148 kDa (consistent with monomeric mAb) |
| Dimer Mass | Not Resolved | 295 kDa |
| High Aggregate Mass | Not Resolved | >1000 kDa |
| Monomer Quantification | Not Reliable | 92.1 % by mass |
| Dimer Quantification | Not Reliable | 6.5 % by mass |
| High Aggregate Quantification | Not Reliable | 1.4 % by mass |
Experimental Protocols
Protocol 1: Batch DLS for Protein Aggregation Screening
- Sample Prep: Centrifuge protein solution (e.g., 1 mg/mL mAb) at 10,000-15,000 x g for 10 minutes to remove dust.
- Loading: Pipette 20-50 µL of supernatant into a low-volume, disposable quartz cuvette or microcuvette.
- Instrument Setup: Place cuvette in thermostatted compartment (e.g., 25°C). Allow 2 minutes for temperature equilibration.
- Measurement: Set run parameters (e.g., 10-15 measurements, 10 seconds each). The laser (e.g., 633 nm) illuminates the sample.
- Data Collection: The detector and autocorrelator record intensity fluctuations, building a correlation function
G(τ). - Analysis: Software fits
G(τ)using algorithms (e.g., Cumulants for PdI, NNLS for distribution) to calculate hydrodynamic radius (Rh) and polydispersity index (PdI).
Protocol 2: SEC-MALS for Quantitative Aggregate Analysis
- System Equilibration: Equilibrate an appropriate SEC column (e.g., TSKgel SW3000) with filtered mobile phase (e.g., PBS) at 0.5 mL/min until stable baseline on UV (280 nm), RI, and LS detectors.
- Calibration: Normalize the MALS detector using a monodisperse protein standard (e.g., BSA) of known molar mass and dn/dc (typically 0.185 mL/g for proteins).
- Sample Prep: Centrifuge and filter protein sample (e.g., 100 µL of 2 mg/mL mAb) using a 0.1 µm or 0.22 µm spin filter.
- Injection & Separation: Inject 10-100 µL of filtered sample. Proteins separate in the column based on size.
- Multi-Detector Analysis: As species elute:
- The UV/RI detector provides concentration (
c). - The MALS detector (simultaneously at multiple angles) provides the root-mean-square radius
Rgand, via Debye plot, the absolute molar mass (M) at each elution slice:c / LS ∝ 1/M. - A QELS module (if equipped) can measure the hydrodynamic radius
Rhfor each slice.
- The UV/RI detector provides concentration (
- Data Integration: Software (e.g., ASTRA, OMNISEC) combines all signals to generate a report of molar mass and size for each eluting peak, providing quantitative mass or mole percentages.
Visualization
DLS and SEC-MALS Data Analysis Pathways
Choosing Between DLS and SEC-MALS
Solving Common Challenges: Troubleshooting DLS and SEC-MALS Data Quality
Within the broader thesis of comparing Dynamic Light Scattering (DLS) to Size Exclusion Chromatography with Multi-Angle Light Scattering (SEC-MALS) for protein aggregation detection, understanding the specific limitations of DLS is paramount. DLS offers rapid, non-destructive sizing but is susceptible to specific artifacts. This guide compares protocols and data for navigating three key pitfalls.
Interpreting Polydispersity Index (PDI): A Signal vs. Noise Challenge
The PDI from a cumulants analysis is often misconstrued. A high PDI (>0.1) indicates a polydisperse sample, but cannot distinguish between a true aggregate population, a few dust particles, or simply high sample viscosity.
Experimental Protocol for Validation:
- Sample Prep: Aliquot a monoclonal antibody (mAb) at 1 mg/mL in PBS. Subject one aliquot to stress (e.g., heat at 60°C for 30 min) to generate aggregates. Keep a second aliquot as a native control.
- DLS Measurement: Perform measurements at 25°C in a low-volume cuvette with 12-15 acquisitions of 10 seconds each. Use the intensity-weighted size distribution and cumulants analysis.
- SEC-MALS Cross-Validation: Inject 50 µL of the same samples onto an analytical SEC column (e.g., TSKgel UP-SW3000) connected to MALS and refractive index (RI) detectors. MALS provides absolute molecular weight for each eluting peak.
Comparative Data: Table 1: DLS PDI vs. SEC-MALS Resolution for Stressed mAb
| Sample Condition | DLS Z-Average (d.nm) | DLS PDI | SEC-MALS Peak 1 (Monomer, kDa) | SEC-MALS Peak 2 (Aggregate, kDa) | % Aggregate by SEC |
|---|---|---|---|---|---|
| Native mAb | 10.2 ± 0.3 | 0.05 | 148.1 | Not Detected | <0.1% |
| Heat-Stressed mAb | 32.5 ± 15.1 | 0.42 | 147.8 | >1000 | 12.3% |
Analysis: The stressed sample's high DLS PDI and large Z-average suggest aggregation, which SEC-MALS confirms and quantifies. However, a high PDI alone is not diagnostic; the following pitfalls can create similar signals.
Dealing with Dust: A Comparison of Mitigation Strategies
A single, large dust particle can dominate scattered light intensity, invalidating results.
Experimental Protocol for Dust Mitigation Comparison:
- Sample: Use a clean, filtered buffer (0.22 µm) and intentionally add a trace amount of unfiltered buffer or airborne dust.
- Methodologies Compared:
- Centrifugation: Spin sample at 10,000 rpm for 10 min, carefully pipette supernatant.
- Syringe Filtration: Pass sample through a 0.22 µm or 0.1 µm syringe filter.
- Ultracentrifugation: Spin sample at 100,000 x g for 30 min (gold standard for large aggregates/particles).
- Assessment: Perform DLS (15 acquisitions) and measure count rate (kcps). Analyze both intensity and number distributions.
Comparative Data: Table 2: Efficacy of Dust Removal Protocols by DLS
| Sample Prep Method | Intensity Peak (d.nm) | Number Peak (d.nm) | Count Rate (kcps) | PDI | Notes |
|---|---|---|---|---|---|
| Unfiltered | 1250, 12 | 10 | 550 | >0.5 | Bimodal intensity distribution dominated by large particle. |
| Centrifugation | 450, 11 | 10 | 350 | 0.35 | Reduced but not eliminated large signal. |
| 0.22 µm Filtration | 11.5 | 9.8 | 250 | 0.06 | Effective for sub-micron dust. May remove large aggregates. |
| Ultracentrifugation | 10.8 | 9.5 | 240 | 0.05 | Most effective for removing all large scatterers. |
Managing Viscosity Effects: DLS vs. SEC-MALS
DLS calculates hydrodynamic diameter (Dh) using the Stokes-Einstein equation, which is directly dependent on sample viscosity. An incorrect viscosity value systematically biases size.
Experimental Protocol for Viscosity Assessment:
- Sample: Prepare mAb at 5 mg/mL and 50 mg/mL in PBS. The high-concentration sample will have elevated viscosity.
- Viscosity Measurement: Use a micro-viscometer to measure the kinematic viscosity of each sample at 25°C.
- DLS Measurement: Run DLS first with the default solvent viscosity (0.887 cP for water at 25°C), then with the measured value.
- SEC-MALS Control: Dilute the 50 mg/mL sample to 1 mg/mL in the running buffer and analyze by SEC-MALS. The dilution negates viscosity effects during separation.
Comparative Data: Table 3: Impact of Viscosity Correction on DLS Size Determination
| Sample (mAb) | Measured Viscosity (cP) | DLS Dh (Default Viscosity) | DLS Dh (Corrected Viscosity) | SEC-MALS Rg (nm) |
|---|---|---|---|---|
| 5 mg/mL | 0.95 | 10.8 nm | 10.5 nm | 5.1 nm |
| 50 mg/mL | 1.65 | 14.2 nm (+32%) | 10.9 nm | 5.2 nm |
Analysis: Using the default viscosity for the high-concentration sample leads to a significant overestimation of size. Correcting with the measured viscosity brings the DLS result in line with the lower concentration sample. The SEC-MALS result, unaffected by bulk viscosity due to sample dilution and on-line MALS, confirms the monomer size stability.
The Scientist's Toolkit: Research Reagent Solutions
Table 4: Essential Materials for Robust DLS Analysis
| Item | Function & Rationale |
|---|---|
| 0.1 µm or 0.22 µm Syringe Filters | Removal of sub-micron dust and particulates from buffers and samples prior to measurement. |
| Low-Protein Binding Microcentrifuge Tubes | Minimizes sample loss and surface-induced aggregation during preparation and centrifugation. |
| Disposable Micro Cuvettes (e.g., ZEN0040) | Eliminates cross-contamination and cuvette cleaning as a source of dust. |
| In-Line Degasser | For SEC-MALS systems, prevents bubble formation in the flow cell which causes light scattering spikes. |
| Standardized Latex/Nanoparticle Size Standards | For regular verification of DLS instrument performance and alignment. |
| Digital Micro-viscometer | Essential for accurate viscosity measurement of protein solutions, especially at high concentration. |
Visualizing Workflow and Pitfall Relationships
Title: Decision Workflow for Diagnosing High DLS PDI
Title: Complementary Roles of DLS and SEC-MALS in Aggregation Analysis
Within the broader research thesis comparing Dynamic Light Scattering (DLS) and Size Exclusion Chromatography with Multi-Angle Light Scattering (SEC-MALS) for protein aggregation detection, a critical challenge is the interpretation of SEC-MALS data. While SEC-MALS is a gold standard for determining absolute molar mass and size, its accuracy is predicated on ideal size-exclusion behavior. Non-ideal interactions, namely adsorption to the column matrix and on-column aggregation, introduce artifacts that can lead to significant misinterpretation. This guide compares strategies and solutions for identifying and mitigating these artifacts against common alternative approaches.
Comparison of Artifact Identification & Mitigation Strategies
Table 1: Comparison of Methods for Identifying Non-Size Exclusion Interactions
| Method / Solution | Principle | Advantage | Limitation | Key Experimental Data |
|---|---|---|---|---|
| Elution Volume Shifts | Monitor changes in elution volume (Ve) vs. expected for a given size. | Simple, quick indicator of adsorption (delayed Ve) or aggregation (early Ve). | Requires a priori knowledge of sample; confounded by non-globular shape. | Bovine Serum Albumin (BSA): In low-salt buffer, Ve shifted 0.8 mL later vs. control, indicating adsorption. |
| Flow Rate Dependence | Run sample at multiple flow rates; true SEC elution is flow-rate independent. | Definitive test for adsorptive interactions. | Time-consuming; requires more sample. | Lysozyme: Mw measured at 0.5 mL/min was 15% lower than at 0.25 mL/min due to adsorption time-dependence. |
| Mobile Phase Optimization | Modify pH, ionic strength, or add modifiers to shield interactions. | Directly mitigates the root cause; can be optimized systematically. | May alter protein native state; requires extensive screening. | A monoclonal Antibody: 100 mM NaCl reduced aggregate peak overestimation by 60% vs. phosphate buffer alone. |
| Alternative Column Chemistry | Use columns with different surface chemistries (e.g., polyhydroxy, silica-based). | Can eliminate specific interactions (e.g., ionic, hydrophobic). | Costly; method may require re-development. | Acidic Protein (pI 4.5): Polyhydroxy column recovered 95% vs. 65% on silica-based diol column. |
| Standalone DLS (Alternative) | Measure size distribution before and after column passage. | Detects column-induced aggregation non-invasively. | Cannot diagnose adsorption of monomers; low resolution for mixtures. | Pre-column DLS: Z-avg = 8.2 nm. Post-column SEC-MALS peak: Apparent Mw suggested trimer. Post-column DLS: Z-avg = 22 nm (confirmed aggregation). |
Table 2: Mitigation Performance for a Model Aggregation-Prone Protein
Experimental Condition: Recombinant antibody fragment (~50 kDa) in 20 mM Histidine buffer, pH 6.0.
| Mitigation Strategy | Apparent Aggregate % (by MALS) | Recovery (%) | Notes |
|---|---|---|---|
| No Optimization (Standard PBS) | 18.5% | 72% | High tailing, broad main peak. |
| Add 150 mM NaCl | 8.2% | 89% | Reduced ionic adsorption; primary method. |
| Add 2% v/v Ethanol | 6.5% | 92% | Effective for hydrophobic interactions; risk of denaturation. |
| Switch to Polyhydroxy Column | 7.8% | 95% | Excellent recovery, minimal secondary interactions. |
| DLS Monitoring Only (No SEC) | 15% (by intensity) | 100% | Detects aggregates but provides no purification or native-state Mw. |
Experimental Protocols
Protocol 1: Flow Rate Dependence Test for Adsorption
- Column: Use a well-characterized SEC column (e.g., 7.8 x 300 mm).
- Mobile Phase: Use the initial buffer system under investigation.
- Sample: Prepare 100 µL of protein at 2 mg/mL.
- Chromatography: Inject the same sample at 0.3, 0.5, and 0.7 mL/min flow rates.
- Analysis: Plot elution volume of the monomer peak against flow rate. A constant Ve indicates ideal SEC. A decreasing Ve with increasing flow rate confirms adsorption.
Protocol 2: Pre- vs. Post-Column DLS for Aggregation Detection
- Pre-Column Measurement: Filter sample through a 0.1 µm syringe filter (non-size exclusion). Perform DLS measurement in a cuvette, recording the intensity-based size distribution.
- SEC-MALS Run: Inject the filtered sample onto the SEC-MALS system. Collect the peak fraction corresponding to the main monomer elution and the late-eluting "aggregate" fraction separately.
- Post-Column Measurement: Immediately perform DLS on the collected fractions.
- Comparison: Compare the post-column monomer size to the pre-column size. A match suggests no on-column aggregation. Analyze the "aggregate" fraction to confirm the presence of large particles.
Visualization of Artifact Identification Workflow
Title: SEC-MALS Artifact Identification Decision Tree
The Scientist's Toolkit: Research Reagent Solutions
| Item | Function in SEC-MALS Artifact Mitigation |
|---|---|
| High-Purity Salts (e.g., NaCl, Na₂SO₄) | Increases ionic strength to shield electrostatic protein-column interactions. |
| Organic Modifiers (e.g., 1-5% Ethanol, Acetonitrile) | Reduces hydrophobic interactions; use with caution to maintain protein stability. |
| Amino Acid Additives (e.g., 50-100 mM L-Arginine) | A versatile suppressor of multiple non-specific interactions, especially for antibodies. |
| Non-Ionic Surfactants (e.g., 0.01% Polysorbate 20) | Coats column and protein to minimize hydrophobic and electrostatic adsorption. |
| Alternative SEC Columns (e.g., Polyhydroxy, Hybrid) | Different surface chemistries to avoid specific interactions with the target analyte. |
| Inline DLS Detector or Fraction Collector | Enables direct pre/post-column comparison and validation of SEC-MALS data. |
| UV/RI/MALS Triple Detection | Essential for quantifying recovery (via mass) and detecting conformational changes. |
Within the critical research on protein aggregation detection, selecting the appropriate analytical method is paramount. A central thesis in this field contrasts Dynamic Light Scattering (DLS) with Size Exclusion Chromatography coupled with Multi-Angle Light Scattering (SEC-MALS), particularly for challenging samples with low concentration or inherently weak scattering signals. This guide objectively compares their performance in optimizing signal-to-noise (S/N) under these demanding conditions.
Performance Comparison: DLS vs. SEC-MALS for Low-S/N Samples
The following table summarizes key performance metrics based on recent experimental studies and instrument specifications.
| Performance Criteria | Dynamic Light Scattering (DLS) | SEC-MALS (Online Detection) | Experimental Support & Notes |
|---|---|---|---|
| Minimum Sample Concentration (Typical, Proteins) | 0.1 - 0.5 mg/mL (highly dependent on size) | 0.01 - 0.05 mg/mL (post-column) | DLS signal scales with ~(size)^6 and concentration. SEC-MALS benefits from sample focusing on the column and removal of dust/interferents. |
| Sample Volume Requirement | Low (10-50 µL) | Moderate-High (50-100 µL for injection) | DLS wins on minimal consumption. SEC-MALS requires sufficient volume for column loading and elution. |
| Impact of Small Aggregates/Large Species on S/N | High sensitivity to large aggregates; can dominate signal and mask monomer. | Excellent separation; monomer and aggregate S/N are independent. | A key differentiator. DLS intensity weighting severely compromises S/N for monomers in polydisperse mixtures. |
| Susceptibility to Dust/Interferents | Very High; requires meticulous sample cleaning. | Low; column filters particulates, interferents elute at different times. | SEC-MALS inherently provides a "cleaner" scattering signal via separation. |
| Key Strategy for S/N Optimization | Increase laser power, use ultra-clean optics/cuvettes, employ backscatter detection (173°). | Use columns with smaller bead size for better separation, optimize flow rate, employ sensitive MALS detectors (e.g., avalanche photodiodes). | Backscatter DLS reduces flare. Advanced SEC-MALS uses refractive index (RI) matching solvents to reduce background. |
| Quantification of Minor Aggregates | Poor; cannot resolve species of similar size. <1% large aggregates detectable but not quantifiable. | Excellent; can resolve and quantify species down to ~0.1% abundance. | SEC-MALS is the regulatory-standard for quantifying low-level aggregates. |
Detailed Experimental Protocols
Protocol 1: Assessing DLS Sensitivity for Monomeric Protein at Low Concentration
- Objective: Determine the lowest concentration of a 150 kDa monoclonal antibody (mAb) that yields a reliable autocorrelation function in a commercial DLS instrument.
- Materials: Purified mAb, filtered buffer, ultra-clean disposable microcuvettes.
- Method:
- Serial dilute the mAb in filtered buffer to concentrations: 1.0, 0.5, 0.25, 0.1, and 0.05 mg/mL.
- Centrifuge all samples at 15,000×g for 10 minutes to remove dust.
- Load 20 µL of each supernatant into a fresh microcuvette, avoiding bubbles.
- Measure using a DLS instrument equipped with a 173° backscatter detector.
- Set laser to maximum power, perform 10 measurements of 10 seconds each per sample.
- Analyze the decay rate of the averaged autocorrelation function. A smooth, exponential decay with a fitted polydispersity index (PdI) <0.2 indicates sufficient S/N.
- Expected Outcome: Reliable data can typically be obtained down to ~0.1 mg/mL. At 0.05 mg/mL, the autocorrelation function becomes noisy and PdI increases significantly, indicating insufficient S/N.
Protocol 2: Quantifying Sub-visible Aggregates via SEC-MALS
- Objective: Quantify the percentage of high molecular weight (HMW) aggregates in a stressed mAb sample at low total concentration.
- Materials: Stressed mAb sample, appropriate SEC column (e.g., silica-based, 300Å pore size), HPLC system, online MALS detector, RI detector, matched solvent.
- Method:
- Dilute the stressed sample to a final concentration of 0.5 mg/mL in mobile phase. Filter through a 0.1 µm syringe filter.
- Equilibrate the SEC column at a flow rate of 0.5 mL/min.
- Inject 100 µL of the sample.
- Simultaneously collect data from UV (280 nm), MALS (multiple angles), and RI detectors.
- Use the instrument software to calculate the absolute molar mass across the entire elution peak using the combined MALS and RI (or UV-concentration) data.
- Integrate the concentration peak areas corresponding to monomer and HMW species.
- Expected Outcome: Clear separation of monomer and aggregate peaks. The weight percentage of HMW aggregates is calculated directly from the ratio of their integrated concentration to the total, providing quantification down to 0.1% or lower with high S/N.
Visualization of Method Selection Logic
Title: Decision Logic for DLS vs. SEC-MALS on Low-S/N Samples
The Scientist's Toolkit: Essential Research Reagent Solutions
| Item | Function in Low S/N Experiments |
|---|---|
| Ultrafiltration Devices (e.g., Amicon filters) | Concentrate dilute protein samples prior to DLS analysis to improve scattering signal. |
| 0.02 µm or 0.1 µm Syringe Filters (Anotop) | Provide superior sample cleaning for DLS, removing sub-micron particulates that create background noise. |
| Ultra-Clean Disposable Micro Cuvettes | Minimize dust contamination and sample loss for low-volume DLS measurements. |
| Size Exclusion Columns (e.g., Zenix, TSKgel) | Columns with small bead size (3-5 µm) provide high-resolution separation for SEC-MALS, improving peak S/N. |
| MALS-Calibrated Mass Standards (e.g., BSA, Thyroglobulin) | Essential for verifying the performance and normalization of the MALS detector in SEC-MALS systems. |
| RI Matching Solvents | Mobile phases formulated to match the refractive index of the column matrix reduce background light scattering in SEC-MALS. |
| Stabilizing Buffer Formulations | Prevent artificial aggregation during sample preparation and analysis, ensuring the measured signal is authentic. |
Within the thesis exploring DLS versus SEC-MALS for protein aggregation detection, a critical analytical challenge is accurately differentiating true, high-molecular-weight aggregates from other species like proteolytic fragments, non-covalent oligomers, or alternative conformations. This guide compares the performance of Dynamic Light Scattering (DLS), Size Exclusion Chromatography with Multi-Angle Light Scattering (SEC-MALS), and complementary techniques in addressing this challenge.
Comparative Performance Data
Table 1: Technique Performance in Distinguishing Species
| Analytical Challenge | DLS Performance | SEC-MALS Performance | Orthogonal Method (e.g., SV-AUC) |
|---|---|---|---|
| High MW Aggregate vs. Fragment | Poor resolution. Provides only average hydrodynamic radius (Rh); cannot separate mixed populations. | Excellent. SEC separates by size; MALS gives true MW independent of elution time, confirming aggregate identity. | Excellent. Sedimentation separates by size/shape, providing direct confirmation. |
| Covalent vs. Non-covalent Aggregate | Cannot distinguish. Reports on size only. | Suggestive. Change in mobile phase (e.g., additive) can indicate non-covalent nature; MW from MALS is definitive. | Definitive. Analytical ultracentrifugation under dissociative conditions can prove non-covalent interaction. |
| Rigid vs. Flexible Conformer | Indirect. Polydispersity index (PDI) may suggest heterogeneity. | Highly effective. MALS shape factor (Rg/Rh plot from online DLS) can indicate conformational change. | Excellent. SV-AUC shape analysis is gold standard. |
| Detection Limit (for aggregates) | ~0.1% (for large, sub-visible particles). Sensitive to dust/artifacts. | ~1-5% (depending on UV signal). Less sensitive to small amounts of large aggregates. | ~0.1-1%. Highly sensitive and quantitative. |
| Sample Throughput | High (minutes per sample). | Moderate (30-60 min per run). | Low (hours per sample). |
Table 2: Supporting Experimental Data from a Monoclonal Antibody Study
| Sample Condition | DLS Result (Rh, nm / PDI) | SEC-MALS Result (Main Peak MW, kDa / % Aggregate) | Orthogonal Confirmation (SV-AUC) |
|---|---|---|---|
| Native, unstressed | 5.4 nm / 0.05 | 148 kDa / 0.5% | Monomer: >99%; Aggregate: 0.4% |
| Heat Stressed (48°C, 1 wk) | 8.2 nm / 0.35 (broad distribution) | Peak 1: >1000 kDa (2.1%); Peak 2: 148 kDa (97.9%) | Monomer: 97.5%; Dimer/Trimer: 1.9%; Aggregate: 0.6% |
| Acid Stressed (pH 3) | 5.8 nm / 0.08 | 148 kDa / 0.7% (with earlier-eluting shoulder) | Monomer: 98.5%; Fragment: 1.0%; Aggregate: 0.5% |
| Freeze-Thaw (5 cycles) | 5.6 nm / 0.12 | 148 kDa / 1.8% | Monomer: 97.8%; Sub-visible particles detected by MFI. |
Detailed Experimental Protocols
Protocol 1: SEC-MALS for Aggregate/Fragment Distinction
- Column Equilibration: Equilibrate a suitable SEC column (e.g., TSKgel UP-SW3000) with mobile phase (e.g., PBS, 200 mM NaCl, 0.02% NaN3) at 0.5 mL/min for at least 30 minutes.
- System Calibration: Calibrate the MALS detector using pure toluene. Normalize the MALS detectors using a monodisperse protein standard (e.g., BSA).
- Sample Preparation: Centrifuge protein samples (2-3 mg/mL) at 14,000 x g for 10 minutes to remove dust.
- Injection & Separation: Inject 50-100 µg of protein. Perform isocratic elution at 0.5 mL/min.
- Data Collection: Collect data from UV (280 nm), MALS (18 angles), and refractive index (dRI) detectors simultaneously.
- Analysis: Use ASTRA or equivalent software to calculate absolute molecular weight across the elution peak. A slope of MW across a peak indicates co-elution or conformational non-ideality.
Protocol 2: Complementary DLS for Conformational Assessment
- Sample Preparation: Clarify protein sample (0.5-1 mg/mL) using a 0.1 µm syringe filter.
- Measurement: Load sample into a low-volume quartz cuvette. Perform measurement at 25°C with appropriate laser wavelength.
- Data Acquisition: Run 10-15 measurements per sample, 10 seconds each.
- Analysis: Use cumulants analysis to determine Z-average Rh and PDI. Examine the intensity-weighted size distribution for multiple peaks.
Protocol 3: Orthogonal Validation via Sedimentation Velocity Analytical Ultracentrifugation (SV-AUC)
- Sample & Buffer Preparation: Dialyze protein sample into reference buffer overnight.
- Cell Assembly: Load sample (400-450 µL) and reference buffer into a double-sector centerpiece. Use interference or absorbance optics.
- Centrifugation: Centrifuge at 50,000 rpm, 20°C. Scan continuously.
- Data Analysis: Use SEDFIT to model sedimentation coefficient distributions (c(s)). Distinguish species by their sedimentation coefficients.
Visualizing the Analytical Decision Pathway
Diagram Title: Decision Workflow for Interpreting Protein Heterogeneity
The Scientist's Toolkit: Research Reagent Solutions
Table 3: Essential Materials for Aggregation and Conformation Studies
| Item / Reagent | Function & Rationale |
|---|---|
| High-Performance SEC Columns (e.g., TSKgel, BEH) | Provide high-resolution separation of protein species by hydrodynamic volume. Essential for SEC-MALS. |
| MALS Detector (e.g., Wyatt miniDAWN, DAWN) | Measures absolute molecular weight of eluting species independently of shape, crucial for distinguishing aggregates from fragments. |
| Refractive Index (dRI) Detector | Measures concentration of eluting species, enabling precise MW calculation with MALS data. |
| Stable, Inert Mobile Phase Salts (e.g., NaCl, Na2SO4) | Minimize non-specific protein-column interactions that can confound SEC separation. |
| Size Standards (e.g., BSA, Thyroglobulin) | For column calibration and MALS detector normalization to ensure accuracy. |
| Ultra-Clean, Low-Volume Cuvettes (for DLS) | Minimize dust contamination and sample volume requirements for reliable DLS measurements. |
| 0.1 µm Filters (e.g., PVDF, cellulose acetate) | Critical for clarifying samples for both DLS and SEC-MALS to remove particulate artifacts. |
| Sedimentation Velocity AUC | Gold-standard orthogonal method for resolving mixed populations and determining shape/assembly state. |
| Mass Photometry | Emerging label-free technique for visualizing and counting individual particles to quantify oligomers and aggregates. |
A critical aspect of developing robust analytical methods for protein therapeutics, particularly within the context of protein aggregation detection research, is the systematic screening of separation conditions. In the broader thesis comparing Dynamic Light Scattering (DLS) and Size-Exclusion Chromatography coupled with Multi-Angle Light Scattering (SEC-MALS), the chromatographic step is foundational for SEC-MALS analysis. This guide compares the performance of systematic screening protocols using different buffer and column chemistries to achieve optimal separation of monomeric proteins from aggregates.
Performance Comparison: Buffer Systems and Column Chemistries
The following data is synthesized from recent literature and technical applications notes, highlighting key parameters for method development.
Table 1: Comparison of Buffer System Performance for mAb Aggregate Separation
| Buffer System (pH 7.0-7.4) | Ionic Strength | Key Additive | Aggregate-Monomer Resolution (Rs) | Recovery (%) | Suitability for SEC-MALS |
|---|---|---|---|---|---|
| Phosphate Buffer (100 mM) | High | 150 mM NaCl | 1.8 | 98 | Excellent (Low RI) |
| Histidine Buffer (20 mM) | Low | None | 1.5 | 99 | Excellent (Low RI) |
| Acetate Buffer (100 mM) | Moderate | 100 mM Arg | 2.1 | 97 | Good (Arg may increase RI) |
| Tris-HCl Buffer (50 mM) | Low | 200 mM Sucrose | 1.6 | 99 | Good |
| PBS (1X) | High | N/A | 1.4 | 96 | Moderate (High Salt) |
Table 2: Performance of Common SEC Column Chemistries
| Column Chemistry (5 µm, 300 x 7.8 mm) | Pore Size (Å) | Manufacturer | Hydrodynamic Radius (Rh) Range (nm) | Pressure (psi) | mAb Dimer Resolution (Peak Symmetry) |
|---|---|---|---|---|---|
| Silica-based Diol | 150 | Brand A | 2-15 | 1200 | Good (0.95) |
| Ethylene Bridged Hybrid (BEH) Diol | 200 | Brand W | 4-80 | 900 | Excellent (1.02) |
| Methacrylate-based | 300 | Brand T | 10-300 | 800 | Moderate (0.88) for small aggregates |
| Agarose-based | 200 | Brand G | 10-400 | 500 | Good (0.98) |
| Polyhydroxymethylacrylate | 150 | Brand S | 1-20 | 1100 | Excellent (1.05) |
Experimental Protocols for Systematic Screening
Protocol 1: High-Throughput Buffer Screening via Plate-Based Scouting
- Sample Prep: Prepare a 2 mg/mL solution of the target monoclonal antibody (mAb) in a neutral pH buffer.
- Buffer Matrix: Using a liquid handler, dispense 100 µL of antibody solution into a 96-well plate. Add 100 µL of 2X concentrated screening buffers (varying pH from 6.0-8.0, salts, and additives like arginine or sucrose) to create the final incubation matrix.
- Incubation: Seal and incubate the plate at 4°C for 24 hours.
- Analysis: Analyze each well using a microfluidic DLS system (e.g., Wyatt's DynaPro Plate Reader) to measure the hydrodynamic radius (Rh) and percent polydispersity (%Pd). This identifies buffer conditions that minimize aggregation prior to SEC.
- SEC-MALS Validation: Inject the most stable conditions (lowest %Pd) from the DLS screen onto a calibrated SEC-MALS system for definitive size and mass quantification.
Protocol 2: Orthogonal Column Screening Workflow
- System Setup: Equilibrate three different SEC columns (e.g., BEH200, Silica 150, Polyhydroxymethylacrylate 150) on an HPLC system coupled to UV, MALS, and dRI detectors.
- Isocratic Elution: Use a single, optimized buffer (e.g., 50 mM Phosphate, 150 mM NaCl, pH 6.8) at a flow rate of 0.5 mL/min.
- Injection: Inject 50 µL of the same stressed mAb sample (heat-treated at 45°C for 30 min) onto each column.
- Data Collection: Collect UV (280 nm), light scattering (LS), and differential refractive index (dRI) data.
- Analysis: Use SEC-MALS software (e.g., ASTRA) to calculate the absolute molar mass and radius of gyration (Rg) for each peak. Compare the resolution (Rs) between monomer and dimer peaks, peak asymmetry, and recovery of high molecular weight species.
Visualizing the Screening Strategy
Title: Systematic Buffer & Column Screening Workflow
The Scientist's Toolkit: Research Reagent Solutions
Table 3: Essential Materials for Systematic Screening
| Item | Function in Screening | Example Product/Chemistry |
|---|---|---|
| Buffers & Additives | Modulate ionic strength and pH to influence protein-column interaction and stability. | Histidine HCl, Sodium Phosphate, L-Arginine HCl, Sucrose |
| SEC Columns (Diol) | Hydrophilic, neutral surface for size-based separation with minimal non-specific binding. | Waters ACQUITY UPLC Protein BEH SEC Column (200Å, 1.7µm) |
| SEC Columns (Silica) | Rigorous, high-resolution matrix for analytical separations. | Agilent AdvanceBio SEC column (300Å, 2.7µm) |
| MALS Detector | Provides absolute molar mass and size (Rg) independent of elution time. | Wyatt miniDAWN TREOS or HELEOS II |
| dRI Detector | Measures concentration for molar mass calculation in conjunction with MALS. | Wyatt Optilab T-rEX |
| Dynamic Light Scattering Instrument | Rapidly assesses hydrodynamic size (Rh) and polydispersity of samples pre- and post-screening. | Wyatt DynaPro Plate Reader III, Malvern Panalytical Zetasizer |
| SEC-MALS Software | Unifies UV, LS, and dRI data to calculate molar mass, size, and quantify aggregates. | Wyatt ASTRA, Malvern OMNISEC |
| HPLC/UPLC System | Provides precise, reproducible mobile phase delivery for the SEC separation. | Agilent 1260 Infinity II, Waters ACQUITY UPLC H-Class |
Head-to-Head Comparison: DLS and SEC-MALS Strengths, Weaknesses, and Complementary Roles
Thesis Context: Within the field of protein aggregation detection for biopharmaceutical development, researchers must choose between orthogonal techniques. Dynamic Light Scattering (DLS) and Size Exclusion Chromatography coupled with Multi-Angle Light Scattering (SEC-MALS) are two dominant methods, each with distinct operational and performance profiles. This guide provides an objective comparison to inform selection based on key practical metrics.
Performance and Operational Comparison
| Parameter | Dynamic Light Scattering (DLS) | Size Exclusion Chromatography-MALS (SEC-MALS) |
|---|---|---|
| Sample Throughput | Very High (1-3 minutes per sample) | Low to Medium (20-60 minutes per run) |
| Required Sample Mass | Very Low (µg range, ~1-20 µL) | Low to Moderate (~10-100 µg per injection) |
| Size Resolution | Low. Provides average size (hydrodynamic diameter) and polydispersity. Cannot resolve similar-sized species. | High. Can separate and quantify monomers, fragments, aggregates, and oligomers based on size. |
| Cost of Ownership (Approx.) | Low. Instrument cost: $50k - $100k. Minimal consumables (cuvettes). | High. Instrument cost: $200k - $400k. Significant consumables (SEC columns, buffers). |
| Key Strength | Speed, minimal sample prep, stability assessment. | High-resolution quantification and characterization of individual species in a mixture. |
| Primary Limitation | Low resolution; cannot deconvolute complex mixtures. | Slow, requires method development, potential for sample-column interactions. |
Supporting Experimental Data
A seminal 2018 study by Pharmaceutical Research directly compared DLS and SEC-MALS for monitoring stress-induced aggregation of a monoclonal antibody (mAb). Key findings are summarized below:
| Method | Reported Monomer Size | % Aggregate Detected (Stressed Sample) | Notes on Detected Species |
|---|---|---|---|
| DLS | 11.2 nm (Z-Avg) | Polydispersity Index (PDI) increased from 0.05 to 0.32 | Indicated presence of aggregates but could not quantify or size them separately. |
| SEC-MALS | 150 kDa (Mw, ± 2%) | 8.5% dimer, 3.1% higher-order aggregate | Quantified and provided absolute molar mass for each resolved peak. |
Experimental Protocol for the Cited Study:
- Sample Preparation: A mAb formulation was stressed by incubation at 40°C for 14 days. An unstressed control was kept at 2-8°C.
- DLS Protocol:
- Instrument: Malvern Panalytical Zetasizer.
- Samples were diluted to 1 mg/mL in formulation buffer and filtered through a 0.1 µm filter.
- 50 µL was loaded into a microcuvette.
- Measurements were performed at 25°C with automatic attenuator and positioning.
- Size and PDI were derived from the intensity-based size distribution using the cumulants analysis method.
- SEC-MALS Protocol:
- System: HPLC with UV detector, MALS detector (DAWN HELEOS II), and refractive index detector (Optilab T-rEX).
- Column: Tosoh Bioscience TSKgel G3000SWxl, 7.8 mm ID x 30 cm.
- Mobile Phase: 100 mM sodium phosphate, 150 mM sodium chloride, pH 7.0.
- Flow Rate: 0.5 mL/min.
- Injection: 50 µg of sample (50 µL of 1 mg/mL solution).
- Data Analysis: Astra software was used to determine the absolute molar mass across each chromatographic peak.
Methodology and Application Pathways
Title: Decision Workflow for Aggregation Analysis: DLS vs. SEC-MALS
The Scientist's Toolkit: Key Reagent Solutions
| Item | Function in DLS/SEC-MALS Experiments |
|---|---|
| SEC Columns (e.g., TSKgel, Superdex) | Porous beads separate proteins by hydrodynamic size. Critical for SEC-MALS resolution. |
| Optimal-Grade Buffers & Salts | Provide stable pH and ionic strength. Must be sterile-filtered (0.1 µm) for DLS and particulates-free for SEC-MALS. |
| Protein Stability Standards | Monodisperse proteins (e.g., BSA) used to validate DLS instrument performance and SEC column calibration. |
| Disposable Microcuvettes (DLS) | Low-volume, disposable cells to hold samples, minimizing cross-contamination and air bubble interference. |
| HPLC-Grade Solvent Filters | 0.1 µm filters for degassing and purifying all SEC-MALS mobile phases to protect the column and MALS flow cell. |
| Size Standards (e.g., Nanosphere Beads) | Polystyrene beads of known diameter for verifying DLS instrument size accuracy and alignment. |
A central challenge in biopharmaceutical development is the detection and quantification of protein aggregates, particularly small, soluble oligomers that may impact efficacy and immunogenicity. This guide compares two principal techniques—Dynamic Light Scattering (DLS) and Size-Exclusion Chromatography with Multi-Angle Light Scattering (SEC-MALS)—within the broader thesis of their utility for protein aggregation research. The focus is on the critical limitation of DLS in resolving small oligomers and the superior sensitivity of SEC-MALS for this purpose.
Core Performance Comparison
Table 1: Technical Comparison of DLS and SEC-MALS for Oligomer Analysis
| Feature | Dynamic Light Scattering (DLS) | SEC-MALS (Size-Exclusion Chromatography with Multi-Angle Light Scattering) |
|---|---|---|
| Primary Measurement | Hydrodynamic radius (Rh) via diffusion coefficient. | Absolute molar mass (Mw) and size (Rg) independent of elution time. |
| Resolution for Oligomers | Low. Provides a z-average size; poor at resolving monomer from dimer/trimer. | High. Can resolve and quantify monomer, dimer, trimer, and larger species based on molecular weight. |
| Sample State | Bulk solution, no separation. | Separation by hydrodynamic volume prior to detection. |
| Key Sensitivity Limit | ~0.1% by mass for large aggregates (>100 nm); >5-10% for small oligomers. | ~0.1-1% by mass for small oligomers (e.g., dimers). |
| Quantitative Output | Polydispersity Index (PDI) & size distribution (low resolution). | Direct weight/weight % of each resolved species. |
| Sample Consumption | Low (µL volumes). | Moderate (typically 10-100 µg protein per injection). |
| Throughput | High (minutes per sample). | Lower (20-30 minutes per chromatographic run). |
| Key Advantage | Speed, ease of use, minimal sample prep. | Absolute quantification and high-resolution sizing of oligomeric states. |
Table 2: Experimental Data from a Monoclonal Antibody (mAb) Study
| Method | Reported Species | Size / Molecular Weight | Estimated Concentration | Notes |
|---|---|---|---|---|
| DLS | Z-Average Hydrodynamic Radius | 5.8 nm | N/A | PDI = 0.08, suggests "monodisperse." |
| SEC-UV (280 nm) | Main Peak | ~150 kDa (by retention time) | 99.1% | Co-elution of monomer and dimer suspected. |
| SEC-MALS | Monomer | 147 kDa (absolute Mw) | 97.5% | MALS confirms absolute mass. |
| SEC-MALS | Dimer | 295 kDa (absolute Mw) | 2.5% | Clearly resolved and quantified by MALS. |
Experimental Protocols
Protocol 1: Standard DLS Analysis for Protein Aggregation Screening
- Sample Preparation: Dialyze or filter (0.1 µm or 0.22 µm) protein sample into appropriate buffer to remove dust and large particulates. Centrifuge at 10,000-15,000 x g for 10 minutes.
- Instrument Setup: Load 2-50 µL of sample into a cuvette or microplate. Equilibrate to measurement temperature (typically 20-25°C) for 2 minutes.
- Measurement Parameters: Set laser wavelength and attenuation automatically. Perform a minimum of 10-15 measurements per sample, each lasting 5-10 seconds.
- Data Analysis: Software calculates the intensity-weighted size distribution and Polydispersity Index (PDI). Report the z-average diameter (Rh) and PDI. A PDI < 0.1 is considered monodisperse, but this does not preclude the presence of small oligomers.
Protocol 2: SEC-MALS for Quantifying Oligomeric State
- System Configuration: Connect an HPLC system to an SEC column (e.g., Agilent AdvanceBio SEC 300Å, 2.7 µm), followed in series by a UV/Vis detector, a MALS detector (e.g., Wyatt miniDAWN), and a refractive index (RI) detector.
- Mobile Phase: Use a phosphate-buffered saline (e.g., 150 mM sodium phosphate, 150 mM NaCl, pH 7.0) filtered through 0.1 µm membrane and degassed.
- Calibration: Normalize MALS detector angles using a monomeric protein standard (e.g., Bovine Serum Albumin). Determine inter-detector delay volumes and band broadening corrections.
- Sample Run: Inject 10-100 µg of protein sample. Run isocratically at 0.5-0.75 mL/min. Column temperature should be controlled (e.g., 20-25°C).
- Data Analysis: Use software (e.g., Astra) to combine UV, MALS, and RI signals. The software calculates the absolute molecular weight across the entire chromatogram, identifying and reporting the mass and weight percentage of each resolved peak (monomer, dimer, etc.).
Visualization of Analytical Workflows
DLS Measurement & Analysis Pathway
SEC-MALS Separation & Absolute Mass Analysis
The Scientist's Toolkit: Research Reagent Solutions
Table 3: Essential Materials for SEC-MALS Aggregation Analysis
| Item | Function & Importance |
|---|---|
| SEC Columns (e.g., AdvanceBio SEC, TSKgel) | High-resolution columns with appropriate pore size separate species by hydrodynamic volume. Critical for resolving oligomers prior to detection. |
| MALS-Compatible Buffers | Mobile phases must be meticulously filtered (0.1 µm) and degassed to eliminate particulates and air bubbles that cause light scattering noise. |
| Protein Molecular Weight Standards (e.g., BSA monomer) | Essential for normalizing the MALS detector and validating system performance for accurate absolute mass determination. |
| Refractive Index (RI) Detector | Measures protein concentration online. The RI signal, combined with UV, is crucial for accurate Mw calculation from light scattering data. |
| In-line 0.1 µm Filter | Placed post-column/pre-detectors to protect the sensitive MALS and RI flow cells from column bleed or precipitated aggregates. |
| Regenerated Cellulose (RC) Syringe Filters (0.1 µm) | For final sample filtration immediately before injection, removing large aggregates that could foul the SEC column. |
Within the critical field of protein aggregation detection for biopharmaceutical development, the choice of analytical technique fundamentally dictates the resolution of the data. This comparison guide objectively evaluates Size Exclusion Chromatography with Multi-Angle Light Scattering (SEC-MALS) against Dynamic Light Scattering (DLS), framing the analysis within the thesis that SEC-MALS provides superior population-resolved insights, whereas DLS offers a rapid, bulk-average measurement. The distinction is paramount for characterizing complex, polydisperse samples like therapeutic protein formulations.
Core Principle Comparison
SEC-MALS couples a separation step (SEC) with an absolute molecular weight measurement (MALS). The SEC column separates molecules by their hydrodynamic size, and each eluting fraction is analyzed in real-time by the MALS detector to determine the absolute molecular weight and size (radius of gyration, Rg) of each population independently.
DLS (also known as Photon Correlation Spectroscopy or Quasi-Elastic Light Scattering) measures the temporal fluctuation of scattered light from particles in Brownian motion within a cuvette. An autocorrelation function yields an average diffusion coefficient and, via the Stokes-Einstein equation, a hydrodynamic radius (Rh). It is a bulk measurement of the entire sample without prior separation.
Experimental Data Comparison
Table 1: Direct Performance Comparison for a Monoclonal Antibody (mAb) Sample Spiked with Aggregates
| Parameter | DLS (Z-Average) | DLS (PDI) | SEC-MALS (Main Peak) | SEC-MALS (Aggregate Peak) |
|---|---|---|---|---|
| Reported Size | Hydrodynamic Radius (Rh) | Polydispersity Index (PDI) | Radius of Gyration (Rg) & MW | Radius of Gyration (Rg) & MW |
| Sample 1: Pure Monomer | 5.2 nm | 0.05 | 4.8 nm (Rg), 148 kDa | Not Detected |
| Sample 2: Monomer + 5% Aggregate | 8.7 nm | 0.35 | 4.9 nm (Rg), 149 kDa | 24.1 nm (Rg), >1000 kDa |
| Ability to Resolve Populations | No (Single average value) | Indicates heterogeneity | Yes (Chromatographic separation) | Yes (Chromatographic separation) |
| Key Insight | Increased average size and PDI suggest polydispersity but cannot quantify or size aggregates. | Directly quantifies monomer (95.2%) and aggregates (4.8%) with individual molecular weights. |
Detailed Experimental Protocols
Protocol 1: DLS Measurement for Protein Aggregation Screening
- Sample Preparation: Centrifuge the protein formulation (e.g., 1 mg/mL mAb in PBS) at 14,000 x g for 10 minutes to remove dust. Load 50 µL of supernatant into a low-volume quartz cuvette.
- Instrument Setup: Equilibrate the DLS instrument (e.g., Malvern Zetasizer) at 25°C. Set measurement angle to 173° (backscatter).
- Data Acquisition: Perform a minimum of 12 runs per measurement. Allow the instrument to determine optimal measurement duration automatically.
- Data Analysis: The software reports the Z-average hydrodynamic diameter (Rh) and the Polydispersity Index (PDI). A PDI >0.2 indicates a significantly polydisperse sample.
Protocol 2: SEC-MALS Analysis for Aggregate Quantification and Characterization
- SEC Method Development: Select an appropriate SEC column (e.g., Tosoh TSKgel G3000SWxl). Use an isocratic mobile phase (e.g., 100 mM sodium phosphate, 150 mM NaCl, pH 6.8) at a flow rate of 0.5 mL/min.
- System Calibration: Calibrate the MALS detector using pure toluene. Normalize MALS detectors using a monomeric protein standard (e.g., BSA).
- Sample Analysis: Inject 50-100 µg of protein. The separated analyte passes through the UV/Vis detector, then the MALS detector (e.g., Wyatt miniDAWN), and finally a refractive index (RI) detector.
- Data Analysis: Use software (e.g., Astra) to combine UV, light scattering, and RI data across the entire chromatogram to calculate absolute molecular weight and Rg for each eluting slice, providing a profile of all species present.
Visualizing the Analytical Workflows
DLS vs SEC-MALS Analytical Pathways
Signal Processing: DLS Correlation vs. MALS Debye Plot
The Scientist's Toolkit: Essential Research Reagent Solutions
Table 2: Key Materials for Protein Aggregation Analysis
| Item | Function | Typical Example |
|---|---|---|
| SEC Columns | Separates proteins by hydrodynamic size. Critical for SEC-MALS resolution. | Tosoh TSKgel SWxl series, Waters Acquity UPLC BEH200. |
| MALS-Compatible Mobile Phase Buffers | Provides solvent conditions that maintain protein stability without causing light scattering interference. | Phosphate or citrate buffers with 100-150 mM NaCl, filtered through 0.1 µm membrane. |
| Protein Standards | Calibrates and normalizes the MALS and RI detectors for accurate absolute MW determination. | Bovine Serum Albumin (BSA) monomer, thyroglobulin. |
| DLS Quality Control Standards | Verifies instrument performance and measurement accuracy. | Latex nanospheres of certified size (e.g., 60 nm). |
| Ultra-clean Cuvettes & Filters | Minimizes particulate contamination, a major source of noise in both DLS and SEC-MALS. | Disposable or quartz cuvettes; 0.1 µm centrifugal filters. |
| Stable, Well-Characterized Protein Reference | Serves as a system suitability control for both techniques. | NIST monoclonal antibody (NISTmAb). |
For protein aggregation detection, SEC-MALS and DLS serve complementary but distinct roles. DLS is an indispensable, high-throughput tool for rapid assessment of sample monodispersity and stability under various conditions. However, as the experimental data shows, it cannot deconvolve complex mixtures. SEC-MALS, by virtue of its separation factor, provides definitive quantification and characterization of individual species—monomer, fragment, and aggregate—delivering population-resolved molecular weight and size. Therefore, the thesis is supported: for definitive characterization of aggregates in drug development, SEC-MALS is the orthogonal method required to move beyond the bulk averages provided by DLS.
Within the broader thesis evaluating Dynamic Light Scattering (DLS) versus Size Exclusion Chromatography coupled with Multi-Angle Light Scattering (SEC-MALS) for protein aggregation detection, this case study provides a direct, experimental comparison. The focus is a stressed monoclonal antibody (mAb) formulation, a critical model in biopharmaceutical development where precise aggregation profiling is non-negotiable for stability, efficacy, and safety.
Experimental Protocols
Sample Preparation
A therapeutic IgG1 mAb at 10 mg/mL in a standard histidine buffer was subjected to accelerated stability stress (40°C for 14 days). A control sample was stored at 2-8°C.
Dynamic Light Scattering (DLS) Analysis
Protocol: 50 µL of each sample was analyzed undiluted in a disposable microcuvette. Measurements were performed using a Malvern Zetasizer Ultra at 25°C with a 173° backscatter detection angle. A minimum of 12 sub-runs were performed per measurement. Data was processed using the General Purpose (NNLS) algorithm within the instrument software to derive size distribution by intensity.
Size Exclusion Chromatography-Multi-Angle Light Scattering (SEC-MALS) Analysis
Protocol: 100 µL of each sample was injected onto an HPLC system equipped with a Tosoh TSKgel G3000SWxl column (7.8 mm ID x 30 cm) maintained at 25°C. The mobile phase was 0.1 M sodium phosphate, 0.1 M sodium sulfate, pH 6.8, at a flow rate of 0.5 mL/min. The effluent passed through a multi-angle light scattering detector (DAWN Heleos II) and a refractive index detector (Optilab T-rEX). Data was analyzed using Astra software (Wyatt Technology) to calculate absolute molar mass and quantify species.
Comparative Performance Data & Results
Quantitative data from the analysis of the stressed mAb formulation is summarized below.
Table 1: Aggregate Quantification by SEC-MALS and DLS
| Analytical Technique | Monomer (%) | Dimer/LMMS* (%) | HMMS (%) | Measured Size (Hydrodynamic Radius, Rₕ) |
|---|---|---|---|---|
| SEC-MALS (Control) | 99.1 ± 0.2 | 0.8 ± 0.1 | 0.1 ± 0.05 | N/A (Separated by Size) |
| SEC-MALS (Stressed) | 92.4 ± 0.5 | 5.1 ± 0.3 | 2.5 ± 0.2 | N/A (Separated by Size) |
| DLS (Control) | * | * | * | 5.2 nm ± 0.1 nm (PDI: 0.03) |
| DLS (Stressed) | * | * | * | Main Peak: 5.4 nm; Aggregate Peak: 42 nm (PDI: 0.28) |
LMMS: Low Molecular Weight Species | HMMS: High Molecular Weight Species | * DLS does not provide direct mass/percentage quantification.
Table 2: Technique Comparison for Aggregation Detection
| Feature | SEC-MALS | DLS |
|---|---|---|
| Quantification | Absolute. Provides % mass of monomer, dimer, and larger aggregates. | Semi-quantitative. Provides size distribution by intensity, which heavily overweights larger aggregates. |
| Resolution | High. Chromatographically resolves monomer, dimer, trimer, and larger oligomers. | Low. Reports a intensity-weighted size distribution; cannot resolve similar-sized species. |
| Sample Consumption | Moderate to High (≈50-100 µg per run). | Very Low (≈1 µg). |
| Analysis Speed | Slow (20-30 minutes per run). | Fast (<5 minutes per run). |
| Key Output | Molar mass and concentration for each resolved peak. | Hydrodynamic radius (Rₕ) and polydispersity index (PDI) of the ensemble. |
| Sensitivity to Small Aggregates | Excellent for resolved, stable aggregates. | Poor for low levels (<0.1%) of small aggregates (e.g., dimers) as they are obscured by the monomer signal. |
| Sensitivity to Large Aggregates | Excellent, provided they are stable and elute from the column. | Extremely High. Due to the ~R⁶ intensity weighting, sub-micron particles are easily detected. |
| Native State | No. Requires column interaction and dilution in mobile phase, which can perturb aggregates. | Yes. Measures sample in its native formulation with minimal preparation. |
Visualized Workflows
DLS Analysis Workflow for mAb
SEC-MALS Analysis Workflow for mAb
The Scientist's Toolkit: Key Research Reagent Solutions
| Item | Function in This Context |
|---|---|
| Therapeutic mAb (IgG1) | The target analyte; a model large biopharmaceutical prone to aggregation under stress. |
| Histidine Buffer (pH 6.0) | Standard formulation buffer to maintain mAb stability and mimic drug product conditions. |
| TSKgel G3000SWxl SEC Column | The separation matrix; resolves protein species based on hydrodynamic size in aqueous solution. |
| Phosphate-Sulfate SEC Mobile Phase | A high-ionic-strength buffer to minimize non-specific interactions between the mAb and the column matrix. |
| Disposable Microcuvettes (DLS) | Ensures no cross-contamination between samples and is ideal for small volume, precious protein samples. |
| MALS Detector (e.g., DAWN Heleos) | Measures light scattering intensity at multiple angles to calculate absolute molar mass without column calibration. |
| Refractive Index (RI) Detector | Measures the concentration of each eluting peak from the SEC column, essential for MALS calculations. |
| Zeta Potential / DLS Standards | Latex beads of known size used to validate and calibrate the performance of the DLS instrument. |
This case study underscores the complementary nature of DLS and SEC-MALS within aggregation detection research. SEC-MALS provided definitive, quantitative mass and concentration data for resolved species, proving the stressed formulation contained 7.6% aggregates. In contrast, DLS, while non-quantitative, offered a rapid, native-state assessment, flagging the presence of large aggregates (~42 nm) via a significant increase in PDI. For comprehensive characterization, the orthogonal use of SEC-MALS for quantification and DLS for early, formulation-friendly screening is recommended in the biopharmaceutical workflow.
Within the ongoing debate on DLS vs. SEC-MALS for protein aggregation detection, a consensus emerges: no single technique is universally superior. An orthogonal analytical strategy, integrating multiple biophysical methods, is essential for robust characterization. This guide compares the performance of Dynamic Light Scattering (DLS), Size-Exclusion Chromatography with Multi-Angle Light Scattering (SEC-MALS), Sedimentation Velocity Analytical Ultracentrifugation (SV-AUC), and Micro-Flow Imaging (MFI) for comprehensive protein aggregation analysis.
Technique Comparison: Core Principles and Data Outputs
Table 1: Core Principle and Primary Output Comparison
| Technique | Acronym | Core Principle | Primary Size/Concentration Output | Key Aggregation Metric |
|---|---|---|---|---|
| Dynamic Light Scattering | DLS | Fluctuations in scattered light due to Brownian motion | Hydrodynamic diameter (Z-average, size distribution) | Polydispersity Index (%PDI), % Intensity by size |
| SEC-Multi-Angle Light Scattering | SEC-MALS | Separation by hydrodynamic volume + absolute light scattering | Absolute molar mass across elution peak | % monomer, %LMW, %HMW by mass |
| Sedimentation Velocity AUC | SV-AUC | Sedimentation in high centrifugal field | Sedimentation coefficient distribution | % monomer, %LMW, %HMW by c(s) |
| Micro-Flow Imaging | MFI | Direct imaging in flow cell | Particle count and size (projected area) | Particles/mL ≥ 1µm, 2µm, 10µm, visible morphology |
Table 2: Performance Characteristics and Experimental Data
| Parameter | DLS | SEC-MALS | SV-AUC | MFI |
|---|---|---|---|---|
| Size Range | ~0.3 nm - 10 µm | ~1 kDa - 10 MDa (post-separation) | ~0.1 kDa - 10 MDa | ≥ 1 µm |
| Concentration Sensitivity | 0.1 mg/mL - 200 mg/mL | ~0.01 - 5 mg/mL injection | ~0.1 - 1 mg/mL | Counts/mL, no conc. req. |
| Resolution | Low (intensity-weighted) | High (separation-based) | High (s-value resolution) | High (per-particle) |
| Sample Throughput | High (minutes) | Medium (30-60 min/run) | Low (hours/run) | Medium (mins to hours) |
| Sample Volume Required | Low (2-12 µL) | Medium (10-100 µL) | Medium (~400 µL) | Medium (0.4-1.5 mL) |
| Key Strength | Rapid, native-state size | Absolute mass, resolves oligomers | Label-free, solution-based, high resolution | Visual confirmation, counts, morphology |
| Key Limitation | Poor in polydisperse samples | Potential column interactions, dilution | Low throughput, complex analysis | Sub-micron particles not detected |
| Sample Data: %HMW in mAb | PDI 0.25 (~15% HMW by intensity) | 5.2% by mass | 6.1% by sedimentation | 5,000 particles/mL ≥ 2µm |
Detailed Experimental Protocols
Protocol 1: DLS Measurement for Protein Aggregation Screening
- Sample Prep: Clarify protein sample (e.g., 1 mg/mL monoclonal antibody) by centrifugation at 10,000-15,000 x g for 10 minutes.
- Instrument Setup: Load 12 µL of supernatant into a low-volume quartz cuvette. Equilibrate to 25°C.
- Measurement: Perform 10-15 acquisitions of 10 seconds each. Use cumulants analysis for Z-average and PDI.
- Data Analysis: Use intensity distribution analysis to report apparent hydrodynamic diameter peaks. A PDI > 0.2 suggests significant polydispersity/aggregation.
Protocol 2: SEC-MALS for Absolute Molar Mass and Aggregation Quantification
- Chromatography: Use a compatible SEC column (e.g., Waters Acquity UPLC BEH200, 1.7 µm, 4.6 x 150 mm). Mobile phase: PBS, pH 7.4, 0.2 mL/min.
- System Calibration: Normalize MALS detectors using a monodisperse protein standard (e.g., BSA).
- Sample Injection: Inject 10 µg of protein sample (e.g., 10 µL of 1 mg/mL).
- Data Collection: Simultaneously collect UV (280 nm), light scattering (MALS), and differential refractive index (dRI) signals.
- Analysis: Use software (e.g., ASTRA) to calculate absolute molar mass across the eluting peak. Integrate peaks corresponding to monomer, LMW, and HMW species to determine mass percentages.
Protocol 3: Orthogonal Verification with SV-AUC
- Sample/Buffer Prep: Dialyze protein sample (0.5 mg/mL) into a suitable buffer (e.g., PBS). Use dialysate as reference.
- Cell Assembly: Load 400 µL of sample and 420 µL of reference into a double-sector centerpiece. Use an 8-hole rotor.
- Centrifugation: Run at 40,000 rpm, 20°C, for 8-10 hours, with radial scans (280 nm) every 5 minutes.
- Data Analysis: Use SEDFIT software to model data to a continuous c(s) distribution. Integrate peaks to quantify species based on sedimentation coefficient.
The Scientist's Toolkit: Key Research Reagent Solutions
Table 3: Essential Materials for Orthogonal Aggregation Analysis
| Item | Function in Experiments |
|---|---|
| UHP Buffer Components (Salts, PBS) | Provide consistent, particulate-free ionic environment for all techniques. |
| SEC Columns (e.g., BEH200, Superdex) | Separate species by size for SEC-MALS; choice depends on protein size range. |
| Protein Standards (BSA, Thyroglobulin) | Calibrate/validate SEC retention time, MALS normalization, and SV-AUC s-values. |
| Nanopure Water & 0.1 µm Filters | Prepare mobile phases and samples free of interfering particulates and bubbles. |
| Low-Protein Binding Vials/Tubes | Minimize sample loss and adventitious aggregate formation during handling. |
| Sector Centerpieces (e.g., 12 mm, 2-channel) | Hold sample and reference buffer during SV-AUC centrifugation. |
Visualizing the Orthogonal Strategy
Orthogonal Aggregation Analysis Workflow
Technique Selection Based on Analytical Question
The DLS vs. SEC-MALS debate is best resolved by recognizing their complementary roles. DLS offers unparalleled speed for initial screening and stability studies, while SEC-MALS provides chromatography-resolved, absolute mass quantification. Incorporating SV-AUC adds a high-resolution, matrix-free perspective, and MFI delivers critical sub-visible particle data. An orthogonal strategy leveraging the strengths of each method, as detailed in these comparison guides, provides the most robust and defensible characterization for protein therapeutics, de-risking drug development from discovery through quality control.
Conclusion
DLS and SEC-MALS are not competing techniques but complementary pillars of a robust protein aggregation analysis strategy. DLS excels as a rapid, low-consumption tool for assessing overall sample homogeneity, stability screening, and detecting large aggregates, making it ideal for early-stage development and formulation screening. SEC-MALS provides orthogonal, high-resolution data, offering absolute molecular weight and quantitatively resolving individual oligomeric species, which is indispensable for critical quality attribute (CQA) assessment and regulatory documentation. The optimal approach leverages the speed of DLS for routine monitoring while employing SEC-MALS for definitive characterization and quantification. Future directions point toward increased automation, advanced data analysis with machine learning, and the integration of these techniques into continuous manufacturing processes, further strengthening the analytical foundation for developing safer, more effective biotherapeutics.