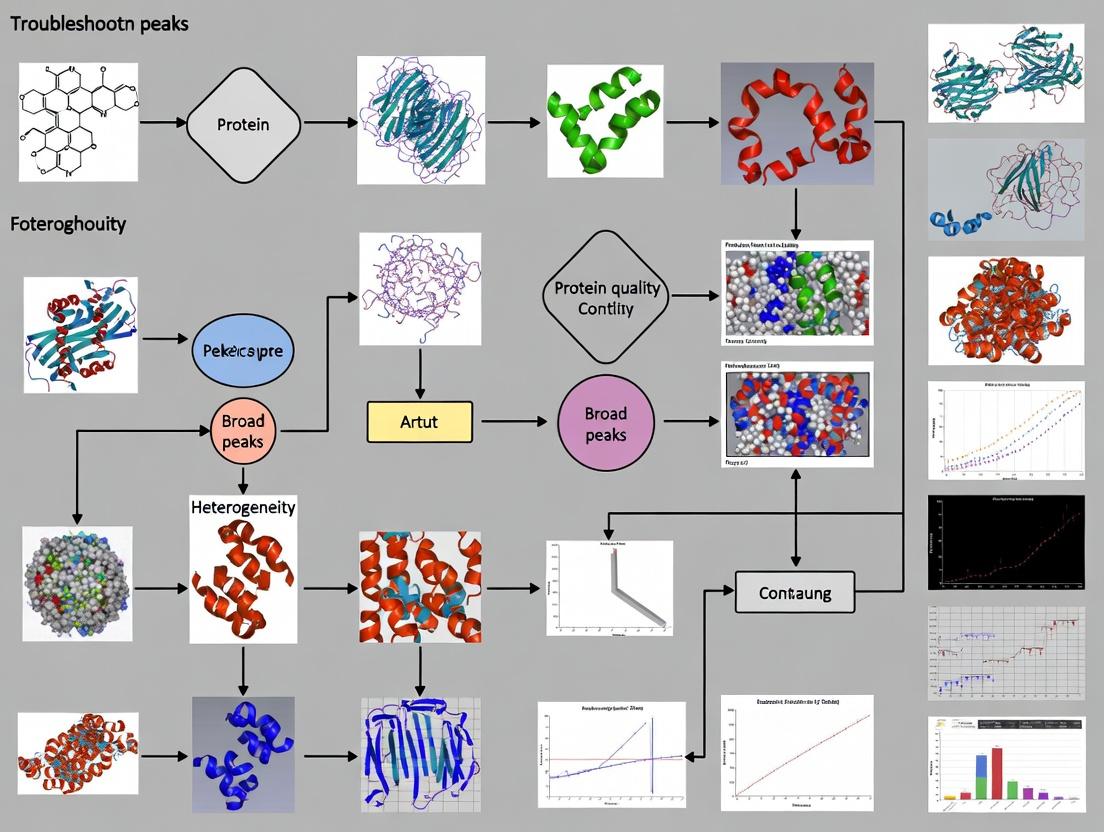
DLS Troubleshooting Guide: Decoding Broad Peaks and Protein Heterogeneity in Biopharmaceuticals
This comprehensive guide addresses the critical challenge of interpreting broad or multimodal peaks in Dynamic Light Scattering (DLS) analysis, a common indicator of protein heterogeneity.
DLS Troubleshooting Guide: Decoding Broad Peaks and Protein Heterogeneity in Biopharmaceuticals
Abstract
This comprehensive guide addresses the critical challenge of interpreting broad or multimodal peaks in Dynamic Light Scattering (DLS) analysis, a common indicator of protein heterogeneity. Targeted at researchers, scientists, and drug development professionals, the article explores the fundamental causes of heterogeneity—from aggregation and degradation to conformational changes. It provides a step-by-step methodological framework for sample preparation and instrument operation, detailed troubleshooting workflows to isolate root causes, and comparative analysis with orthogonal techniques like SEC-MALS and NTA. The goal is to equip readers with the knowledge to accurately diagnose sample issues, optimize formulations, and ensure robust protein characterization for therapeutic development.
Understanding DLS Broad Peaks: The Fundamental Link to Protein Heterogeneity
Technical Support Center: DLS Troubleshooting for Protein Heterogeneity Research
Troubleshooting Guides & FAQs
Q1: My DLS measurement shows a very broad size distribution peak. Does this definitively mean my protein sample is polydisperse? A: Not necessarily. A broad peak can indicate true sample polydisperse (multiple species), but it is often an artifact. Primary causes to investigate are:
- Protein Aggregation: Formation of oligomers or larger aggregates.
- Sample Contamination: Dust, foreign particles, or fibers from buffer preparation.
- Improper Measurement Settings: Incorrect temperature equilibration, too short measurement duration, or unsuitable light intensity (attenuator setting).
- Unfiltered Samples: Failure to filter buffers and samples through 0.02µm or 0.1µm filters before measurement.
Q2: I see a clear multimodal distribution (e.g., two distinct peaks). How do I determine if the smaller peak represents a real oligomer versus noise? A: Follow this diagnostic protocol:
- Repeat & Validate: Perform at least 5-10 consecutive measurements. Real peaks will have consistent position and intensity; spurious noise will be inconsistent.
- Vary Concentration: Dilute the sample 2-5 fold. True oligomeric peaks will scale with concentration and maintain their size ratio to the main peak. Noise or dust peaks will vary unpredictably.
- Filter Centrifugation: Use ultracentrifugal filters to deplete the larger species. If the smaller peak persists after removing the larger one, it is more likely a real species or a different contaminant.
- Cross-validate: Use a complementary technique like SEC-MALS or Native-MS to confirm the presence of multiple species.
Q3: The polydispersity index (PdI) from my DLS software is high (>0.2). What are the acceptable thresholds for a "monodisperse" therapeutic protein? A: The PdI is a dimensionless measure of distribution width. Industry standards often use the following guidelines:
| Polydispersity Index (PdI) | Interpretation for Protein Samples | Typical Acceptability in Drug Development |
|---|---|---|
| < 0.05 | Highly monodisperse, pristine condition. | Ideal for characterization of lead candidates. |
| 0.05 - 0.08 | Near monodisperse. Minor heterogeneity. | Acceptable for most early-stage formulations. |
| 0.08 - 0.2 | Moderately polydisperse. | Requires investigation and root-cause analysis. |
| > 0.2 | Broad size distribution. | Generally unacceptable; indicates significant aggregation or contamination. |
Q4: My protein is known to be a monomer from other techniques, but DLS shows a larger hydrodynamic radius (Rₕ). Why? A: DLS measures the hydrodynamic radius (Rₕ), which depends on shape and solvation. A larger-than-expected Rₕ can indicate:
- Non-globular Shape: An elongated or disordered protein will have a larger Rₕ than a compact globular protein of the same molecular weight.
- Buffer Conditions: High ionic strength can shield charges and lead to a more compact structure (smaller Rₕ), while low ionic strength can lead to charge repulsion and a swollen structure (larger Rₕ).
- Post-Translational Modifications: Glycosylation can significantly increase the apparent Rₕ.
Detailed Experimental Protocol: Diagnosing Broad DLS Peaks
Objective: Systematically identify the root cause of a broad or multimodal DLS size distribution.
Materials: See "Scientist's Toolkit" below.
Protocol:
- Sample Preparation (Critical Step):
- Prepare all buffers using ultrapure water (18.2 MΩ·cm) and filter through a 0.02 µm syringe filter.
- Clarify the protein sample by centrifugation at 10,000-15,000 x g for 10 minutes at 4°C.
- Gently pipette the supernatant, avoiding the pellet, for DLS analysis.
- Instrument & Cell Preparation:
- Power on the DLS instrument and laser, allowing at least 30 minutes for stabilization.
- Clean the quartz cuvette thoroughly with filtered water and ethanol. Rinse with filtered buffer before loading sample.
- Measurement Parameters:
- Equilibrate sample at measurement temperature (typically 20°C or 25°C) for 5 minutes inside the instrument.
- Set measurement duration to a minimum of 10 runs per sample.
- Use the instrument's software to automatically determine the optimal laser attenuator position.
- Diagnostic Series:
- Measurement 1: Analyze the original prepared sample.
- Measurement 2: Analyze a 2x diluted sample with filtered formulation buffer.
- Measurement 3: Analyze the sample after filtration through a 0.1 µm centrifugal filter (non-adsorbing material).
- Data Analysis:
- Compare the intensity-weighted size distributions from all three measurements.
- Calculate the PdI and mean Rₕ for each.
- Use the volume-weighted distribution (if available) to de-emphasize the signal from large aggregates/dust.
- Interpretation: Use the following logic to diagnose results.
DLS Broad Peak Diagnostic Decision Tree
The Scientist's Toolkit: Key Research Reagent Solutions
| Item | Function & Rationale |
|---|---|
| 0.02 µm Anotop Syringe Filter | For final filtration of buffers to remove sub-micron particulates that cause spurious scattering. |
| Ultracentrifugal Filter (100 kDa MWCO) | To concentrate sample or exchange buffer without introducing aggregates. Can also separate species by size. |
| Disposable Micro Cuvettes (UV-transparent quartz) | Pre-cleaned, sealed cuvettes to eliminate cleaning artifacts and cross-contamination for high-sensitivity measurements. |
| Non-adsorbing 0.1 µm Spin Filter | For gently filtering protein samples to remove large aggregates without significant sample loss to surface adsorption. |
| Stable Reference Standard (e.g., 100 nm latex beads) | To validate instrument performance, alignment, and measurement protocol before analyzing precious protein samples. |
| Formulation Buffer Kit (various pH & ionic strength) | To systematically test the effect of solution conditions on protein size and aggregation state. |
Troubleshooting & FAQ Center for DLS and Protein Heterogeneity Analysis
This support center addresses common experimental challenges in characterizing protein heterogeneity—specifically aggregation, fragmentation, and conformational dynamics—using Dynamic Light Scattering (DLS) and complementary techniques. The guidance is framed within a thesis context focused on troubleshooting broad DLS peaks.
Frequently Asked Questions (FAQs)
Q1: My DLS intensity distribution shows a very broad peak or multiple peaks. What does this indicate, and how should I proceed? A: Broad or multi-modal intensity-size distributions are direct indicators of sample heterogeneity. This can arise from:
- Aggregation: Presence of oligomers or large, soluble aggregates.
- Fragmentation: Protein cleavage leading to a mixture of smaller species.
- Conformational Dynamics: A mixture of expanded and compact states.
- Buffer/Sample Prep Issues: Particulates from unfiltered buffers or protein adsorption to cuvette walls.
First, always filter your buffer (0.1 µm) and sample (0.02 µm or 100 kDa centrifugal filter, depending on protein size) prior to measurement. Ensure the cuvette is clean. If the issue persists, proceed with orthogonal validation:
- Run SEC-MALS: To separate species by size and obtain absolute molecular weight.
- Perform Analytical Ultracentrifugation (AUC): To assess homogeneity and sedimentation coefficients under native conditions.
- Use Native Mass Spectrometry: To identify oligomeric states and small mass differences.
Q2: My protein is aggregating over time during storage or analysis. How can I stabilize it? A: Time-dependent aggregation points to formulation or handling instability. Systematically troubleshoot using this table:
| Stabilization Factor | Experimental Test | Goal |
|---|---|---|
| pH | DLS/MALS measurement across a pH range (e.g., 6.0-8.0) | Identify pH of minimal hydrodynamic radius (Rh) and highest count rate. |
| Ionic Strength | DLS in buffers with 0-500 mM NaCl | Screen for conditions that minimize attractive intermolecular interactions. |
| Excipients | DLS with 5-10% Sucrose, Trehalose, Arginine, Polysorbate 20/80 | Identify compounds that suppress aggregation via preferential exclusion or surface shielding. |
| Temperature | DLS thermal melt from 20°C to 70°C | Determine apparent melting temperature (Tm) and optimize storage below this point. |
| Concentration | DLS at serial dilutions (e.g., 0.1-5 mg/mL) | Rule out concentration-dependent aggregation. |
Q3: How do I distinguish between true fragmentation and transient conformational dynamics using DLS and other techniques? A: DLS measures the hydrodynamic radius (Rh). A change in Rh could mean a different molecule (fragmentation) or a shape change (dynamics). Use this orthogonal approach:
- SDS-PAGE & CE-SDS: Under reducing and non-reducing conditions. This is the definitive test for covalent fragmentation (displays lower MW bands).
- DLS vs. SEC-MALS: DLS provides Rh in solution. SEC-MALS provides the molar mass (Mw). If Rh changes but Mw stays constant, it suggests conformational dynamics. If both change proportionally, it suggests fragmentation or aggregation.
- Differential Scanning Calorimetry (DSC): Fragmentation often alters thermal denaturation profiles (number and stability of domains).
Q4: What are the best practices for preparing samples for DLS to avoid artifacts? A:
- Always Clarify: Centrifuge samples at >10,000-15,000 x g for 10-20 minutes at 4°C or use a 0.02 µm syringe filter (for proteins > ~150 kDa, use a 100 kDa centrifugal filter).
- Match Buffer: The reference buffer must be identical to the sample buffer. Perform a buffer blank measurement first.
- Minimize Bubbles: Pipette gently along the cuvette wall. Tap the cuvette lightly to dislodge bubbles.
- Control Temperature: Equilibrate the sample in the instrument for at least 2 minutes before measurement.
- Run Multiple Measurements: Perform at least 3-5 sequential runs of 10-15 seconds each to check for reproducibility and time-dependent effects.
Experimental Protocols for Orthogonal Validation
Protocol 1: Size-Exclusion Chromatography with Multi-Angle Light Scattering (SEC-MALS) Purpose: To separate heterogeneous mixtures and obtain absolute molecular weights for each eluting species. Method:
- Equilibrate a suitable SEC column (e.g., Superdex 200 Increase, TSKgel) with filtered (0.1 µm) running buffer (e.g., PBS, Tris + 150 mM NaCl) at 0.5 mL/min until baseline is stable.
- Calibrate the MALS detector using pure, monodisperse Bovine Serum Albumin (BSA).
- Clarify 50-100 µL of protein sample (1-2 mg/mL) by centrifugation (15,000 x g, 10 min, 4°C).
- Inject sample and run isocratically. Data analysis (using Astra or similar software) yields molar mass and size for each elution peak, independent of elution time.
Protocol 2: Assessing Conformational Stability via Thermal Ramp DLS Purpose: To determine the apparent melting temperature (Tm) and detect early aggregation events. Method:
- Prepare a clarified, filtered protein sample at ~0.5-1 mg/mL in desired formulation buffer.
- Load into a cuvette and place in a DLS instrument with precise temperature control.
- Set a thermal ramp protocol (e.g., from 20°C to 70°C in 0.5°C or 1.0°C increments).
- At each temperature step, allow a 30-60 second equilibration, then perform a DLS measurement (5-10 runs).
- Plot Rh, Intensity, or Polydispersity Index (PdI) vs. Temperature. The inflection point where Rh/Intensity increases sharply is the apparent Tm.
The Scientist's Toolkit: Research Reagent Solutions
| Item | Function & Rationale |
|---|---|
| ANAPRO Grade Buffers | High-purity, low-particulate buffers specifically formulated for biophysical analysis to minimize scattering artifacts. |
| 100 kDa MWCO Centrifugal Filters | To gently clarify protein samples without removing large monomers or oligomers; superior to filters for proteins >150 kDa. |
| Zeniva UF/Dialysis Membranes | For high-recovery buffer exchange into optimal formulation buffers prior to DLS/SEC-MALS. |
| Stabilzyme TS Stabilizer | A proprietary, animal-free polysorbate 80 alternative for preventing surface-induced aggregation. |
| MicroCuvette (Zeta Potential) | Disposable, low-volume cuvettes that minimize sample adsorption and cross-contamination for sensitive proteins. |
| NIST-traceable Nanosphere Standards | For daily validation of DLS instrument size and intensity accuracy (e.g., 60 nm Au standards). |
Visualization: Experimental Workflows for Troubleshooting
Troubleshooting Broad DLS Peaks: Aggregation vs. Dynamics
Key Sources of Heterogeneity & Their Causes
Technical Support Center: Troubleshooting Dynamic Light Scattering (DLS) Data
FAQ: Broad Peaks & Heterogeneity
Q1: My DLS measurement shows a broad or multimodal size distribution. Is this sample heterogeneity or an artifact? A: A broad size distribution can stem from intrinsic (sample) or extrinsic (instrument/operation) factors. Key discriminators are:
- Intrinsic Cause: True polydispersity (e.g., protein aggregates, misfolded species, sample degradation).
- Extrinsic Cause: Dust/air bubbles, poor cell cleaning, inappropriate measurement parameters, or protein sticking to the cuvette.
Q2: How can I determine if my protein sample is aggregating versus forming reversible oligomers? A: Perform a concentration-dependent DLS study. True irreversible aggregates will show a consistent large-size population across dilutions. Reversible oligomers will show a shift toward smaller hydrodynamic radii (Rₕ) with dilution. Always filter samples (e.g., 0.1 µm or 0.02 µm syringe filter) and centrifuge before measurement to remove dust.
Q3: The polydispersity index (PdI) is high. What is an acceptable threshold, and what should I do? A: For monoclonal antibodies or pure proteins, a PdI < 0.1 is generally considered monodisperse. PdI > 0.2 indicates significant polydispersity. First, rule out extrinsic factors by:
- Verifying the cuvette is impeccably clean.
- Ensuring the sample is free of bubbles.
- Checking that the temperature has fully equilibrated. If high PdI persists, it likely reflects intrinsic sample heterogeneity.
Q4: How does buffer choice affect my DLS results? A: Extrinsically, dust or particles in the buffer can cause artifacts—always filter buffers. Intrinsically, buffer conditions (pH, ionic strength, excipients) directly impact protein stability, conformation, and aggregation state. Perform DLS in formulation buffers and compare to a standard condition (e.g., PBS).
Troubleshooting Guides
Guide 1: Systematic Workflow for Diagnosing Broad Peaks
DLS Troubleshooting Decision Pathway
Guide 2: Experimental Protocol for Distinguishing Reversible vs. Irreversible Aggregates Title: Concentration & Stability DLS Assay Protocol Objective: To determine if large species detected by DLS are reversible oligomers or irreversible aggregates. Materials: See "Research Reagent Solutions" table. Method:
- Prepare a concentrated protein sample in formulation buffer.
- Filter using a 0.1 µm (or 0.02 µm for < 100 kDa proteins) syringe filter directly into a clean DLS cuvette.
- Measure Rₕ and PdI at 25°C after 2-minute equilibration. Perform minimum 10-15 runs.
- Serially dilute the sample in the cuvette using filtered buffer to the following concentrations: 2 mg/mL, 1 mg/mL, 0.5 mg/mL, 0.25 mg/mL.
- Measure Rₕ and PdI at each concentration.
- Return to the highest concentration and measure again.
- Incubate the highest concentration sample at 40°C for 1-2 hours, then measure Rₕ/PdI again.
Data Interpretation: Plot Rₕ vs. Concentration. A decreasing Rₕ with dilution suggests reversible association. An increase in Rₕ after temperature stress indicates instability and irreversible aggregation.
Table 1: Diagnostic Signatures of Intrinsic vs. Extrinsic DLS Issues
| Observation | If Intrinsic (Sample) | If Extrinsic (Artifact) | Action Step |
|---|---|---|---|
| Broad/Complex Peak | Reproducible across preparations. Changes logically with stress (temp, pH). | Inconsistent between replicates. Disappears with pristine buffer control. | Compare multiple sample aliquots vs. buffer control. |
| Large Particle Signal | Consistent size population. May change with dilution (reversible). | Random, very large size (>1000 nm). Erratic intensity. | Filter sample & buffer through 0.02 µm filter. Ultrasonic bath for cuvette. |
| High PdI (>0.2) | Remains high after optimal prep. Correlates with other assays (SEC). | Reduces significantly after rigorous cleaning and filtering. | Follow systematic troubleshooting workflow. |
| Signal Fluctuation | Moderate, due to true polydisperse scattering. | Extreme, due to few large dust particles or bubbles. | Centrifuge sample, degas buffer, check cuvette for bubbles. |
Table 2: Impact of Common Experimental Variables on DLS Results
| Variable | Typical Optimal Setting | Risk if Non-Optimal | Primary Factor Category |
|---|---|---|---|
| Sample Filtration | 0.1 µm filter (or 0.02 µm). | Dust artifacts, false large aggregate signal. | Extrinsic |
| Cuvette Cleanliness | No streaks, cleaned with solvent/acid. | Contaminant particles, irreproducible results. | Extrinsic |
| Equilibration Time | 2-5 minutes at set temperature. | Thermal gradients, convection currents. | Extrinsic |
| Protein Concentration | 0.5 - 2 mg/mL (adjust for signal). | Multiple scattering (too high), weak signal (too low). | Extrinsic/Intrinsic |
| Buffer Viscosity/RI | Accurate value input into software. | Incorrect Rₕ calculation. | Extrinsic |
| Sample Stability | Stable for duration of measurement. | Aggregation growth during measurement. | Intrinsic |
| Native State Integrity | Correct buffer/pH/excipients. | Conformational change, reversible self-association. | Intrinsic |
The Scientist's Toolkit: Research Reagent Solutions
| Item | Function in DLS Troubleshooting |
|---|---|
| Anopore Syringe Filters (0.02 µm) | Gold-standard for removing particulates and pre-existing aggregates from protein samples and buffers without significant adsorption. |
| Disposable Micro Cuvettes (UVette-style) | Eliminates cross-contamination and cleaning artifacts; essential for screening. |
| Quartz or Glass Cuvettes | Reusable cuvettes for high-sensitivity measurements; require rigorous cleaning protocols. |
| HPLC-Grade Water | Used for final cuvette rinsing and buffer preparation to minimize dust background. |
| Size Standard (e.g., 100 nm latex) | Validates instrument performance and measurement parameters. |
| Formulation Buffers with Excipients | (e.g., Polysorbate 20, Sucrose, Arginine) To assess intrinsic stability under relevant conditions. |
| Desktop Microcentrifuge | For quick spin-down of samples before loading into cuvette to pellet any debris. |
| Ultrasonic Cleaning Bath | For deep cleaning of reusable cuvettes to remove adhered protein and contaminants. |
The Impact of Formulation Buffers and Excipients on Apparent Hydrodynamic Radius
Troubleshooting Guides & FAQs
Q1: During DLS analysis of my monoclonal antibody in a histidine-sucrose formulation, I observe a broad peak or multiple peaks. What could be the cause?
A: Broad or multiple peaks in Dynamic Light Scattering (DLS) often indicate sample heterogeneity. In your histidine-sucrose buffer, this can be caused by:
- Non-native aggregation: Sucrose is a stabilizer, but if the formulation pH (set by histidine) is too close to the protein's isoelectric point (pI), it can reduce electrostatic repulsion and promote aggregation.
- Buffer-protein interactions: Histidine can weakly interact with certain protein surfaces, potentially leading to reversible self-association that increases the apparent hydrodynamic radius (Rh).
- Inadequate excipient concentration: Insufficient sucrose may fail to properly exclude water from the protein surface, leading to colloidal instability.
Protocol 1: Diagnosing Buffer-Induced Aggregation
- Sample Preparation: Prepare three identical protein samples (e.g., 1 mg/mL mAb). Dialyze each into: (A) 20 mM Histidine, 250 mM Sucrose, pH 6.0; (B) 20 mM Histidine, pH 6.0 (no sucrose); (C) A reference buffer (e.g., PBS, pH 7.4).
- DLS Measurement: Equilibrate samples at 25°C for 10 minutes. Perform minimum 12 measurements per sample using a DLS instrument (e.g., Malvern Zetasizer). Set attenuation automatically and use a minimum of 10 runs per measurement.
- Data Analysis: Analyze the intensity-size distribution. Compare the polydispersity index (PdI), peak width, and mean Rh across formulations. A significant increase in PdI or Rh in Buffer B compared to A and C suggests sucrose is critical for stability. A change in all histidine buffers vs. PBS suggests pH or buffer-specific effects.
Q2: My protein's apparent Rh from DLS varies significantly between phosphate and citrate buffers at the same pH and ionic strength. Why?
A: Different buffer species can specifically interact with the protein surface, altering the solvation shell and effective particle size. Citrate, a trivalent ion, is more likely to cause "ion binding" or "excluded volume" effects compared to monovalent phosphate ions, leading to changes in the apparent Rh. This is often due to changes in the protein's conformational stability or preferential hydration.
Protocol 2: Assessing Excipient-Specific Interactions via DLS Titration
- Stock Solutions: Prepare a concentrated, dialyzed protein solution in a low-ionic-strength buffer (e.g., 5 mM Tris, pH 7.5). Prepare concentrated stocks of the excipients of interest (e.g., 1M Citrate, 1M Phosphate, 2M Arginine-HCl, 20% w/v Sucrose).
- Titration: In a 96-well plate or small-volume tubes, create a series of protein-excipient mixtures. Hold protein concentration constant (e.g., 0.5 mg/mL) while varying excipient concentration. Ensure final sample ionic strength is matched using NaCl.
- High-Throughput DLS: Use a plate-based DLS reader or automated cuvette system to measure Rh and PdI for each condition. Perform triplicate measurements.
- Analysis: Plot Apparent Rh vs. Excipient Concentration. A monotonic increase may indicate colloidal swelling or aggregation onset. A decrease may indicate compaction. Non-monotonic behavior suggests complex interactions.
Q3: How do I determine if a surfactant (like Polysorbate 20) is affecting my DLS measurement of Rh?
A: Surfactants above their critical micelle concentration (CMC) form micelles with their own Rh (~5-10 nm). DLS may detect these as a separate population or, if similar in size to protein monomers, convolute the distribution. Furthermore, surfactant binding to protein can alter its apparent size.
Protocol 3: Deconvoluting Surfactant & Protein Signals
- Control Measurements: Perform DLS on your formulation buffer with and without the surfactant at the working concentration. Note the Rh, PdI, and intensity of any peaks attributed to surfactant micelles/aggregates.
- Sample Measurement: Measure the complete formulated protein sample.
- Data Subtraction Analysis: Use the instrumental software's "multiple narrow modes" or "protein analysis" algorithm if available. Alternatively, compare the correlation functions. The presence of a fast-decaying component not present in the buffer-only control may indicate free micelles.
- Validation: Analyze the sample using an orthogonal method like SEC-MALS (Size-Exclusion Chromatography with Multi-Angle Light Scattering) to obtain a surfactant-free Rh for comparison.
Table 1: Impact of Common Formulation Excipients on Apparent Hydrodynamic Radius (Rh)
| Excipient Class | Example | Typical Conc. | General Effect on Apparent Rh | Potential Mechanism |
|---|---|---|---|---|
| Sugar | Sucrose, Trehalose | 5-10% (w/v) | Slight decrease or no change (<0.1 nm) | Preferential exclusion, stabilizing native state, minor compaction. |
| Amino Acid | L-Arginine HCl | 50-250 mM | Can increase or decrease (0.1-0.5 nm) | Complex: suppresses aggregation (may increase Rh), but can also weaken hydrophobic interactions (may decrease Rh). |
| Surfactant | Polysorbate 80 | 0.01-0.1% (w/v) | Adds micelle peak (~5-10 nm) | Micelle formation; protein-surfactant complexation may alter protein Rh. |
| Salt | NaCl, Na₂SO₄ | 50-150 mM | Variable, depends on Hofmeister series | Modulates electrostatic shielding & preferential interaction; can induce swelling or compaction. |
| Buffer Ion | Citrate vs. Phosphate | 10-20 mM | Can differ by 0.2-0.8 nm between ions | Specific ion binding/hydration effects altering solvation shell. |
Table 2: DLS Troubleshooting Guide for Broad Peaks Related to Formulation
| Observed Issue | Primary Suspect in Formulation | Diagnostic Experiment | Expected Outcome if Cause is Confirmed |
|---|---|---|---|
| Single, broad intensity peak | High polydispersity from aggregates or fragments. | SEC-DLS or FFF-MALS. | SEC/FFF separates populations; inline DLS/MALS shows true Rh of each peak. |
| Two distinct peaks | 1) Protein + large aggregates, or 2) Protein + excipient structures (micelles, particles). | Filter sample (0.1 µm) or add reducing agent (if disulfide-linked). | Filtering removes large aggregates; reducing agent may dissociate covalent aggregates. |
| Rh increases with time in sample well | Excipients insufficient to prevent surface adsorption/aggregation. | Measure over time with/without additional surfactant (e.g., 0.005% PS80). | Rh stabilizes over time with effective surfactant present. |
| Rh differs from literature/value in buffer A | Buffer/Excipient specific interactions. | Dialyze into reference buffer B and re-measure. | Rh shifts towards expected value upon buffer exchange. |
Diagrams
Diagram 1: DLS Troubleshooting Workflow for Broad Peaks
Diagram 2: How Excipients Modulate Apparent Rh
The Scientist's Toolkit: Key Research Reagent Solutions
| Item | Function in DLS/Formulation Studies |
|---|---|
| Zeta Potential Cell | Allows measurement of particle surface charge (zeta potential) in addition to Rh, crucial for understanding electrostatic stability in different buffers. |
| Disposable Micro Cuvettes (Low Volume) | Essential for precious protein samples, minimizes sample requirement (as low as 12 µL) and reduces cross-contamination. |
| Anopore or UItrafiltration Membranes | For buffer exchange into various formulation buffers via dialysis or centrifugal filtration without excessive protein loss. |
| Sterile, Particle-Free Vials & Buffers | Critical to avoid spurious signals from dust or container-derived particles that can be mistaken for protein aggregates. |
| High-Purity Excipient Standards | Use of USP/PhEur grade or higher purity sugars, surfactants, and amino acids ensures DLS results reflect true protein behavior, not impurities. |
| Dynamic Light Scattering Instrument | Core instrument (e.g., Malvern Panalytical Zetasizer, Wyatt DynaPro Plate Reader) with temperature control (4-90°C) for stability studies. |
| SEC-MALS System | Orthogonal technique to DLS. Separates populations by size before light scattering analysis, providing an aggregate-free Rh for the monomer. |
Technical Support & Troubleshooting Center
Troubleshooting Guide: Interpreting Complex DLS Results
Issue 1: My DLS correlation function shows multiple decay rates and the size distribution report has a very broad or multimodal peak. What does this mean for my mAb sample?
- Answer: This is a classic indicator of sample heterogeneity, which is common with mAbs. The broad or multimodal peak suggests the presence of multiple hydrodynamic species. This could be due to:
- Aggregation: Presence of dimers, trimers, or higher-order aggregates alongside monomers.
- Fragmentation: Presence of smaller fragments (e.g., Fab fragments) due to degradation.
- Conformational Changes: Partially unfolded or expanded monomeric species with a larger hydrodynamic radius (Rₕ) than the native form.
- Buffer/Solvent Effects: Non-ideal conditions causing reversible self-association or changes in apparent size.
Issue 2: I am getting poor reproducibility between measurements on the same mAb sample. What are the primary causes?
- Answer: Poor reproducibility in DLS of mAbs often stems from sample preparation and handling issues.
- Dust/Particulates: Contamination from dirty cuvettes, pipette tips, or airborne dust.
- Inconsistent Filtration: Not filtering buffers and samples consistently with an appropriate low-protein-binding filter (e.g., 0.1 µm or 0.22 µm).
- Bubbles: The presence of microbubbles introduced during pipetting, which scatter light intensely.
- Temperature Equilibration: Inadequate time allowed for the sample and instrument to reach a stable set temperature before measurement.
Issue 3: The measured Rₕ of my mAb monomer appears too large/small compared to the theoretical value. Why?
- Answer: Deviations from the theoretical Rₕ (typically ~5-6 nm for an IgG1) can be due to several factors. Use the table below to diagnose.
| Observed Discrepancy | Potential Cause | Diagnostic Experiment |
|---|---|---|
| Rₕ too large | Non-native, expanded conformation; Weak, reversible self-association; High concentration effect. | Measure at multiple, lower concentrations (e.g., 0.1-1 mg/mL). Check by SEC-MALS for conformation. |
| Rₕ too small | Sample fragmentation; Presence of excipients affecting viscosity/diffusion. | Analyze by SDS-PAGE or CE-SDS. Measure buffer viscosity accurately. |
| Rₕ varies with concentration | Attractive or repulsive intermolecular interactions (solution non-ideality). | Perform a concentration series and extrapolate to zero concentration for the true Rₕ. |
Frequently Asked Questions (FAQs)
Q1: What is the optimal concentration range for analyzing mAbs by DLS? A: For most commercial DLS instruments, a concentration range of 0.1 to 1 mg/mL is ideal. Higher concentrations (>5 mg/mL) often lead to intermolecular interference (non-ideality), artificially affecting the diffusion coefficient. Lower concentrations (<0.1 mg/mL) may result in a weak scattering signal and poor data quality.
Q2: How can I distinguish between a true aggregate and a sample artifact like dust? A: Dust particles are typically very large (>1 µm) and scatter light extremely intensely. Key identifiers:
- Signal Instability: The count rate (kcps) will fluctuate wildly.
- Size Distribution: Dust appears as a sharp, very large peak (>1000 nm) that changes position/amplitude between repeated measurements.
- Protocol: Always centrifuge or filter your sample (0.22 µm filter) and use clean, particulate-free cuvettes.
Q3: My mAb is in a formulation buffer with sucrose and polysorbate. Will this affect my DLS measurement? A: Yes, excipients are critical factors.
- Sucrose: Increases solution viscosity, which will slow diffusion and lead to an overestimation of Rₕ if the instrument software uses the viscosity of pure water. You must input the measured viscosity of your exact formulation.
- Polysorbate: Micelles (~10 nm) can be detected by DLS. Run a blank measurement of your formulation buffer and subtract its contribution from the sample measurement.
Experimental Protocols for mAb DLS Analysis
Protocol 1: Standard DLS Measurement for mAb Monomer/Aggregate Assessment
- Buffer Preparation: Prepare formulation buffer using ultrapure water (18.2 MΩ·cm). Filter through a 0.1 µm low-protein-binding filter (e.g., PVDF).
- Sample Preparation: Dialyze or dilute the mAb into the filtered buffer to a target concentration of 0.5 mg/mL. Centrifuge at 10,000-15,000 x g for 10 minutes at the measurement temperature to pellet any large aggregates or dust.
- Loading: Carefully pipette the supernatant into a clean, low-volume quartz or disposable plastic cuvette, avoiding bubbles.
- Instrument Setup: Equilibrate the sample chamber at the desired temperature (typically 20°C or 25°C) for at least 5 minutes. Set measurement duration to 10-15 acquisitions of 10 seconds each.
- Data Collection: Perform at least 3-5 independent measurements per sample. Always include a filtered buffer blank.
- Analysis: Use intensity-weighted distribution for primary analysis. Compare the polydispersity index (PdI) and peak positions from the sample to the buffer blank.
Protocol 2: Concentration Series to Assess Reversible Self-Association
- Prepare a stock mAb solution at ~2 mg/mL in the desired buffer (filtered, centrifuged).
- Perform a serial dilution to create samples at concentrations: 2.0, 1.0, 0.5, 0.25, and 0.1 mg/mL.
- Measure each sample in triplicate using Protocol 1.
- Data Analysis: Plot the apparent Rₕ (or Z-average) and PdI versus concentration. A constant Rₕ indicates ideal behavior. An increasing Rₕ with concentration suggests reversible self-association.
Visualizations
Diagram Title: DLS Workflow for mAb Heterogeneity Assessment
Diagram Title: Root Causes of Complex mAb DLS Profiles
The Scientist's Toolkit: Research Reagent Solutions
| Item | Function in mAb DLS Analysis |
|---|---|
| Low-Protein-Binding Filters (0.1 µm PVDF) | Removes dust and large aggregates from sample and buffer without adsorbing the mAb. |
| Ultrapure Water (18.2 MΩ·cm) | Prevents interference from ionic particulates in buffer preparation. |
| Disposable Micro Cuvettes (ZEN0040) | Prevents cross-contamination and eliminates cuvette cleaning as a source of dust. |
| Viscosity Standard (e.g., Toluene) | Calibrates instrument for accurate viscosity measurements of non-aqueous buffers. |
| Size Standard (e.g., 100 nm NIST Latex) | Verifies instrument alignment and size calibration. |
| Formulation Buffer Excipients (Sucrose, PS80) | Used to mimic drug product conditions; requires careful blank control measurements. |
| DLS Deconvolution Software (e.g., CONTIN, NNLS) | Algorithms used to transform correlation data into size distribution plots. |
Best Practices for DLS Analysis: From Sample Prep to Data Acquisition
Welcome to the Technical Support Center for Dynamic Light Scattering (DLS) in Protein Heterogeneity Research. This guide addresses common pre-analytical issues leading to broad or multimodal peaks in DLS histograms, a key challenge in protein characterization for drug development.
Troubleshooting Guides & FAQs
Q1: My DLS results show a persistent broad peak or a secondary peak around 2-5 nm, even after sample purification. What is the most likely cause? A: This is frequently caused by microbubbles introduced during sample pipetting or vortexing. Microbubbles scatter light intensely and are misinterpreted by the DLS software as very small particles/proteins. This artifact directly contributes to observed heterogeneity and unreliable polydispersity index (PDI) values.
- Solution: Implement a strict degassing protocol. Degas all buffers (especially phosphate or Tris buffers) prior to use by applying a vacuum (e.g., using a vacuum desiccator) with gentle stirring for 15-20 minutes. For the sample itself, allow it to settle in the cuvette for 2-5 minutes post-pipetting before measurement.
Q2: After filtration, my DLS intensity count rate dropped significantly, and I see a new aggregate peak. What went wrong? A: This indicates sample adsorption to the filter membrane or shear-induced aggregation during the filtration process.
- Solution:
- Pre-wet the filter: Flush the filter with at least 1-2 mL of your buffer before filtering the sample. This saturates non-specific binding sites.
- Choose the correct membrane: Use low-protein-binding membranes (e.g., PES). Avoid cellulose acetate (CA) for proteins prone to adsorption.
- Discard the first aliquot: Do not analyze the first 3-4 drops of filtrate, as they may contain released particles from the filter housing or concentrated buffer components.
- Verify compatibility: See the Filtration Compatibility Table below.
Q3: Centrifugation is recommended to remove large aggregates, but my sample's concentration becomes too dilute for DLS detection afterward. How do I balance this? A: You are likely discarding the entire supernatant. The goal is to carefully extract only the top portion of the supernatant, leaving the pellet (and any pelleted aggregates) completely undisturbed.
- Solution: Use a precise, low-volume micro-pipette. After centrifugation, carefully insert the pipette tip near the meniscus and withdraw only 70-80% of the total supernatant volume. For concentrated samples, consider a small-volume centrifugal concentrator with an appropriate molecular weight cutoff to simultaneously clarify and concentrate.
Research Reagent Solutions Toolkit
| Item | Function in DLS Pre-Analysis |
|---|---|
| 0.02 µm or 0.1 µm Anotop (Aluminum Oxide) Syringe Filter | Gold standard for final sample clarification. Inorganic, non-deformable membrane minimizes protein adsorption and particle shedding. |
| Low-Protein-Binding PES Syringe Filter (0.1/0.22 µm) | General-purpose filtration for buffers and most protein samples. Offers good flow rates and low adsorption. |
| Ultra-Clean, Low-Volume DLS Cuvette (e.g., Branded Quartz) | Minimizes sample volume (12-50 µL), reduces dust/air bubble introduction, and ensures optimal light path quality. |
| Bench-Top Micro-Centrifuge (with temp control) | For consistent, low-speed clarification spins (e.g., 2,000 - 15,000 x g) to remove dust and large aggregates without generating heat. |
| Tabletop Vacuum Desiccator | For effective degassing of buffers to eliminate microbubbles, a major source of artifactic scattering. |
| Particle-Free, HPLC-Grade Water | For all buffer preparation and cuvette rinsing to eliminate interference from particulate contaminants. |
| Low-Adhesion, Aerosol-Reducing Pipette Tips | Prevents sample loss on tip walls and minimizes bubble formation during pipetting. |
Table 1: Effect of Pre-Analytical Steps on Key DLS Output Parameters in a Model Monoclonal Antibody Sample.
| Pre-Analysis Step | Avg. Hydrodynamic Radius (Rh) | Polydispersity Index (PDI) | Peak Width / Resolution | Primary Cause of Improvement |
|---|---|---|---|---|
| No Treatment (Crude Sample) | 8.2 ± 3.1 nm | 0.25 - 0.40 | Very Broad / Poor | Baseline aggregates, dust, bubbles. |
| Centrifugation Only (10k x g, 10 min) | 7.8 ± 2.0 nm | 0.18 - 0.25 | Moderate | Removal of large, sedimentable aggregates. |
| Filtration Only (0.22 µm PES) | 7.5 ± 1.8 nm | 0.15 - 0.22 | Moderate | Removal of particles > 220 nm. Risk of sample loss. |
| Degassing Only (Buffer & Sample) | 8.0 ± 1.5 nm | 0.12 - 0.18 | Improved | Elimination of microbubble scattering artifacts. |
| Integrated Protocol (All Steps) | 7.6 ± 0.8 nm | 0.08 - 0.12 | Sharp / High | Synergistic removal of all non-protein scatterers. |
Detailed Experimental Protocols
Protocol 1: Integrated Pre-DLS Sample Preparation for Proteins
- Buffer Degassing: Prepare your run buffer. Place it in a vacuum desiccator under moderate vacuum (≈25 inHg) with gentle magnetic stirring for 20 minutes. Release vacuum slowly.
- Sample Dilution: Dilute your protein sample into the degassed buffer using low-adhesion pipette tips. Aim for the optimal concentration for your instrument (typically 0.1-1 mg/mL for antibodies).
- Low-Speed Clarification: Transfer the diluted sample to a microcentrifuge tube. Centrifuge at 2,000 x g for 5 minutes at the measurement temperature (e.g., 20°C or 25°C). Note: This is a clarifying spin, not a pelleting spin.
- Supernatant Extraction: Carefully remove the tube. Using a fresh pipette tip, extract only the top 70-80% of the supernatant, avoiding the bottom of the tube.
- Final Filtration: Load the supernatant into a 0.02 µm or 0.1 µm Anotop syringe filter attached to a clean syringe. Discard the first 3-4 drops (≈50 µL). Gently dispense the filtrate directly into a clean DLS cuvette.
- Cuvette Equilibration: Cap the cuvette, allow it to thermally equilibrate in the instrument for 2 minutes, then begin measurement.
Protocol 2: Rapid Troubleshooting Spin for Aggregate Verification If a DLS run shows a significant >100 nm population:
- Carefully recover the sample from the cuvette back into a microcentrifuge tube.
- Centrifuge at a higher speed (e.g., 10,000 - 15,000 x g for 10 minutes) at the relevant temperature.
- Immediately re-measure the top 50% of the supernatant.
- Interpretation: If the large population disappears, it was composed of sedimentable aggregates. If it remains, it may be non-sedimentable vesicles or very large, soluble complexes.
Title: Workflow for DLS Sample Prep with Artifact Mitigation
Title: Diagnostic Tree for DLS Broad Peak Analysis
Troubleshooting Guides & FAQs
Q1: In my DLS analysis of a therapeutic monoclonal antibody, I consistently obtain broad, multimodal peaks. How do I determine if this is due to sample heterogeneity or suboptimal instrument settings? A: A broad peak can stem from true sample polydispersity or from measurement artifacts. First, perform a diagnostic protocol: 1) Run the sample at three different angles (e.g., 90°, 120°, 150°) with a long measurement duration (e.g., 300 seconds). 2) Perform at least 10 consecutive runs. True heterogeneity will show consistent polydispersity index (PdI) values across angles and runs, while instrument-related noise will show high variability. See Table 1 for expected correlations.
Q2: What is the optimal measurement duration per run to balance data quality and throughput for unstable protein samples? A: For aggregation-prone proteins, very long single measurements are not ideal. Use a protocol of multiple shorter runs. For instance, 15 runs of 20 seconds each is often superior to 1 run of 300 seconds, as it allows statistical validation and identification of time-dependent aggregation onset. Average the results from the multiple short runs.
Q3: When optimizing for the lowest PdI, how do I choose between increasing the number of runs versus increasing the duration of each run? A: Increasing the number of runs improves the statistical confidence of the intensity distribution. Increasing the duration improves the signal-to-noise ratio for each autocorrelation function. For proteins with expected PdI < 0.1, prioritize number of runs (e.g., 10-15). For very dilute or weakly scattering samples, first increase duration to capture sufficient photons.
Q4: How does measurement angle selection impact the results for protein mixtures containing large aggregates? A: Backscatter angles (e.g., 173°) are less sensitive to dust and large aggregates, as they minimize the scattering volume and path length. Forward angles (e.g., 90°) are more sensitive to larger particles. If your research question involves detecting trace large aggregates, include a 90° measurement alongside the standard backscatter angle to cross-validate.
Table 1: Effect of Instrument Settings on DLS Results for a Heterogeneous Protein Sample
| Setting | Value Tested | Impact on Hydrodynamic Diameter (d.nm) | Impact on Polydispersity Index (PdI) | Recommended Use Case |
|---|---|---|---|---|
| Measurement Angle | 90° (Forward) | Higher sensitivity to large aggregates; may report larger Z-Ave. | Can artificially increase PdI due to dust. | Screening for large aggregates. |
| 173° (Backscatter) | Standard; robust against dust; smaller effective volume. | More reliable baseline for true sample PdI. | Standard protein characterization. | |
| Duration per Run | 60 sec | Lower signal-to-noise; higher run-to-run variation. | May over- or under-estimate true PdI. | Stable, high-concentration samples. |
| 180 sec | Good balance for most samples. | More reliable for PdI < 0.2. | Standard stability studies. | |
| 300 sec | Excellent signal-to-noise; may miss early aggregation. | Most accurate for monodisperse samples. | Final formulation characterization. | |
| Number of Runs | 3-5 runs | Low statistical confidence. | High variance in PdI. | Quick quality check. |
| 10-15 runs | Robust mean and SD for Z-Ave. | Reliable PdI and distribution width. | Critical research/development data. |
Table 2: Diagnostic Protocol for Resolving Broad Peaks
| Step | Parameter | Setting | Success Criteria (for a monodisperse reference) |
|---|---|---|---|
| 1. Baseline Noise Check | Duration, Cell Cleanliness | 180 sec, clean cell | Intensity trace is stable, no sharp spikes. |
| 2. Angle Consistency | Angles: 90°, 120°, 173° | 10 runs per angle | Z-Ave varies < 5% across angles; PdI < 0.05. |
| 3. Run-to-Run Consistency | Number of Runs: 15 | Duration: 30 sec/run | Std. Dev. of Z-Ave across runs is < 2% of mean. |
| 4. Concentration Test | Sample Dilution Series | 0.1, 0.5, 1.0 mg/mL | Z-Ave is concentration-independent. |
Experimental Protocols
Protocol 1: Diagnostic for Instrument Setting vs. True Heterogeneity
- Sample Prep: Filter your protein sample and buffer separately using 0.02 µm (or 0.1 µm for large proteins) filters.
- Baseline: Measure filtered buffer at the standard angle (173°) and duration (180 sec) for 3 runs. Count rate should be low (< 50 kcps) and stable.
- Angle Test: Load sample. Perform 10 consecutive runs at three angles: 173°, 120°, and 90°. Use a fixed, long duration (e.g., 180 sec).
- Analysis: Calculate mean Z-Average and PdI for each angle set. True heterogeneity shows consistent PdI across angles. Artifacts show high angle-dependent variance.
- Number of Runs Test: At the optimal angle, perform 15 runs of 30 seconds each. Calculate standard deviation of the Z-Average.
Protocol 2: Optimizing for Aggregation-Prone Proteins
- Temperature Control: Equilibrate the sample chamber at the desired temperature for 300 seconds before measurement.
- Short-Run, High-Replicate Mode: Configure the instrument for 20 consecutive measurements of 20 seconds each.
- Data Filtering: Software will typically provide an intensity- or deviation-based filter. Reject any run where the measured intensity deviates > 10% from the median.
- Trend Analysis: Plot Z-Average vs. run number (which correlates with time). A positive slope indicates aggregation occurring during measurement, necessitating even shorter run times or lower temperature.
Visualization
Diagram 1: DLS Broad Peak Troubleshooting Logic
Diagram 2: DLS Measurement Optimization Workflow
The Scientist's Toolkit: Research Reagent Solutions
Table 3: Essential Materials for Robust DLS Protein Analysis
| Item | Function & Importance in DLS Troubleshooting |
|---|---|
| Anotop 0.02 µm Syringe Filter | Provides ultra-cleaning of buffers for reliable baseline. Critical for removing nanoscale dust. |
| Disposable UVette or Micro Cuvette | Eliminates cross-contamination and cuvette cleaning artifacts, especially for low-concentration samples. |
| Size Standard (e.g., 100 nm NIST Traceable Latex) | Validates instrument performance, angle calibration, and data processing settings. |
| Stable, Monodisperse Protein Standard (e.g., BSA) | Serves as a system suitability control to differentiate instrument noise from sample issues. |
| Protein Stabilizer/Carrier (e.g., BSA 0.1%) | Added to dilute protein samples to prevent surface adsorption to filters and cuvettes, preserving concentration. |
| Particle-Free Water or Buffer | Commercially available or carefully filtered in-house. The foundation of all reliable DLS measurements. |
Technical Support Center
FAQs and Troubleshooting Guides
Q1: My DLS measurement of a monoclonal antibody shows a broad, asymmetric peak in the NNLS size distribution. Does this definitively prove sample heterogeneity? A: Not necessarily. A broad NNLS peak can indicate true sample heterogeneity (e.g., aggregates, fragments) but can also be an artifact from:
- Low Signal-to-Noise Ratio: Dust or contaminants in the solvent.
- Incorrect Viscosity Setting: Using the solvent viscosity for water instead of your specific buffer.
- Over-Interpretation of NNLS: The NNLS algorithm will attempt to fit a distribution to any data, even noise. Always cross-verify with the Polydispersity Index (PdI) from the Cumulants analysis. Troubleshooting Protocol:
- Filter both sample and buffer through 0.02 µm filters.
- Measure buffer viscosity accurately if not aqueous.
- Compare Cumulants Result: If the Cumulants PdI is low (<0.1), the sample is likely monodisperse, and the broad NNLS peak is an artifact. If PdI is high (>0.15), heterogeneity is more probable.
- Validate with an orthogonal technique (e.g., SEC-MALS).
Q2: When should I use the Cumulants method over NNLS for analyzing my protein DLS data? A: Use the Cumulants analysis as the primary, model-independent report for the average size and an intrinsic measure of breadth (PdI). It is the method defined by the ISO standard (ISO22412:2017). Decision Workflow:
- Always start with the Cumulants result. Report Z-Average (d.nm) and PdI.
- If PdI < 0.1, the sample is effectively monodisperse. The NNLS distribution offers limited additional value and should be presented as a simple, narrow peak.
- If 0.1 < PdI < 0.2, the sample has moderate polydispersity. Use NNLS cautiously to visualize potential bimodal or broad distributions, but do not over-interpret peak positions.
- If PdI > 0.2, the sample is polydisperse. NNLS can be used to identify the populations present, but note that for very broad distributions, NNLS resolution is limited. Consider fractionation prior to DLS.
Q3: The NNLS algorithm shows two distinct peaks, but their reported percentages change dramatically between replicate measurements. What is the issue? A: This indicates instability in the NNLS solution, often due to:
- Insufficient data quality (low count rate, short measurement duration).
- Too many iterations or bins set in the NNLS algorithm, causing it to fit to noise. Experimental Protocol for Stable NNLS:
- Ensure measurement duration is long enough (typically > 5 runs of 10 seconds each).
- Aim for a photon count rate (kcps) appropriate for your instrument's sensitivity.
- Fix the NNLS parameters: Set the number of iterations to a moderate value (e.g., 1000) and use a sensible number of size bins (e.g., 50-100 for a 1-1000 nm range).
- Perform at least 5 independent measurements. Do not rely on a single NNLS distribution. Report the average and standard deviation of the Cumulants results (Z-Average, PdI) and use NNLS distributions as a qualitative, illustrative guide.
Quantitative Data Comparison: Cumulants vs. NNLS
Table 1: Core Characteristics and Application Guidance
| Feature | Cumulants Analysis (ISO) | NNLS / Distribution Analysis |
|---|---|---|
| Primary Output | Z-Average Diameter (d.nm), Polydispersity Index (PdI) | Intensity-weighted Size Distribution |
| Mathematical Basis | Model-independent fit to the initial decay of the correlation function. | Model-dependent inversion of the correlation function; assumes a sum of discrete species. |
| Key Strength | Robust, reproducible metric for average size and sample uniformity. | Visual representation of potential multi-modal distributions. |
| Key Weakness | Does not provide a distribution. Can be skewed by large aggregates. | Solutions can be unstable and highly sensitive to data quality/noise. |
| Optimal Use Case | Primary reporting standard; stability studies, comparing lot-to-lot consistency, rapid purity assessment. | Qualitative exploration of clearly polydisperse samples (PdI > 0.15-0.2); visualizing aggregates after stress tests. |
| Report When PdI < 0.1 | Mandatory. Confirms monodispersity. | Optional; distribution should be a sharp, single peak. |
| Report When PdI > 0.2 | Mandatory. Quantifies polydispersity. | Use with caution; present as an illustrative guide alongside Cumulants data. |
Experimental Protocols
Protocol 1: Standardized DLS Measurement for Reliable Cumulants PdI
- Sample Preparation: Clarify all buffers by filtration (0.02 µm). Spin down protein samples at >15,000 x g for 10 minutes to remove large dust/aggregates.
- Instrument Calibration: Use a known latex standard (e.g., 60 nm or 100 nm) to verify instrument performance.
- Measurement Settings: Set temperature equilibration time to 120 seconds. Perform a minimum of 5-10 measurement runs per sample, with individual run durations of 10-30 seconds depending on sample concentration.
- Data Acquisition: Record the intensity-based correlation function.
- Primary Analysis: Apply the Cumulants analysis to the measured correlation function. Record the Z-Average and PdI. Use the intercept criterion (typically >0.85) to assess data quality.
- Secondary Analysis: Only if PdI > 0.15, apply the NNLS algorithm using fixed, moderate parameters. Never use NNLS on data with a poor intercept.
Protocol 2: Investigating Protein Heterogeneity via NNLS
- Follow steps 1-5 of Protocol 1 to establish baseline PdI.
- If PdI indicates heterogeneity, prepare a dilution series of the sample. Measure each dilution to rule out concentration-dependent effects (e.g., weak reversible association).
- Apply the NNLS algorithm consistently across all measurements using the same bin settings and iteration count.
- Compare Trends, Not Absolute Values: Observe if the relative positions and shapes of peaks in the NNLS distribution shift consistently with dilution. A stable peak position suggests a distinct species.
- Correlate with PdI: Plot the measured PdI vs. concentration. An increasing PdI with concentration often indicates aggregation or attractive interactions.
Visualization: DLS Data Analysis Decision Pathway
The Scientist's Toolkit: Essential Research Reagents & Materials
Table 2: Key Reagents for DLS Troubleshooting in Protein Studies
| Item | Function & Importance |
|---|---|
| Anapore / Ultrafine Filters (0.02 µm) | Critical for clarifying buffers and solvents to remove particulate noise, the most common source of DLS artifacts. |
| Nanoparticle Size Standard (e.g., 60 nm Latex) | Used for daily instrument validation and performance qualification (PQ) to ensure accurate sizing. |
| Low-Volume Disposable Cuvettes (e.g., 12 µL) | High-quality, disposable cuvettes prevent cross-contamination and eliminate cleaning artifacts. |
| Ultrapure Water (≥18.2 MΩ·cm) | Essential for preparing buffers and cleaning. Ionic impurities can affect particle diffusion. |
| Standard Reference Protein (e.g., BSA) | A stable, monodisperse protein used as a system suitability control to benchmark performance. |
| Viscosity Standard | Required for calibrating the viscometer used to determine exact buffer viscosity for accurate hydrodynamic radius calculation. |
| Syringe Filters (0.1 µm, PES) | For pre-filtering protein samples where 0.02 µm may cause undue sample loss. |
Standard Operating Procedure (SOP) for Reliable DLS of Sensitive Proteins
This SOP provides a standardized protocol for performing Dynamic Light Scattering (DLS) analysis on sensitive, aggregation-prone proteins. It is designed to generate reliable size and polydispersity data, critical for research on protein heterogeneity and stability. This document is integral to a broader thesis on DLS troubleshooting for resolving broad peaks in protein research.
Pre-Measurement Protocols
Sample Preparation
Objective: To obtain a monodisperse, dust-free protein sample suitable for DLS.
- Buffer Preparation & Clarification: Filter all buffers through a 0.02 μm inorganic membrane filter (e.g., Anotop syringe filter) into meticulously cleaned glassware. Do not use cellulose filters.
- Protein Handling: Thaw frozen protein aliquots rapidly at room temperature or in a 4°C water bath. Avoid repeated freeze-thaw cycles. Centrifuge the protein solution at 16,000-20,000 x g for 10-15 minutes at the measurement temperature immediately prior to loading into the cuvette.
- Concentration Selection: Use the minimum concentration that yields an acceptable signal-to-noise ratio (typically 0.1-1 mg/mL for most proteins). Perform a concentration series to check for concentration-dependent aggregation.
- Cuvette Cleaning: Rinse the cuvette sequentially with filtered 20% Hellmanex III, copious amounts of ultrapure filtered water (0.02 μm), and finally with filtered measurement buffer. Dry using filtered, oil-free air or vacuum.
Instrument Calibration & Setup
- Temperature Equilibration: Allow the sample chamber to equilibrate at the target temperature for at least 15-30 minutes before measurement.
- Standard Verification: Validate instrument performance using a monodisperse standard (e.g., 60 nm or 100 nm polystyrene nanospheres) with a known polydispersity index (PdI < 0.05). The measured size should be within 1-2% of the certified value.
Core Measurement Procedure
- Load the clarified supernatant into the clean cuvette, avoiding bubbles.
- Insert the cuvette into the pre-equilibrated instrument.
- Set measurement parameters:
- Number of Runs: Minimum 10-15 runs per measurement.
- Run Duration: 10-30 seconds per run, adjusted based on sample scattering intensity.
- Attenuator/ND Filter: Set to achieve an ideal detected photon count rate (consult instrument manual; often 200-800 kcps).
- Initiate measurement.
- Repeat: Perform a minimum of three independent measurements from the same prepared sample to assess repeatability.
Data Acquisition & Analysis Parameters
- Correlation Function: Ensure the correlogram decays smoothly to baseline. Do not analyze truncated or noisy correlograms.
- Analysis Algorithm: Use the "Cumulants" method for initial analysis to obtain the Z-average hydrodynamic diameter (Z-avg. d.h.) and Polydispersity Index (PdI).
- High-Resolution Analysis: For samples with PdI > 0.1, apply "Multiple Narrow Modes" or "Non-Negative Least Squares (NNLS)" algorithms to deconvolute size distributions. Interpret these results qualitatively alongside cumulants data.
- Quality Thresholds: Record data only if the correlogram fit residual is low and the baseline convergence is >0.95.
The Scientist's Toolkit: Research Reagent Solutions
| Item | Function |
|---|---|
| Zirconia-coated Quartz Cuvettes | Low-adhesion, high-durability cuvettes that minimize protein adsorption compared to standard plastic cuvettes. |
| Anotop 0.02 μm Inorganic Filters | Aluminum oxide membrane filters for ultrapure buffer clarification without introducing extractables. |
| Polystyrene Nanosphere Standards | Monodisperse particles (e.g., 30 nm, 60 nm, 100 nm) for daily instrument validation and performance checks. |
| Hellmanex III Solution | Specially formulated alkaline cleaning concentrate for removing organic contaminants from optical components. |
| Size Exclusion Chromatography (SEC) Buffer | A pre-optimized, filtered, and degassed buffer for online DLS-SEC to separate species before measurement. |
| Stabilizing Additives | Ready-to-use stocks of non-ionic detergents (e.g., 10% Tween-20) or reducing agents (e.g., 1M TCEP) for testing sample stability. |
Data Tables for Quality Control
Table 1: Acceptable Ranges for DLS Measurement Quality Metrics
| Metric | Ideal Value | Acceptable Range | Action Required If Outside Range |
|---|---|---|---|
| Baseline Convergence | 1.000 | > 0.95 | Check for dust, bubbles, or insufficient measurement duration. |
| PdI (Cumulants) | < 0.05 | 0.05 - 0.7 | Values >0.7 indicate a very polydisperse sample unsuitable for cumulants analysis. |
| Count Rate (kcps) | Instrument-specific | Stable, within ±10% | Large fluctuations indicate aggregation or settling. |
| Z-avg. d.h. Variation (between repeats) | < 2% | < 5% | Investigate sample preparation consistency. |
Table 2: Troubleshooting Guide for Broad Peaks/High PdI
| Symptom | Possible Cause | Diagnostic Experiment | Corrective Action |
|---|---|---|---|
| Very broad or multimodal size distribution | Sample heterogeneity (oligomers, aggregates), or presence of dust/fibrils. | 1) Filter sample through a 0.1 μm filter (note: may remove large species).2) Perform SEC-DLS. | Improve purification, add stabilizers, optimize buffer, ultracentrifuge sample. |
| PdI decreases with protein concentration | Attractive protein-protein interactions (self-association). | Measure DLS across a concentration series (0.1-2 mg/mL). | Report size at lowest measurable concentration. Consider changing buffer ionic strength/pH. |
| Spurious large particle peak | Particulate contamination (dust, microaggregates). | Measure filtered buffer blank. Intensify cleaning protocol for cuvettes and buffers. | Meticulously filter all buffers and clean cuvettes. Centrifuge sample immediately before loading. |
| Unstable correlogram baseline | Sample is aggregating or settling during measurement. | Monitor count rate and correlogram in real-time over 30 minutes. | Reduce measurement temperature, include stabilizing excipients, use a flow-cell system. |
Visual Workflows & Diagnostics
Experimental Workflow for Sensitive Protein DLS
Title: DLS SOP Workflow for Sensitive Proteins
Diagnostic Pathway for High Polydispersity (PdI)
Title: Diagnostic Pathway for High PdI Results
Frequently Asked Questions (FAQs)
Q1: My protein sample gives a reliable size but the PdI is consistently between 0.2 and 0.3. Is this acceptable, or does it indicate a problem? A: A PdI in this range indicates a moderately polydisperse sample. For sensitive proteins, this is common and may reflect the presence of a stable monomer-oligomer mixture rather than an artifact. It is acceptable data, but must be reported alongside the size distribution from NNLS analysis. Investigate further using SEC-DLS to separate the populations.
Q2: I centrifuged my sample, but I still get a sporadic huge particle spike in my distribution. What else can I do? A: This is classic evidence of dust or micro-bubbles. Ensure: 1) The cuvette is cleaned with Hellmanex and rinsed with filtered water, 2) The buffer is filtered immediately before use, 3) The sample is loaded carefully along the cuvette wall to avoid bubble formation, and 4) The cuvette window is not touched. Running multiple consecutive measurements can help identify sporadic spikes.
Q3: How do I differentiate between a true oligomer and non-specific aggregation? A: Perform two diagnostic experiments: 1) Concentration Series: True oligomers often show a concentration-dependent equilibrium. Non-specific aggregation may appear more stochastic. 2) Stability Over Time: Monitor the size distribution over 1-2 hours at the measurement temperature. A stable oligomeric distribution will be constant, while non-specific aggregation will show a progressive shift to larger sizes.
Q4: Should I filter my protein sample through a 0.22 μm or 0.1 μm filter before DLS? A: Generally, do not filter the protein solution post-purification, as you may remove genuine large species or adsorb protein to the filter. The key is to ultracentrifuge (e.g., 16,000-20,000 x g) the sample immediately before loading. Filter only the buffer. If filtration is absolutely necessary, use low-protein-binding filters and note that the size distribution will be altered.
Q5: What is the single most critical step in this SOP for getting reproducible data? A: The most critical step is the final ultracentrifugation of the protein sample in its measurement buffer at the measurement temperature, immediately (<5 minutes) before loading into the cuvette. This step removes pre-existing aggregates and micro-particulates that are the most common source of high PdI and unreliable measurements.
Troubleshooting Guides & FAQs
Q1: Why do I observe a sudden, large increase in polydispersity index (PdI) during a thermal stress study?
A: A sharp rise in PdI often indicates sample aggregation or the onset of phase separation. First, verify sample preparation: ensure the buffer is filtered (0.1 µm) and degassed to eliminate dust. Check for temperature equilibration; a 2-minute wait post-temperature jump is standard. If the issue persists, perform a quick size distribution by intensity check. A secondary peak >1000 nm confirms aggregation. Troubleshooting Protocol: 1) Centrifuge sample at 10,000 rpm for 5 minutes to remove large aggregates, then re-analyze supernatant. 2) Prepare a fresh sample vial to rule out adsorption to the cuvette. 3) Verify that the chosen temperature ramp rate (e.g., 1°C/min) is not too aggressive for your protein.
Q2: My intensity-based size distribution shows multiple broad peaks. How do I determine if this is true heterogeneity or an artifact?
A: Broad or multiple peaks require validation. Follow this Decision Protocol: Step 1: Switch to Volume or Number distribution. If the secondary peak disappears, it likely represents a minute amount of large aggregates (common in stressed samples). Step 2: Perform a filter validation test. Pass the sample through a 0.02 µm syringe filter. Re-analyze. A消失的 peak indicates large, filterable particles. Step 3: Cross-validate with a orthogonal technique (e.g., SEC-MALS) from a separately stressed aliquot.
Q3: How should I handle and interpret the correlation function when it decays very quickly or shows multiple inflection points?
A: A fast decay suggests the presence of very small particles or free fluorophores. Multiple inflections indicate multiple diffusional modes. Methodology: 1) Always visually inspect the correlation function plot. It should be a smooth, single exponential decay for a monodisperse sample. 2) For multiple inflections, use the CONTIN or NNLS algorithm (not cumulants) to resolve the distribution. 3) Ensure the Baseline parameter in the software is correctly set, typically to 1. A value significantly different may indicate scattering from contaminants.
Q4: What is the minimum change in hydrodynamic radius (Rh) I can reliably detect between two time points in a long-term stability study?
A: The detection limit depends on instrument precision and sample. For a stable, monodisperse (PdI < 0.05) protein standard, a well-aligned modern DLS can detect a ~0.1 nm change. For real-world stability samples, a change exceeding 0.3 nm or 5% of the initial Rh is typically considered significant. Track the Coefficient of Variance (CV) of 5-10 consecutive measurements at each time point.
Table 1: Typical DLS Parameter Shifts Under Common Stress Conditions
| Stress Condition | Expected Rh Change (Monomer) | PdI Alert Threshold | Common New Peak(s) Appearance |
|---|---|---|---|
| Thermal (5°C above Tm) | Increase >15% | >0.25 | >100 nm & 2-5 nm (fragments) |
| Agitation (24h, vortex) | Variable | >0.3 | 500 - 2000 nm (sub-visible) |
| pH Shift (to pI ± 0.5) | Increase >10% | >0.4 | 100 - 500 nm (amorphous agg.) |
| Long-Term (4°C, 4 weeks) | Increase >5% | >0.15 | 10-50 nm (soluble oligomers) |
Table 2: Troubleshooting Matrix for Common Artefacts
| Symptom | Possible Cause | Diagnostic Experiment | Solution |
|---|---|---|---|
| Spiky, unreproducible correlation function | Dust or bubbles in path | Repeat measurement 5x; inspect cuvette | Ultra-filtration of buffer; degassing; clean cuvette |
| Rh consistently too small | Viscosity not corrected | Measure buffer viscosity at exact temperature | Enter known viscosity/correct refractive index |
| Intensity fluctuates wildly | Sample precipitation | Visual inspection; check count rate | Centrifuge sample; consider stabilizing excipient |
Experimental Protocols
Protocol 1: Standardized DLS Thermal Ramp Stress Test
- Sample Prep: Dialyze protein into desired buffer. Filter using 0.1 µm syringe filter (non-adsorptive). Centrifuge at 14,000 x g for 10 min.
- Instrument Setup: Equilibrate DLS instrument at starting temperature (e.g., 20°C) for 30 min. Use a constant measurement position. Set angle to 173° (backscatter).
- Measurement Parameters: Set automated temperature ramp from 20°C to 80°C at 1°C/min. At each 2°C interval, hold for 2 min, then acquire data: 10 runs of 10 seconds each.
- Data Acquisition: Record mean Rh (Z-average), PdI, and correlation function at each step. Export intensity and volume distributions at key transition points (e.g., at PdI = 0.3, 0.5).
- Analysis: Plot Rh and PdI vs. Temperature. Identify melting temperature (Tm) as inflection point of Rh. Use distribution plots to classify aggregation onset.
Protocol 2: Forced Degradation Cross-Validation Workflow
- Stressed Aliquot Creation: Subject a single protein batch to multiple stresses (heat, light, agitation, freeze-thaw) in parallel.
- DLS Primary Screen: Analyze all aliquots per Protocol 1. Record primary peak Rh, % Intensity in aggregates.
- SEC-MALS Validation: Inject the same aliquots onto an SEC column coupled to MALS. Compare Rh from DLS (hydrodynamic) vs. SEC-MALS (radius of gyration, Rg). Calculate Rg/Rh ratio.
- Data Integration: A ratio ~0.77 suggests a solid sphere, >1.0 indicates an elongated structure. Confirm DLS-identified oligomers with SEC peak retention time.
Visualizations
Title: DLS Heterogeneity Diagnosis Decision Tree
Title: DLS Stability Study Core Experimental Workflow
The Scientist's Toolkit: Research Reagent Solutions
Table 3: Essential Materials for DLS Stability Studies
| Item | Function & Rationale |
|---|---|
| Nanopure Water (≥18.2 MΩ·cm) | Prevents scattering interference from ionic contaminants. Essential for buffer preparation and cleaning. |
| Anotop 0.02 µm Syringe Filter (Inorganic Membrane) | For final sample filtration. Low protein adsorption and effective removal of large aggregates/artifacts. |
| Disposable Micro Cuvettes (UVette, ZEN0040) | Prevents cross-contamination and cuvette etching from harsh buffers. Ensures consistent pathlength. |
| BSA Standard (Monodisperse) | System suitability test. Validates instrument performance and measurement protocol daily. |
| Viscosity Standard (e.g., Sucrose Solution) | For calibrating/verifying instrument viscosity settings, critical for accurate Rh calculation. |
| Non-ionic Surfactant (e.g., Polysorbate 20) | Used in control experiments to differentiate between colloidal (surfactant-reversible) and covalent aggregation. |
| Stabilizing Excipients (Trehalose, Sucrose) | Positive controls in formulation studies. Their known stabilizing effect helps benchmark stress conditions. |
Systematic Troubleshooting of Broad DLS Peaks: A Step-by-Step Diagnostic Workflow
Troubleshooting Guides & FAQs
Q1: Why do I obtain broad, multimodal peaks in my DLS measurement of a supposedly pure protein? A: This is a classic sign of sample heterogeneity, often stemming from Step 1. Common pitfalls include:
- Insufficient Purity: Contaminants like aggregates, fragments, or residual nucleic acids from purification can co-exist with your target protein. Always cross-verify purity with a complementary technique like SDS-PAGE or CE-SDS.
- Inaccurate Concentration: Overestimation of concentration (e.g., using A280 without a corrected extinction coefficient or with contaminating absorbers) leads to loading too much sample, causing non-specific interactions and aggregation. Underestimation can lead to signal-to-noise issues.
- Sample Buffer Incompatibility: The buffer must be meticulously filtered (0.02 µm) and matched for refractive index. High salt concentrations or glycerol can cause artifactual broadening.
Q2: My SDS-PAGE looks clean, but DLS still shows heterogeneity. What could be wrong? A: SDS-PAGE assesses purity under denaturing conditions and may miss non-covalent oligomers or aggregates that are critical in DLS (which measures hydrodynamic size under native conditions). Common pitfalls:
- Sample History: Repeated freeze-thaw cycles or inadequate storage (e.g., missing protease inhibitors) can degrade the protein after the purity check.
- Dynamic Equilibrium: The protein may be in a slow monomer-oligomer equilibrium. Techniques like SEC-MALS or native PAGE are better for diagnosing this.
- Buffer/Presence of Ligands: The native buffer condition (pH, ions, co-factors) during DLS measurement can promote association or dissociation not seen in SDS-PAGE.
Q3: What are the best practices for accurate concentration measurement before DLS? A:
- Use at least two orthogonal methods.
- For A280, use an accurately calculated or experimentally determined extinction coefficient. Correct for light scattering if turbidity is present (scan 320-350 nm).
- Perform a colorimetric assay (e.g., Bradford, BCA) as a cross-check, but be aware of buffer interference and protein-to-protein variability.
- For critical applications, quantitative amino acid analysis (AAA) is the gold standard.
Q4: How can I quickly diagnose if my sample prep is the root cause of broad DLS peaks? A: Implement the following diagnostic filter protocol:
- Centrifuge: Spin the sample at high speed (e.g., >15,000 x g) for 10-15 minutes immediately before DLS measurement.
- Filter: Pass the supernatant through a 0.1 µm syringe filter (low protein binding material like PVDF).
- Re-measure: Perform the DLS measurement immediately after steps 1 & 2. If the polydispersity index (PdI) or peak width improves dramatically, your initial sample contained large aggregates or particulate matter. Persistent broadness indicates inherent sample heterogeneity.
| Measurement Technique | Typical Precision | Key Interfering Factors | Recommended Use Case for DLS Prep |
|---|---|---|---|
| A280 (NanoDrop) | ± 5-10% | Light scattering, nucleic acids, turbidity | Quick check; requires pristine, clear samples. |
| A280 (Cuvette) | ± 2-5% | As above, but less sensitive to volume errors | Standard for purified proteins in known buffer. |
| Bradford Assay | ± 10-15% | Detergent, buffer composition (high salt) | Rapid, relative measurement; use a standard curve with the same protein. |
| BCA Assay | ± 5-10% | Reducing agents (e.g., DTT, β-mercaptoethanol) | More robust to some buffer components than Bradford. |
| Quantitative AAA | ± 1-3% | None; sample is hydrolyzed. | Absolute concentration for calibrating other methods. |
Experimental Protocols
Protocol 1: Cross-Verification of Protein Concentration
Objective: To obtain an accurate protein concentration value using two orthogonal methods. Materials: Purified protein sample, compatible buffer, spectrophotometer (cuvette-based preferred), BCA assay kit, microplate reader. Steps:
- A280 Measurement:
- Blank the spectrophotometer with your exact dialysis or storage buffer.
- Measure absorbance of your sample at 280 nm (A280) and at 320 nm (A320) or 340 nm to assess light scattering baseline.
- Calculate concentration: C (mg/mL) = (A280 – A320) / Extinction Coefficient (mg/mL·cm).
- BCA Assay Measurement:
- Prepare a standard curve from 5-200 µg/mL using BSA or your protein if available.
- Dilute your unknown sample to fall within the standard curve range (typically 1:10 to 1:50 dilution).
- Perform the BCA assay according to the manufacturer's microplate protocol.
- Determine concentration from the standard curve, applying the dilution factor.
- Analysis:
- Compare the two values. Agreement within 10-15% increases confidence.
- If values differ significantly, investigate interference (check buffer components against assay guidelines) or consider AAA for arbitration.
Protocol 2: Diagnostic Filtration & Centrifugation for DLS Sample Prep
Objective: To isolate the contribution of large, non-specific aggregates to DLS polydispersity. Materials: Protein sample, tabletop microcentrifuge, 0.1 µm PVDF syringe filters, DLS cuvettes. Steps:
- Initial Measurement: Perform a DLS measurement on the prepared sample as per your standard protocol. Record the PdI and size distribution.
- High-Speed Centrifugation: Aliquot the sample into a clean microcentrifuge tube. Centrifuge at 16,000 x g for 15 minutes at 4°C (or your protein's stable temperature).
- Careful Extraction: Without disturbing the pellet (if visible), carefully extract the top ~80% of the supernatant.
- Filtration: Pass the supernatant through a 0.1 µm low-protein-binding PVDF syringe filter.
- Final Measurement: Immediately load the filtered supernatant into a clean DLS cuvette and perform the measurement under identical conditions.
- Interpretation: A significant reduction in PdI or disappearance of larger hydrodynamic radius (Rh) peaks indicates the initial sample contained reversible or particulate aggregates. Persistent broadness suggests intrinsic conformational heterogeneity or stable oligomers.
Visualization: DLS Troubleshooting Workflow
DLS Heterogeneity Initial Diagnosis
The Scientist's Toolkit: Research Reagent Solutions
| Item | Function in DLS Sample Verification |
|---|---|
| 0.02 µm & 0.1 µm Filters | For filtering buffer and sample, respectively, to remove dust and large aggregates that cause spurious scattering. |
| Amicon Ultracel Centrifugal Filters | For buffer exchange into optimal DLS buffer (e.g., low salt, no fluorescers) and sample concentration. |
| DTT or TCEP | Reducing agents to break spurious disulfide bonds that may cause non-native aggregation. |
| Protease Inhibitor Cocktail | Prevents proteolytic degradation during purification and storage, preserving sample integrity. |
| BSA Standard (Fatty Acid-Free) | For generating accurate standard curves in colorimetric concentration assays (BCA, Bradford). |
| Dynamic Light Scattering Cuvettes | Low-volume, ultra-clear, disposable cuvettes to prevent carryover contamination and minimize dust introduction. |
| Gel Filtration Markers | A set of monodisperse proteins of known size (e.g., thyroglobulin, BSA) for periodic calibration and validation of DLS instrument performance. |
| Sucrose or Glycerol | For stabilizing proteins during storage, but must be removed or matched in reference buffer for DLS measurement. |
Troubleshooting Guides & FAQs
Q1: How can I differentiate between a true polydisperse protein sample and a signal caused by dust or micro-bubbles in DLS?
A: True polydispersity typically shows a consistent, reproducible size distribution across multiple measurements, albeit with broad peaks. Dust and bubbles often cause sporadic, very high-intensity scattering events (spikes) that result in non-reproducible size distributions, often with an apparent large micron-sized component. Centrifugation or filtration of the sample will eliminate dust/bubble artifacts but not true sample heterogeneity.
Q2: What is the most effective protocol to remove dust from protein samples prior to DLS measurement?
A: The standard protocol is twofold:
- Ultracentrifugation: Spin the sample at >10,000-15,000 x g for 10-15 minutes at the experimental temperature (e.g., 4°C or 25°C).
- Membrane Filtration: Carefully extract the top 80-90% of the supernatant and pass it through a low-protein-binding, non-fiber releasing syringe filter. An appropriate pore size is critical.
Table 1: Filter Pore Size Selection Guide
| Expected Protein Size / Oligomer State | Recommended Filter Pore Size | Purpose |
|---|---|---|
| Monomers, small oligomers (< 100 kDa) | 0.02 µm (20 nm) or 0.1 µm (100 nm) | Removes submicron dust & aggregates |
| Large complexes, viruses (100-500 nm) | 0.22 µm | Removes bacteria & large particulates |
| Cells, large aggregates (> 0.5 µm) | 0.45 µm or 0.8/1.2 µm prefilters | Clarification, removes gross contaminants |
Q3: Air bubbles are a persistent issue. How do I prevent their formation during cuvette loading?
A: Bubbles often form from vigorous pipetting or temperature changes. Follow this workflow:
- Pre-rinse the cuvette with filtered buffer.
- Load the sample slowly down the side of the cuvette's chamber using a pipette with a smooth, steady action.
- Tap the cuvette gently on the bench to dislodge any bubbles.
- Let the loaded cuvette equilibrate to the instrument temperature for 1-2 minutes before measurement, as temperature gradients can cause bubble formation.
Q4: My sample is from cell lysate. How do I address contamination from cellular debris or extracellular vesicles?
A: Cellular components can be mistaken for protein aggregates. A rigorous clarification protocol is essential.
- Initial Clarification: Centrifuge lysate at 2,000-5,000 x g for 10 minutes to remove nuclei and large debris.
- Ultracentrifugation: For vesicle-free supernatant, centrifuge at 100,000 x g for 60+ minutes. This pellets membranes, large vesicles, and remaining large aggregates.
- Filtration: Pass the final supernatant through a 0.22 µm filter. Note: This will also remove beneficial exosomes or viruses if present.
Q5: Are there quantitative thresholds for distinguishing contaminant signals from real sample signals?
A: While context-dependent, the following table provides general guidance based on intensity-weighted DLS distributions.
Table 2: Quantitative Indicators of Common Contaminants
| Contaminant | Typical Apparent Size (d.nm) | % Intensity in Peak | Correlogram Feature | Solution |
|---|---|---|---|---|
| Dust / Large Aggregate | > 1000 nm | Highly variable, often <1% but dominates scattering | Low amplitude, noisy baseline | Filtration (0.02/0.1 µm) |
| Micro-bubbles | 2000 - 5000+ nm | Sporadic, can be >10% in a single run | Severe distortion, non-exponential decay | Careful loading, degassing |
| Residual Cell Debris | 300 - 800 nm | Consistent but reducible | Slight baseline offset | 100,000 x g centrifugation |
| True Protein Aggregates | Varies (e.g., 50-200 nm) | Reproducible and stable | Smooth, reproducible decay | Reformulate buffer, add stabilizer |
The Scientist's Toolkit: Key Research Reagent Solutions
Table 3: Essential Materials for Sample Clarification in DLS
| Item | Function & Key Feature |
|---|---|
| Low-Protein-Binding 0.1 µm Syringe Filter (e.g., PVDF or PTFE membrane) | Gold-standard for final filtration of most protein samples; minimizes sample loss. |
| Ultracentrifuge & Polycarbonate Bottles | For high-g-force pelleting of vesicles, large aggregates, and debris. |
| Precision Glass or Quartz Cuvettes | Minimizes static charge that attracts dust; must be scrupulously cleaned. |
| Degassed Buffer | Buffer degassed by vacuum filtration or sonication reduces bubble formation. |
| Non-ionic Surfactant (e.g., 0.005% Tween-20) | Can be added to buffers to reduce surface tension and bubble persistence. Use with caution as it may interact with proteins. |
| Nanoparticle-Free Water & Buffers | Used for final instrument and cuvette rinsing to prevent introduction of new particles. |
Experimental Protocols
Protocol 1: Standard Sample Clarification for DLS
- Prepare your protein sample in its final formulation buffer.
- Optional Degassing: Filter buffer through a 0.22 µm membrane under vacuum for 5 minutes prior to use.
- Centrifugation: Transfer sample to a microcentrifuge tube compatible with high speeds. Centrifuge at 14,000 x g for 10 minutes at the measurement temperature.
- Filtration: Using a fresh pipette tip, extract the top 80% of the supernatant. Pass it through a low-protein-binding 0.1 µm (or size-appropriate) syringe filter into a clean tube.
- Loading: Gently load the filtered sample into a clean, pre-rinsed (with filtered buffer) DLS cuvette. Avoid introducing bubbles.
- Equilibration: Place the cuvette in the instrument and allow temperature to equilibrate for 2 minutes before starting measurement.
Protocol 2: Advanced Clarification for Cell Culture Supernatants or Lysates
- Clarification Spin: Centrifuge the crude sample at 4,000 x g for 15 minutes at 4°C. Transfer supernatant to ultracentrifuge tube.
- Ultracentrifugation: Centrifuge at 100,000 x g for 60 minutes at 4°C.
- Harvest: Carefully collect the top 90% of the supernatant, avoiding the pellet.
- Final Filtration: Pass the supernatant through a 0.22 µm syringe filter.
- Proceed to DLS measurement as in Protocol 1, steps 5-6.
Visualizations
In Dynamic Light Scattering (DLS) analysis for protein heterogeneity research, broad or multimodal peaks present a significant interpretation challenge. This guide addresses how to deconvolute contributions from large aggregates and small fragments within an intensity-weighted distribution by critically comparing it to volume- or number-weighted distributions.
FAQs & Troubleshooting
Q1: My DLS intensity distribution shows a single broad peak. Does this mean my sample is monodisperse? A: No. A single broad intensity peak can mask underlying heterogeneity. The intensity distribution heavily weights larger particles (e.g., aggregates) by the sixth power of their radius (I ∝ r⁶). A small population of aggregates can dominate the signal, obscuring a predominant monomer or fragment population. You must analyze the volume or number distribution derived from the intensity data.
Q2: After converting to a volume distribution, I see a major peak at a smaller size and a minor peak for aggregates. Which one represents the true sample composition? A: The volume distribution provides a more mass-proportional representation. The major peak at the smaller size likely represents the true predominant species (e.g., protein monomer or fragment). The minor aggregate peak confirms its presence but corrects for its exaggerated contribution in the intensity plot. The number distribution further emphasizes the most numerous particles.
Q3: What specific criteria indicate successful deconvolution of aggregates from fragments? A: Successful deconvolution is indicated by:
- A clear separation of populations in the volume/number distribution not obvious in the intensity plot.
- The volume percentage of the main species being >90% for a "pure" monomeric sample.
- Consistent size values for the monomer peak across intensity, volume, and number distributions (though the peak amplitude will differ).
Q4: My software-derived volume distribution still shows a significant aggregate peak. Is this real or an artifact? A: It is likely real but may be exaggerated if the baseline correction or fitting algorithm (e.g., CONTIN) is improperly set. Verify by:
- Checking the raw correlation function for multiple decay rates.
- Using a high signal-to-noise ratio (>50).
- Comparing results from multiple analysis algorithms provided by your instrument software.
Q5: How do I handle samples where aggregates and fragments are very close in size (e.g., dimer vs. truncated monomer)? A: DLS has limited resolution for closely spaced sizes. In this case:
- Use the Polydispersity Index (PdI). A PdI >0.1 suggests significant heterogeneity.
- Confirm with an orthogonal method like Size-Exclusion Chromatography coupled to Multi-Angle Light Scattering (SEC-MALS).
- Ensure sample is at a high enough concentration for good signal but below the concentration where intermolecular interactions become significant.
Key Experimental Protocol: Deconvolution via Multi-Modal DLS Analysis
Objective: To accurately resolve the size contributions of protein aggregates and fragments from a broad intensity distribution.
Materials & Procedure:
- Sample Preparation: Filter all buffers (0.02 µm filter) and centrifuge protein samples (e.g., 15,000 x g, 10 min, 4°C) to remove dust.
- DLS Measurement: Load sample into a clean, low-volume cuvette. Equilibrate to measurement temperature (typically 20°C or 25°C) for 2 minutes.
- Data Acquisition: Set number of runs to 10-15, with duration automatic. Perform a minimum of 3 technical replicates.
- Initial Analysis: Examine the intensity-weighted size distribution plot. Note the peak position(s) and breadth.
- Key Deconvolution Step: In the analysis software, select the option to view volume-weighted and/or number-weighted distributions derived from the intensity data using Mie theory or the instrument's proprietary conversion algorithm.
- Comparative Analysis: Place the intensity, volume, and number distributions on the same graph for direct comparison (see table below).
- Quantification: Use the software's integration tool to report the percentage volume or percentage number for each resolved peak.
Data Interpretation Table:
| Distribution Type | Dominant Peak Size (d.nm) | % Intensity | % Volume | % Number | Interpretation |
|---|---|---|---|---|---|
| Intensity | 1.2 & 8.5 | 75% (8.5 nm) | - | - | Suggests large aggregates dominate. |
| Volume | 1.2 & 8.5 | - | 92% (1.2 nm) | - | Corrects view: sample is mostly monomer. |
| Number | 1.2 | - | - | >99% (1.2 nm) | Confirms fragments/monomers are most numerous. |
The Scientist's Toolkit: Key Research Reagent Solutions
| Item | Function in DLS Sample Prep |
|---|---|
| ANAPURE 0.02 µm Filtered Buffers | Pre-filtered, particulate-free buffers to minimize dust interference. |
| NANOCLEAN Zirconium Oxide Cuvettes | Low-volume, low-adsorption cuvettes for precious protein samples. |
| STABILIGUARD Protein Stabilizer | Additive to prevent aggregate formation in situ during measurement. |
| AGGRESOLVE Size Standard Kit | A set of monodisperse nanospheres (2 nm, 10 nm) for instrument validation and deconvolution algorithm calibration. |
| SEC-MALS Calibration Standard (BSA Monomer) | Used as a system suitability control for orthogonal confirmation of DLS results. |
Visualizing the Deconvolution Workflow
Troubleshooting Guides & FAQs
Q1: My DLS measurements show a broad, multimodal size distribution after adding a specific excipient. What does this indicate and how should I proceed? A: A broad or multimodal distribution often indicates protein aggregation or conformational changes induced by excipient incompatibility. First, verify if the excipient alters the solution's ionic strength (salt) or critical micelle concentration (surfactant). Conduct a control DLS measurement of the excipient alone in buffer to rule out particulate contamination. Proceed with a systematic screen, varying one excipient concentration at a time while monitoring the hydrodynamic radius (Rh) and polydispersity index (PdI).
Q2: How does a change in formulation pH lead to increased heterogeneity in DLS readings? A: pH changes can alter protein net charge, leading to reduced electrostatic repulsion and promoting aggregation. It can also induce conformational instability if the pH shifts away from the protein's pI or optimal stability range. This results in a larger apparent Rh and increased PdI. Always cross-verify with a technique like dynamic electrophoretic light scattering (mobility) to decouple size from charge effects.
Q3: Why does a surfactant, intended to prevent aggregation, sometimes cause broader DLS peaks? A: Surfactants can form micelles at concentrations above their CMC, which DLS will detect as a separate population. If the protein interacts with micelles or surfactant monomers, it can form protein-surfactant complexes of varying stoichiometry, leading to peak broadening. Measure the surfactant solution alone above and below its reported CMC to identify its signal.
Q4: My protein has a consistent Rh in pure buffer but shows heterogeneity upon adding a specific salt. Is this a real effect or an artifact? A: It is likely real. Salts can cause "salting-out" (precipitation/aggregation) at high concentrations or induce specific ion effects (Hofmeister series) that perturb protein hydration and conformation. High salt can also affect the solvent viscosity and refractive index; ensure these correct parameters are entered into the DLS software for accurate calculation.
Table 1: Common Excipient Effects on DLS Metrics for a Model Monoclonal Antibody (5 mg/mL)
| Excipient Class | Example | Concentration Range | Impact on PdI | Probable Cause |
|---|---|---|---|---|
| Salt | NaCl | 0 - 150 mM | Low to Moderate Increase | Electrostatic shielding, weak aggregation |
| Salt | (NH₄)₂SO₄ | 0 - 100 mM | Sharp Increase >50mM | Salting-out aggregation |
| Surfactant (Non-ionic) | Polysorbate 20 | 0 - 0.1% v/v | Decrease (if below CMC) | Surface stabilization |
| Surfactant (Non-ionic) | Polysorbate 20 | >0.1% v/v | Increase, New Peak | Micelle formation (Rh ~5-10 nm) |
| pH Shift | Histidine Buffer | pH 6.0 (pI) | Maximum PdI | Minimum electrostatic repulsion |
| pH Shift | Histidine Buffer | pH 5.5 or 7.0 | Lower PdI | Increased net charge, stabilization |
Experimental Protocols
Protocol 1: Systematic Excipient Incompatibility Screen Using DLS
- Prepare Stock Solutions: Prepare a high-concentration stock solution of the protein in its primary formulation buffer. Separately, prepare concentrated stock solutions of the excipients (salts, surfactants, buffers for pH) in the same base buffer.
- Formulate Samples: Use serial dilution or gravimetric addition to create a matrix of samples where the protein concentration is held constant, and the excipient concentration is varied. Include a protein-only control in base buffer.
- Equilibration: Allow all samples to equilibrate at the measurement temperature (typically 20-25°C) for at least 15 minutes.
- DLS Measurement: Load samples into a clean, low-volume cuvette. Perform measurement with an appropriate number of runs (≥10) and duration (≥10 seconds each). Set instrument to auto-attenuate and auto-correlate.
- Data Analysis: Record the Z-average hydrodynamic diameter (or Rh), PdI, and intensity size distribution for each sample. Plot Rh and PdI vs. excipient concentration to identify incompatibility thresholds.
Protocol 2: Disentangling Surfactant Micelle Signals from Protein Signals
- Blank Measurement: Perform DLS on formulation buffer containing the surfactant at the target use concentration. Note the size and intensity of any populations.
- Sample Measurement: Measure the protein formulation with surfactant.
- Data Deconvolution: If the surfactant-alone sample shows a population (e.g., micelles at ~5 nm), use the instrument's multiple narrow modes or CONTIN analysis to fit the protein+surfactant data. Look for a persistent peak at the micelle size and a separate peak for the protein. A shift in the protein peak or the appearance of a new, larger aggregate peak indicates interaction.
Visualization: Experimental Workflow for Buffer/Excipient Investigation
Diagram Title: DLS Excipient Incompatibility Investigation Workflow
Diagram Title: Pathways from Excipient Stress to DLS Heterogeneity
The Scientist's Toolkit: Research Reagent Solutions
Table 2: Essential Materials for Buffer & Excipient Compatibility Studies
| Item | Function & Relevance to DLS Troubleshooting |
|---|---|
| High-Purity Buffers (e.g., Histidine, Succinate, Phosphate) | Provide stable pH control. Low particulate grade is essential to avoid background scattering in DLS. |
| Salt Solutions (NaCl, (NH₄)₂SO₄, Arginine HCl) | Used to modulate ionic strength. Prepare as concentrated stocks for precise dilution; filter through 0.02μm membrane. |
| Surfactant Stocks (Polysorbate 20/80, Poloxamer 188) | Used to prevent surface-induced aggregation. Characterize CMC and filter stocks to remove pre-existing micelles/particulates. |
| Disposable Size-Exclusion Chromatography (SEC) Columns (e.g., Zeba Spin) | For rapid buffer exchange into test formulations, ensuring consistent starting protein state. |
| Low-Volume, High-Clarity DLS Cuvettes (e.g., Disposable microcuvettes) | Minimize sample volume (~30-50μL) and reduce dust/air bubble interference. Essential for high-throughput screening. |
| 0.02 μm Anatop or Syringe Filters | For critical filtration of all buffers and excipient stocks to remove particulate scattering contaminants. |
| DLS Software with CONTIN or Multiple Narrow Modes Analysis | Enables deconvolution of complex distributions (e.g., separating protein, aggregate, and micelle signals). |
Troubleshooting Guides & FAQs
Q1: Why does my DLS histogram show a broad, multimodal peak even after basic filtering and centrifugation? A: Broad or multimodal peaks often indicate unresolved sample heterogeneity or suboptimal instrument conditions. Key culprits specific to this step are incorrect temperature equilibration and unaccounted buffer viscosity. Ensure the sample is fully equilibrated at the set temperature (minimum 2 minutes for low volume cells, 5+ for others). For viscosity, manually input the correct value for your buffer at the experimental temperature; do not rely on water approximations. If issues persist, use the "Stabilization Delay" function to monitor size distribution over time for signs of aggregation.
Q2: How do I accurately determine buffer viscosity for corrections in my protein formulation? A: Use an Anton Paar micro-viscometer for direct measurement. Alternatively, calculate it using known standards. A standard protocol is below.
Protocol: Viscosity Determination via Reference Measurement
- Materials: Your protein buffer, a standard of known viscosity (e.g., toluene), a calibrated DLS instrument with temperature control.
- Procedure: Measure the diffusion coefficient (D) of a standard NIST-traceable latex sphere (e.g., 60 nm) in both your buffer and in pure water at the same precise temperature (e.g., 25.0°C).
- Calculation: Apply the relationship ηbuffer = ηwater × (Dwater / Dbuffer). The instrument software often automates this if the reference measurement is correctly set up.
- Input: Enter the calculated ηbuffer value into the software's viscosity field before analyzing your protein sample.
Q3: Temperature control seems unstable. How can I verify and correct this? A: Perform a "Temperature Verification Run." Protocol: Temperature Calibration Check
- Fill the cell with a standard (e.g., 100 nm polystyrene beads) in a solvent with a well-known, temperature-sensitive viscosity profile (like ethanol).
- Run consecutive size measurements at a set nominal temperature (e.g., 20°C) over 30 minutes.
- Plot the reported hydrodynamic radius (Rh) over time. A stable line indicates good control. A downward drift (decreasing Rh) suggests the actual temperature is increasing, causing lower solvent viscosity and a falsely higher D. Consult your instrument manual for hardware diagnostics.
Q4: After applying viscosity corrections, my monomer peak is sharper but a small aggregate population is now consistently visible. Should I ignore it? A: No. This is a critical finding for protein heterogeneity research. Advanced temperature and viscosity control increases resolution, revealing previously masked populations. This small aggregate peak is likely real and must be characterized. Proceed to Step 6 (Advanced Deconvolution and Model Fitting) to quantify its percentage and size.
Data Tables
Table 1: Impact of Viscosity Correction on Apparent Hydrodynamic Radius (Rh) Data for a monoclonal antibody (theoretical Rh ~5.0 nm) at 25°C.
| Buffer Composition | Viscosity (cP) @ 25°C | Uncorrected Rh (nm) | Viscosity-Corrected Rh (nm) | Peak Width (PdI) |
|---|---|---|---|---|
| Pure Water | 0.890 | 4.9 ± 0.1 | 4.9 ± 0.1 | 0.05 |
| PBS (1X) | 0.940 | 5.2 ± 0.3 | 4.95 ± 0.2 | 0.07 |
| Sucrose (10% w/v) | 1.310 | 7.1 ± 0.5 | 5.1 ± 0.2 | 0.06 |
Table 2: Effect of Temperature Stability on Measurement Precision Size measurement of a 30 nm protein complex over 1 hour.
| Temperature Stability (± °C) | Mean Rh (nm) | Standard Deviation (nm) | Observed Peak Broadening |
|---|---|---|---|
| < 0.1 | 30.2 | 0.4 | Minimal |
| 0.5 | 30.5 | 1.8 | Significant (>15% increase) |
| 1.0 | 31.1 | 3.5 | Very Broad / Bimodal artifact |
Diagrams
Title: DLS Temperature & Viscosity Optimization Workflow
Title: How Temp & Viscosity Affect DLS Size Calculation
The Scientist's Toolkit: Research Reagent Solutions
| Item | Function in Advanced DLS Optimization |
|---|---|
| NIST-Traceable Latex Nanosphere Standards | Used as reference materials to experimentally determine the precise viscosity of an unknown buffer via comparative diffusion measurement. |
| Micro Viscometer (e.g., Anton Paar) | Directly measures the absolute viscosity of small-volume (≤1 mL) buffer samples for accurate input into DLS software. |
| Precision Temperature Calibrator | A certified external probe to verify the accuracy and stability of the DLS instrument's temperature control system. |
| Stabilization Delay Software Module | Allows monitoring of the correlation function over time after loading to ensure thermal equilibrium is reached before measurement. |
| Formulation Buffers with Known Viscosity Profiles | Libraries of common buffers (e.g., PBS with sucrose, histidine, salts) with pre-characterized temperature-viscosity data for estimation. |
Beyond DLS: Validating Findings with Orthogonal Techniques for Definitive Characterization
Within the context of DLS troubleshooting for broad peaks and protein heterogeneity in research, dynamic light scattering (DLS) is a first-line, high-throughput technique for assessing hydrodynamic size and sample polydispersity. However, when DLS indicates a complex or heterogeneous sample, orthogonal techniques are required for resolution and validation. This technical support center guides researchers in selecting between Size Exclusion Chromatography with Multi-Angle Light Scattering (SEC-MALS), Analytical Ultracentrifugation (AUC), and Nanoparticle Tracking Analysis (NTA) to complement DLS data, providing troubleshooting and FAQs for common experimental challenges.
Troubleshooting Guides & FAQs
Q1: My DLS measurement of a purified protein shows a broad peak or high PdI. How do I determine if this is due to aggregation, a mixture of oligomers, or sample degradation? A: A broad DLS peak is ambiguous. Implement this orthogonal workflow:
- Immediately: Run NTA for direct visualization and concentration-based sizing. It can distinguish between a few large aggregates and a true polydisperse mixture.
- For Oligomer Resolution: Use SEC-MALS. The SEC column separates species by hydrodynamic volume, and MALS provides the absolute molar mass for each eluting peak, definitively identifying monomers, dimers, etc.
- For High-Resolution Heterogeneity Analysis: Use AUC (Sedimentation Velocity). It resolves species based on both mass and shape without a column, providing the most detailed view of sedimentation coefficients and interactions.
Q2: During SEC-MALS, I observe peak broadening or shoulder peaks not seen in UV alone. What could cause this? A: This indicates column interactions or post-separation aggregation.
- Troubleshooting Steps:
- Check Mobile Phase: Ensure optimal pH, ionic strength (e.g., 150-300 mM NaCl), and include a stabilizing agent (e.g., 1-5% glycerol).
- Verify Column Compatibility: Ensure the column pore size is appropriate for your protein's size range. Consider using a silica-based column for larger proteins or aggregates.
- Reduce Load Mass: Overloading can cause artifactual broadening. Reduce the injection concentration by 50% and re-run.
- Check for Filter Compatibility: Ensure protein is not adsorbing to in-line filters (use low-protein-binding membranes).
Q3: My AUC data shows non-ideal sedimentation, making the distribution model difficult to interpret. How should I proceed? A: Non-ideal behavior often suggests intermolecular interactions.
- Protocol Adjustment:
- Vary Sample Concentration: Run sedimentation velocity at 3-4 different loading concentrations (e.g., 0.2, 0.5, and 1.0 mg/mL). Concentration-dependent sedimentation coefficients (s-value) confirm self-association.
- Buffer Matching is Critical: The dialysate buffer must be used for the reference channel. Perform at least 12-24 hours of dialysis with 2-3 buffer changes.
- Model Selection: Use a continuous c(s) distribution model first to visualize all species, then apply discrete models if specific oligomers are suspected.
Q4: NTA reports a higher concentration of large particles than expected, but DLS did not show a significant population. Why the discrepancy? A: This is common and highlights technique sensitivity.
- Resolution: NTA is excellent at detecting and counting sparse, large aggregates (e.g., sub-micron particles) that are masked by an overwhelming number of monomers in a bulk DLS measurement. DLS intensity is weighted by the sixth power of diameter, so a few large particles can skew the distribution but may not be resolvable. The NTA result is likely correct for low-abundance large species. Confirm by filtering the sample through a 0.1 µm filter and re-measuring with NTA; the large particle count should drop significantly.
Q5: When analyzing a viral vector or lipid nanoparticle, which technique combination is most informative? A: For complex biologics, a multi-technique approach is standard.
- DLS: For rapid batch-to-batch size and PdI check.
- NTA: For absolute particle concentration (particles/mL) and visualizing the population distribution, crucial for dosing.
- SEC-MALS: To assess sample purity, separate empty from full capsids (based on different molar mass), and determine the empty/full ratio.
- AUC: To obtain the most precise size and density information, and to detect minor populations of aggregates or fragmented particles with high resolution.
Quantitative Technique Comparison Table
| Feature | DLS | SEC-MALS | AUC (Sedimentation Velocity) | NTA |
|---|---|---|---|---|
| Primary Measurement | Hydrodynamic radius (Rh) | Absolute molar mass (Mw) & Rh | Sedimentation coefficient (s), Molar mass | Particle size & concentration |
| Sample State | Batch, in solution | Separated by SEC column | Batch, in solution (centrifugal field) | Batch, in solution |
| Key Resolution Strength | Bulk average size & polydispersity index (PdI) | Resolves by size & identifies oligomers | High-resolution size & shape distribution | Visual counting, detects sparse aggregates |
| Concentration Range | 0.1 – 100 mg/mL (protein) | 0.1 – 5 mg/mL (post-column) | 0.01 – 10 mg/mL | 107 – 109 particles/mL |
| Typical Analysis Time | 1-3 minutes | 30-60 minutes | 4-12 hours | 2-5 minutes per video |
| Sample Consumption | Low (µL) | Moderate (µg-mg) | Low (µg) | Low (µL) |
| Main Limitation | Poor resolution of mixtures; intensity-weighted | Column interactions; shear stress | Long setup/analysis; expertise required | Lower size resolution; user-dependent tracking |
Experimental Protocols
Protocol 1: SEC-MALS for Oligomer State Determination
- Equipment/Column: HPLC system, UV detector, MALS detector (e.g., Wyatt DAWN), Refractive Index (RI) detector. Use a size-exclusion column suitable for the sample (e.g., Waters ACQUITY UPLC Protein BEH SEC Column, 200Å, 1.7 µm).
- Buffer Preparation: Use a filtered (0.1 µm) and degassed mobile phase (e.g., PBS, 150 mM NaCl, pH 7.4). Match sample buffer exactly via dialysis or desalting column.
- Sample Preparation: Clarify sample by centrifugation at 14,000 rpm for 10 minutes. Load 10-100 µL of sample at 1-5 mg/mL.
- Run Method: Isocratic elution at 0.5-1.0 mL/min. Monitor UV (280 nm), light scattering, and RI.
- Data Analysis: Use software (e.g., ASTRA) to calculate absolute molar mass across the elution peak using combined LS and RI signals (dn/dc value required).
Protocol 2: AUC Sedimentation Velocity for Heterogeneity Analysis
- Equipment: Analytical ultracentrifuge, absorbance and/or interference optics.
- Buffer & Sample Preparation: Dialyze sample exhaustively (>24 hours) against reference buffer. Record final dialysate as the reference. Clarify both sample and reference by centrifugation.
- Cell Assembly: Load 400-420 µL of reference and sample into double-sector centerpieces. Use proper optical windows and housing.
- Run Parameters: Set temperature (e.g., 20°C). Use rotor speed appropriate for size range (e.g., 50,000 rpm for proteins). Acquire absorbance (280 nm) or interference scans continuously.
- Data Analysis: Use software (e.g., SEDFIT) to model data with a continuous c(s) distribution model, fitting for frictional ratio (f/f0) and baseline.
Protocol 3: NTA for Aggregate Counting and Sizing
- Instrument Setup: Prime flow cell with filtered buffer. Calibrate camera position with known size standards (e.g., 100 nm polystyrene beads).
- Sample Preparation: Dilute sample in filtered buffer to achieve a concentration within 107-109 particles/mL (critical for accurate counting). Vortex gently before injection.
- Measurement: Inject 0.5-1 mL of diluted sample. Adjust camera and laser settings to optimize particle visibility. Record five 60-second videos.
- Analysis: Software (e.g., NTA 3.4) tracks Brownian motion of individual particles to calculate size and concentration. Ensure detection threshold is set consistently.
Visualizations
Decision Workflow for Orthogonal Technique Selection
Technique Roles in Resolving Protein Heterogeneity
The Scientist's Toolkit: Essential Research Reagents & Materials
| Item | Function in Experiment |
|---|---|
| Size Exclusion Columns (e.g., Superdex, BEH SEC) | Separates protein complexes by hydrodynamic volume prior to MALS detection. |
| ANALTICAL Grade Buffers & Salts (e.g., PBS, Tris, NaCl) | Provides consistent, particle-free mobile phases for SEC-MALS, AUC, and sample dilution. |
| 0.1 µm Syringe Filters (PVDF or cellulose acetate) | Critical for filtering all buffers and samples to remove dust/particulates for light scattering techniques. |
| Dialysis Cassettes (e.g., Slide-A-Lyzer) | Ensures perfect buffer matching between sample and reference for AUC and SEC-MALS. |
| Nanoparticle Size Standards (e.g., polystyrene beads) | Validates and calibrates instrument performance for DLS, NTA, and SEC-MALS. |
| Stabilizing Agents (e.g., Glycerol, Tween-20) | Added to mobile phase or sample to prevent non-specific adsorption and aggregation during separation. |
| Refractive Index Increment (dn/dc) Value | Essential constant for converting MALS and RI signals to absolute molar mass in SEC-MALS. |
Troubleshooting Guides & FAQs
Q1: Our DLS measurement indicates a monomodal, homogeneous sample with a low PDI, but SEC shows a significant aggregate peak. Why is this discrepancy occurring and how can we resolve it?
A: This common issue arises from the differing sensitivity and principle of each technique. DLS measures the intensity of scattered light, which is proportional to the molecular weight squared (∼MW²). Therefore, large aggregates can dominate the signal, masking the presence of smaller species. A small population of large aggregates may not significantly shift the Z-average size or PDI but will be clearly resolved by SEC. Conversely, SEC separates by hydrodynamic volume and is more sensitive to low-abundance, high-MW species.
- Troubleshooting Steps:
- Filter Samples: Prior to both DLS and SEC analysis, always filter your protein sample using a 0.1 µm or 0.22 µm centrifugal filter compatible with your buffer. This removes dust and large, non-protein particulates that skew DLS.
- Analyze SEC Fractions with DLS: Collect fractions across the entire SEC elution profile (pre-peak, main peak, post-peak) and perform DLS on each. This directly correlates size with elution volume.
- Use Complementary Techniques: Employ orthogonal methods like Analytical Ultracentrifugation (AUC) or Native Mass Spectrometry to validate size distributions.
Q2: During SEC optimization, we observe broad or asymmetric peaks suggesting heterogeneity. How do we determine if this is due to aggregation or non-aggregation related heterogeneity (e.g., conformational states)?
A: Distinguishing between these is critical. Broad SEC peaks can indicate polydispersity in size (aggregation) or shape (conformational change).
- Troubleshooting Protocol:
- DLS on In-Line SEC: Utilize an SEC system coupled with multi-angle light scattering (MALS) and DLS detectors. This provides absolute molecular weight and hydrodynamic radius (Rh) at each elution slice. A constant Rh across the peak suggests conformational heterogeneity, while an increasing Rh with earlier elution confirms aggregation.
- Vary SEC Conditions: Run SEC at different ionic strengths (e.g., 0-500 mM NaCl) or add 5% organic solvent (e.g., acetonitrile). If peak broadening changes, it suggests non-covalent, aggregation-mediated heterogeneity. If unchanged, it may indicate stable conformational variants.
- Post-SEC Analysis: Collect the leading shoulder, center, and tailing edge of the broad peak. Re-analyze each by DLS and intrinsic fluorescence spectroscopy. Differences in Trp emission maxima suggest conformational differences.
Q3: How should we interpret a DLS size distribution that shows a broad peak or multiple peaks? What is the optimal experimental protocol for reproducible DLS measurements of heterogeneous proteins?
A: A broad or multimodal intensity distribution indicates a polydisperse sample. Follow this standardized DLS protocol for reliable data.
Experimental Protocol for Reproducible DLS of Heterogeneous Proteins:
- Sample Preparation: Dialyze or desalt protein into a clear, particle-free buffer (e.g., PBS, Tris). Centrifuge at 15,000-20,000 x g for 10 minutes at 4°C to pellet large aggregates.
- Loading: Pipette the supernatant into a clean, low-volume quartz cuvette (e.g., 12 µL). Avoid bubbles.
- Equilibration: Allow the sample to thermally equilibrate in the instrument for 2 minutes.
- Measurement Settings: Perform a minimum of 10-15 sub-measurements (runs) of 10 seconds each. Set the instrument to automatically determine optimal attenuator and measurement position.
- Data Analysis: Always examine both the intensity-size distribution (sensitive to aggregates) and the volume- or number-size distribution (derived mathematically, can underestimate aggregates). Report the Z-average diameter, PDI, and the peaks from the intensity distribution.
Quantitative Data Comparison of DLS and SEC Sensitivity
| Scenario | DLS (Intensity Distribution) | SEC (UV Chromatogram) | Likely Interpretation |
|---|---|---|---|
| Pure Monomer | Single, narrow peak (~Rh expected). PDI < 0.1. | Single, symmetric peak at elution volume consistent with monomer. | Homogeneous sample. |
| Monomer + Trace Large Aggregates | Predominant monomer peak. Z-average may be slightly elevated. PDI may be moderate (0.1-0.3). | Clear, separated low-elution volume aggregate peak. Main monomer peak. | DLS under-reports aggregation level due to intensity weighting. |
| Conformational Mixture | Broad or bimodal peak. PDI > 0.3. | Broad or asymmetric peak. | Sample has populations with different hydrodynamic radii. May not be covalent aggregates. |
| Soluble Oligomers | Distinct peaks corresponding to monomer, dimer, trimer, etc. | Multiple resolved or partially resolved peaks. | Stable oligomeric states. |
The Scientist's Toolkit: Research Reagent Solutions
| Item | Function / Explanation |
|---|---|
| SEC Columns (e.g., Superdex 200 Increase) | High-resolution size exclusion columns for separating biomolecules based on hydrodynamic size. |
| 0.1 µm Anotop/Whatman Syringe Filters | For critical filtration of buffers and samples to remove particulate interference for DLS. |
| DLS Quartz Cuvettes (Low Volume) | High-quality, clean cuvettes minimizing sample volume and background scatter. |
| SEC-MALS-DLS System | Integrated instrumentation providing absolute MW, Rh, and size distribution across the SEC elution profile. |
| Stabilization Buffers (e.g., His-Tag) | Buffers containing mild detergents or specific ligands to prevent non-specific aggregation during analysis. |
| Protein Standards (BSA, Thyroglobulin) | Used for calibrating SEC columns and validating DLS instrument performance. |
Diagram: Workflow for Resolving DLS-SEC Discrepancies
Diagram: DLS vs SEC Signal Weighting Principles
Frequently Asked Questions (FAQs) & Troubleshooting
Q1: During direct infusion Native MS, my signal is unstable or absent. What could be the cause? A: This is commonly due to sample compatibility issues with the MS interface or source conditions.
- Troubleshooting Guide:
- Check Buffer Composition: Ensure volatile buffers (e.g., ammonium acetate) are used at concentrations typically between 50-200 mM. Remove non-volatile salts, detergents, or stabilizing agents via buffer exchange.
- Assess Sample Purity: Contaminants like polymers or small molecules can suppress ionization. Analyze your sample via SDS-PAGE or SEC before MS.
- Optimize Electrospray Conditions: Adjust capillary voltage, source gas flow, and temperature. Reduce voltage to prevent activation and unfolding.
- Verify Sample Concentration: Ideal concentration for Native MS is often 5-20 µM. Too low gives no signal; too high can cause aggregation and spectral complexity.
Q2: My Charge Detection MS (CD-MS) data shows excessive charge noise or poor trapping efficiency. How can I improve this? A: These issues relate to instrument tuning and sample state.
- Troubleshooting Guide:
- Calibrate Trapping Fields: Ensure the electrostatic traps are correctly calibrated for the target m/z range. Refer to the manufacturer's latest protocol for harmonic balance tuning.
- Optimize Ion Loading: Too many ions lead to charge noise; too few give poor statistics. Adjust ion injection time (typically 0.1-10 ms) and concentration.
- Filter Precursor Ions: Use a quadrupole mass filter before the CD-MS trap to select a narrow m/z range, reducing heterogeneity and noise.
- Sample Homogenization: CD-MS is sensitive to particulate matter. Centrifuge samples (e.g., 15,000 x g, 10 min) and filter (0.22 µm) immediately before loading.
Data Acquisition & Interpretation
Q3: The mass spectra for my protein show a broad charge state distribution (CSD), making mass assignment difficult. Is this heterogeneity or an artifact? A: Broad CSDs can indicate conformational heterogeneity (aligned with DLS broad peaks) or suboptimal instrument conditions.
- Troubleshooting Guide:
Q4: In CD-MS, the reconstructed mass histogram has poor resolution. What parameters should I adjust? A: Mass resolution in CD-MS depends on the precision of charge and frequency measurements.
- Troubleshooting Guide:
- Increase Measurement Time: Lengthen the acquisition time per trapped ion (aim for >100 ms). This improves frequency (mass) determination precision.
- Improve Signal-to-Noise (SNR): Ensure ion trajectories are stable. Check trap electrode cleanliness and vacuum integrity (pressure should be <10^-8 mBar).
- Apply Advanced Noise Filtering: Use the instrument's latest software algorithms (e.g., wavelet transforms, Kalman filters) to distinguish signal from noise.
- Validate with Known Standards: Regularly run a protein standard (e.g., aldolase, 157 kDa) to monitor instrument performance.
Experimental Protocols
Protocol 1: Native MS Sample Preparation for Heterogeneity Analysis
Title: Buffer Exchange and Desalting for Native MS. Purpose: To transfer a protein sample from a non-volatile buffer into a volatile MS-compatible buffer while removing small molecule contaminants. Materials: Protein sample, Ammonium acetate solution (200 mM, pH 7.0), Micro Bio-Spin P-6 columns (or similar), Microcentrifuge. Procedure:
- Hydrate the spin column resin according to the manufacturer's instructions with ammonium acetate buffer.
- Centrifuge the column at 1,000 x g for 2 minutes to remove storage solution.
- Apply 50-100 µL of your protein sample (in non-volatile buffer) to the center of the resin bed.
- Centrifuge at 1,000 x g for 4 minutes. The eluate contains your buffer-exchanged protein.
- Measure concentration via UV absorbance. Dilute with ammonium acetate to a final concentration of 10 µM for MS infusion.
Protocol 2: CD-MS Calibration and Data Acquisition
Title: Mass Calibration and Acquisition in CD-MS. Purpose: To calibrate the CD-MS instrument and acquire high-resolution mass/size data for a heterogeneous sample. Materials: Purified protein sample (in volatile buffer), Certified protein mass standard (e.g., thyroglobulin), CD-MS instrument (e.g., modified Orbitrap or dedicated platform). Procedure:
- System Calibration: a. Introduce the mass standard via nano-electrospray. b. Set the electrostatic trap to the recommended potential for the standard's expected m/z. c. Acquire data for 5 minutes. The software will automatically fit the measured oscillation frequencies to known charge states, calibrating the mass scale.
- Sample Analysis: a. Introduce the buffer-exchanged, unknown sample. b. Set the inlet quadrupole to a broad pass window (e.g., 3,000-10,000 m/z) for initial screening. c. For targeted analysis, use a narrow pass window (e.g., ± 500 m/z) centered on a peak of interest. d. Acquire data for a minimum of 15-30 minutes to ensure sufficient single-ion events for statistical analysis.
- Data Processing: Use the instrument's software to compile individual ion measurements (charge, frequency) into a mass histogram. Apply smoothing and peak-fitting algorithms.
The Scientist's Toolkit: Research Reagent Solutions
| Item | Function in Native MS/CD-MS | Example Product/Brand |
|---|---|---|
| Ammonium Acetate (>99.9% purity) | Volatile salt for maintaining native conformation in the gas phase. Essential for buffer exchange. | Sigma-Aldrich, MS-grade |
| Micro Bio-Spin Chromatography Columns | Rapid desalting and buffer exchange of small-volume samples (10-100 µL). | Bio-Rad P-6 Gel |
| NanoESI Emitters | For generating fine, stable droplets in electrospray ionization, improving sensitivity. | Thermo Scientific PicoTip Emitters |
| Protein Mass Standards | For calibrating m/z and mass scales in both Native MS and CD-MS modes. | Thermo Scientific Pierce NativeMark, Aldolase |
| Concentrator (10 kDa MWCO) | For concentrating dilute protein samples post-purification to MS-usable levels (≥5 µM). | Amicon Ultra Centrifugal Filters |
Visualizations
Title: Workflow Linking DLS Broad Peaks to MS Resolution
Title: Charge Detection Mass Spectrometry Process
Troubleshooting Guide & FAQ
Q1: My DLS correlation function is multimodal and decays very quickly, and my CD spectrum shows a low signal-to-noise ratio with a poorly defined minimum. What could be the issue? A: This combination strongly indicates sample contamination with particulate matter or dust. Large, scattering particles dominate the DLS signal, causing a fast decay and misleading polydispersity. These contaminants also scatter light in the UV range, corrupting CD measurements.
- Protocol: Sample Clarification for Combined DLS/CD.
- Prepare all buffers and solutions using high-purity water (e.g., 18.2 MΩ·cm) and filter through a 0.1 µm or 0.22 µm syringe filter (non-protein binding, e.g., PVDF).
- Centrifuge the protein sample at 16,000-20,000 x g for 10-15 minutes at 4°C.
- Carefully extract the top 80% of the supernatant using a pipette, avoiding the pellet.
- For DLS: Load the supernatant directly into a scrupulously clean quartz cuvette or disposable microcuvette. Avoid introducing bubbles.
- For CD: Use the same supernatant in a CD cuvette with an appropriate, short path length (0.1 mm or 1 mm).
Q2: I observe a broad DLS size distribution (high PDI) and my FTIR spectrum in the Amide I region is flat or featureless. What should I check first? A: This suggests inadequate signal or poor sample preparation for FTIR, possibly combined with true sample heterogeneity. A flat Amide I band indicates insufficient protein concentration or path length for the measurement.
- Protocol: Optimizing FTIR-ATR for Protein Conformation.
- Concentration: Aim for a final protein concentration of 10-20 mg/mL for Attenuated Total Reflectance (ATR) mode.
- Buffer Compatibility: Use a deuterated buffer (e.g., D₂O-based phosphate buffer) and equilibrate your protein into it via dialysis or repeated dilution/concentration. This minimizes the strong H₂O absorption band near 1640 cm⁻¹.
- Deposition: Place 20-30 µL of sample on the clean ATR crystal (e.g., diamond).
- Drying (Optional but common): Gently dry the sample under a stream of dry nitrogen or in a vacuum desiccator to remove bulk water and increase signal. Control the drying time to prevent over-denaturation.
- Acquisition: Collect 256-512 scans at a resolution of 4 cm⁻¹. Always subtract a background spectrum of the clean crystal/buffer under identical conditions.
Q3: My CD data suggests a stable secondary structure, but DLS shows large aggregates. How do I reconcile these results? A: This is a classic sign of oligomerization or limited aggregation where the core secondary structure remains intact. CD reports on the average backbone conformation, which may be preserved in structured aggregates. DLS is sensitive to the overall hydrodynamic size increase.
- Protocol: Orthogonal Validation of Oligomeric State.
- Analytical Size-Exclusion Chromatography (SEC): Run the sample on an analytical SEC column (e.g., Superdex 75 or 200) coupled to UV, MALS, and DLS detectors if available. This separates species by size.
- Collect Fractions: Collect the peak corresponding to the putative oligomer/aggregate and the monomer peak.
- Analyze Fractions: Immediately run DLS and CD on the collected fractions. This directly correlates the size from SEC/DLS with the secondary structure from CD for each separated population.
Q4: The thermal melt monitored by CD and DLS shows different transition midpoints (Tm). Which one is correct? A: Both are correct but report on different events. CD typically monitors the loss of secondary structure (unfolding). DLS monitors the increase in hydrodynamic radius, which can be due to aggregation following unfolding.
- Protocol: Correlated Temperature Ramp Experiment.
- Prepare identical aliquots of the same clarified sample.
- CD Protocol: Use a 1 mm path length cuvette. Ramp temperature from 20°C to 90°C at 1°C/min, monitoring ellipticity at 222 nm (for α-helix) or 218 nm (for β-sheet).
- DLS Protocol: Use a temperature-controlled microcuvette. At each 2-5°C increment, allow a 2-minute equilibration, then perform 10 measurements of 10 seconds each. Record the Z-average size and PDI.
- Analysis: Plot both datasets vs. temperature. The CD Tm indicates unfolding onset. The DLS size increase typically occurs at or above the CD Tm, identifying the aggregation temperature (Tagg).
Quantitative Data Summary
Table 1: Diagnostic Signatures from Multi-Technique Troubleshooting
| Observed Problem (DLS) | Observed Problem (CD/FTIR) | Likely Root Cause | Suggested QC Step |
|---|---|---|---|
| Fast decay, multimodal CF | Low CD signal, noisy baseline | Particulate/dust contamination | Buffer filtration; Sample centrifugation |
| High PDI, large Rh | Flat/featureless Amide I band (FTIR) | Low protein conc. for FTIR; Buffer interference | Concentrate sample; Use D₂O buffer for FTIR |
| Large aggregate peak (> 100 nm) | Well-defined α-helical or β-sheet signature | Structured oligomers/aggregates | Use SEC to separate species before analysis |
| Tm (DLS) > Tm (CD) | Cooperative unfolding transition | Aggregation follows unfolding | Perform correlated temperature ramp |
Experimental Workflow Diagram
Title: Workflow for Integrating DLS with CD/FTIR
The Scientist's Toolkit: Key Research Reagent Solutions
| Item | Function in Integrated DLS/CD/FTIR Experiments |
|---|---|
| 0.1 µm PVDF Syringe Filters | Removes sub-micron particulates for dust-free DLS and high-sensitivity CD measurements. |
| Disposable DLS Microcuvettes | Prevents cross-contamination and eliminates cleaning artifacts for reliable size measurements. |
| D₂O-based Buffers (e.g., Phosphate) | Minimizes water absorption in FTIR, allowing clear observation of the Amide I protein conformation band. |
| Short Path Length CD Cuvettes (0.1 mm) | Enables CD measurement of high-concentration samples needed for FTIR, reducing the need for dilution. |
| Analytical SEC Columns (e.g., Superdex series) | Separates monomeric, oligomeric, and aggregated populations for analysis by both DLS and CD. |
| Stable Temperature Controller | Essential for correlated thermal melt studies, ensuring identical conditions for DLS and CD ramps. |
Building a Multi-Attribute Framework for Comprehensive Protein Therapeutic Characterization
Troubleshooting Guides & FAQs
Q1: In our DLS analysis of a monoclonal antibody, we consistently observe broad or multimodal peaks. What are the primary causes and how can we investigate them?
A: Broad or multimodal peaks in Dynamic Light Scattering (DLS) indicate sample heterogeneity. Key causes and investigation steps include:
- Causes: Aggregation (soluble/insoluble), fragmentation, conformational changes, presence of excipients or contaminants, and improper sample preparation (dust, bubbles).
- Investigation Protocol:
- Sample Preparation: Filter the sample through a 0.1 µm or 0.22 µm syringe filter (non-adsorbent, e.g., PVDF) directly into a pristine, dust-free DLS cuvette. Centrifuge at 10,000-15,000 x g for 10 minutes prior to measurement as an alternative.
- Buffer Match: Ensure the dispersion medium (buffer) is perfectly matched for refractive index. Run a blank buffer measurement first.
- Temperature Equilibration: Allow the sample to equilibrate in the instrument for at least 2 minutes to avoid thermal gradients.
- Multi-Method Correlation: Validate findings with orthogonal techniques (see Table 1).
Q2: Our SEC-HPLC data shows a single peak, but DLS indicates polydispersity. Why this discrepancy, and which result should we trust?
A: This is common. SEC-HPLC separates by hydrodynamic radius but may not resolve small oligomers or conformational variants from the monomer if the resolution is low. DLS is more sensitive to large aggregates and provides a direct measure of size distribution. Trust DLS for indicating the presence of heterogeneity, but use SEC-HPLC for quantifying resolved species. Investigate further using SEC-MALS (Multi-Angle Light Scattering) for absolute size determination of eluting species.
Q3: How do we differentiate between reversible self-association and irreversible aggregation using DLS and other techniques?
A: Reversible associations are concentration and condition-dependent, while irreversible aggregates persist.
- Experimental Protocol for Differentiation:
- Perform a DLS concentration series (e.g., from 0.1 mg/mL to 10 mg/mL). Reversible association will show an increase in apparent hydrodynamic radius with concentration. Irreversible aggregates will show a constant proportion of large particles.
- Dilution Test: Dilute a high-concentration sample showing large species and measure immediately by DLS. Reversible species will diminish in signal.
- Stress & Incubation: Subject the sample to a stress (e.g., heat, freeze-thaw, agitation) and monitor size over time via DLS. Irreversible aggregation shows a time-dependent increase in large particles that does not revert upon stress removal.
- Orthogonal Confirmation: Use Analytical Ultracentrifugation (AUC) to directly observe sedimentation boundaries and distinguish reversible from irreversible interactions based on equilibrium and kinetic data.
Q4: What are the critical steps in sample preparation for DLS to avoid artifacts when characterizing protein therapeutics?
A:
- Clarification: Always centrifuge (e.g., 14,000 x g, 10 min, 4°C) or filter (0.1 µm) samples immediately before loading.
- Cuvette Handling: Use only clean, disposable or meticulously cleaned quartz cuvettes. Avoid touching the optical surfaces.
- Debubbling: After loading, tap the cuvette gently to dislodge any air bubbles.
- Concentration: Use an optimal concentration for the instrument (typically 0.1-1 mg/mL for proteins). Too high a concentration can cause multiple scattering.
- Buffer Compatibility: Ensure the buffer does not contain large, scattering particles (e.g., from micronized sugars). Filter all buffers through 0.1 µm filters.
Table 1: Orthogonal Techniques for Investigating DLS-Indicated Heterogeneity
| Technique | Key Measurement | Information Gained | Typical Turnaround Time |
|---|---|---|---|
| SEC-MALS | Absolute MW & Rh of eluting species | Confirms oligomeric state, quantifies resolved aggregates | 30-60 min/sample |
| Analytical Ultracentrifugation (AUC) | Sedimentation coefficient & shape | Detects aggregates, fragments, & reversible associations | 24-48 hrs/run |
| Capillary Electrophoresis-SDS (CE-SDS) | Size-based separation under denaturing conditions | Quantifies fragmentation & aggregation (covalent) | 30-45 min/sample |
| Native Mass Spectrometry | Intact mass under native conditions | Direct mass of complexes, identifies non-covalent adducts | 1-2 hrs/sample |
| Micro-Flow Imaging (MFI) | Particle count & morphology (>1 µm) | Quantifies & images sub-visible particles | 10-15 min/sample |
Table 2: Common DLS Artifacts and Signatures
| Artifact/Symptom | Possible Cause | Diagnostic Check |
|---|---|---|
| Spurious Large Particle Signal | Dust, bubbles, foreign contaminants | Re-filter/centrifuge sample; check buffer blank. |
| Poor Correlation Function Fit | Low concentration, low signal-to-noise | Increase protein concentration if possible. |
| Unstable Size Distribution | Sample settling, temperature gradient | Ensure proper equilibration; gently mix in cuvette. |
| Peak at <1 nm Radius | Solvent/electronic noise, filter artifacts | Compare to buffer; ignore peaks below 1 nm. |
Experimental Protocols
Protocol 1: Basic DLS Measurement for Protein Therapeutic Screening
- Buffer Preparation: Prepare formulation buffer and filter through a 0.1 µm pore size syringe filter.
- Sample Preparation: Dilute protein therapeutic to 0.5 mg/mL in filtered buffer. Centrifuge at 14,000 x g for 10 minutes at 4°C.
- Blank Measurement: Load filtered buffer into a clean quartz cuvette. Perform DLS measurement (minimum 10 runs, 10 seconds each) to establish baseline.
- Sample Measurement: Load supernatant from step 2 into a clean cuvette, avoiding bubbles. Equilibrate at measurement temperature (e.g., 25°C) for 120 seconds.
- Data Acquisition: Perform a minimum of 15 measurement runs. Record intensity-, volume-, and number-based size distributions.
- Data Analysis: Report Z-average size and Polydispersity Index (PdI). Analyze peak positions in the intensity distribution. A PdI > 0.1 suggests significant polydispersity.
Protocol 2: Forced Degradation Study to Probe Aggregation Propensity
- Sample Aliquoting: Prepare 5 aliquots of the protein therapeutic (0.5 mL each at 1 mg/mL).
- Stress Application:
- Thermal: Incubate one aliquot at 40°C for 7 days.
- Freeze-Thaw: Subject one aliquot to 5 cycles of freezing at -80°C and thawing at 25°C.
- Agitation: Agitate one aliquot on a platform shaker at 300 rpm for 24 hours at 25°C.
- Control: Store one aliquot at recommended conditions (e.g., 4°C).
- Analysis: After stress, centrifuge all samples. Analyze by DLS (Protocol 1), SEC-HPLC, and measure sub-visible particles (>1 µm and >10 µm) via MFI or light obscuration.
- Interpretation: Compare size distributions, monomer loss, and particle counts to the control to rank-order stability against different stressors.
Diagrams
DLS Broad Peak Troubleshooting Decision Tree
Multi-Attribute Characterization Framework Workflow
The Scientist's Toolkit: Research Reagent Solutions
| Item | Function in Characterization |
|---|---|
| Nanopure/Dialysis Buffer | Matched dispersion medium for DLS; eliminates scattering from buffer components. |
| 0.1 µm PVDF Syringe Filters | Removes sub-micron particulates and aggregates prior to DLS, SEC, or MFI analysis. |
| Ultra-Clean Quartz Cuvettes | Minimizes scattering background for sensitive DLS measurements. |
| Stable Isotope Labeled Reagents | Enables Hydrogen-Deuterium Exchange Mass Spectrometry (HDX-MS) for conformational analysis. |
| Reference Protein Standards | For calibration of SEC columns and validation of DLS/AUC instrument performance. |
| Stability-Indicating Assay Buffers | Buffers designed to accelerate deamidation, oxidation, or fragmentation for forced degradation studies. |
| Anti-Static Solutions | Reduces static charge on consumables used in sub-visible particle analysis (MFI). |
| High-Purity Detergents/Chaotropes | Used in CE-SDS sample prep to fully denature and linearize proteins for accurate size analysis. |
Conclusion
Effectively troubleshooting broad peaks in DLS is not merely an analytical task but a critical component in the development of safe and efficacious biopharmaceuticals. By first understanding the foundational sources of heterogeneity, implementing rigorous methodological controls, and applying a systematic diagnostic workflow, researchers can transform ambiguous DLS data into actionable insights. Crucially, validation with orthogonal techniques like SEC-MALS or NTA is indispensable for confirming the nature of the species identified. Moving forward, the integration of DLS into a holistic, multi-technique characterization platform will be essential for navigating the complexity of next-generation therapeutics, such as bispecifics, ADCs, and gene therapy vectors, ensuring product quality from early discovery through commercial lifecycle management.