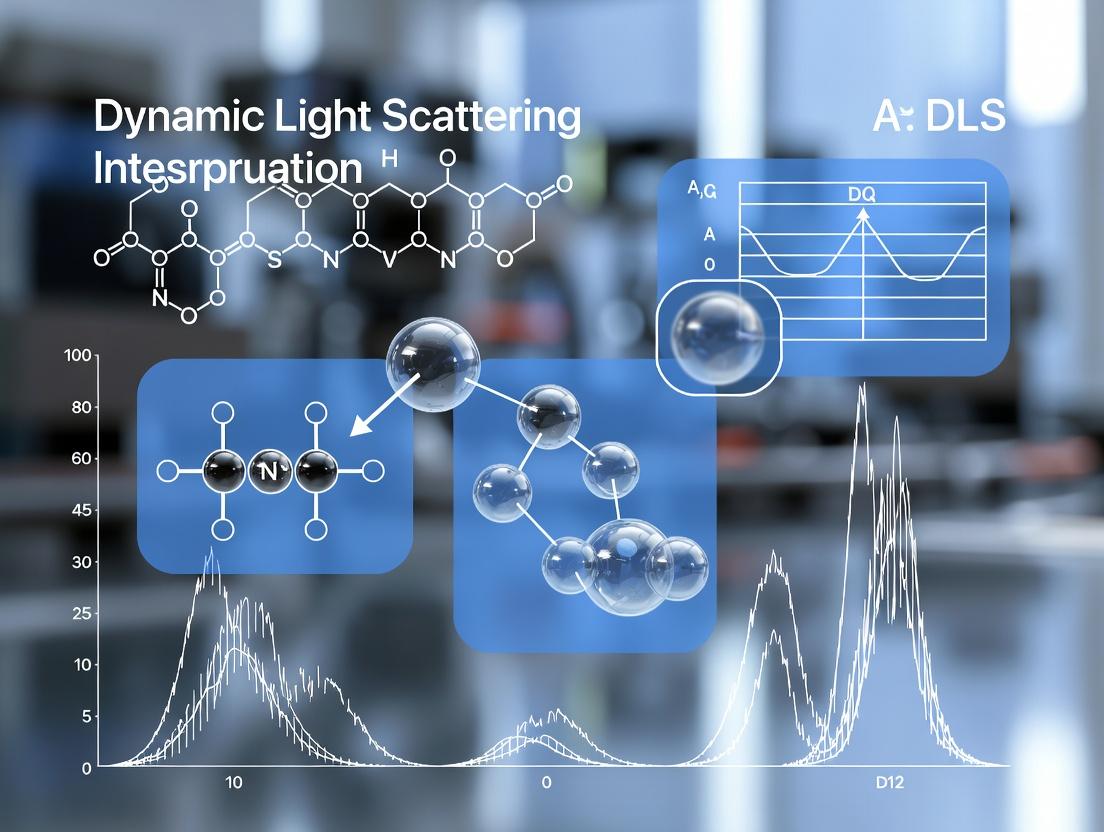
Decoding Multiple Peaks in DLS: From Meaning to Method in Biomolecular Analysis
This comprehensive guide explores the interpretation of multiple peaks in Dynamic Light Scattering (DLS) data, a critical challenge in characterizing nanoparticles, proteins, and complex biologics.
Decoding Multiple Peaks in DLS: From Meaning to Method in Biomolecular Analysis
Abstract
This comprehensive guide explores the interpretation of multiple peaks in Dynamic Light Scattering (DLS) data, a critical challenge in characterizing nanoparticles, proteins, and complex biologics. We delve into the foundational reasons for multimodal distributions, from genuine polydispersity to measurement artifacts. The article provides methodological best practices for sample preparation and data acquisition, systematic troubleshooting workflows to distinguish real signals from artifacts, and validation strategies using complementary techniques like SEC-MALS or NTA. Aimed at researchers and formulation scientists, this resource equips professionals with the knowledge to accurately extract meaningful size distribution data, ensuring robust characterization in drug development and biomedical research.
What Do Multiple DLS Peaks Really Mean? Understanding Size Distributions
Troubleshooting Guides & FAQs
Q1: Why does my DLS correlation function decay very rapidly, giving a size distribution that is too small (e.g., < 1 nm)? A: This is typically caused by signal saturation or "afterpulsing" from the detector. If the scattered light intensity is too high, the photodetector's electronics can produce artificial, short-time-lag correlations. This masquerades as very fast diffusion.
- Troubleshooting Protocol:
- Attenuate the laser power or use a neutral density filter.
- Dilute your sample significantly.
- Verify detector settings are not in a "high gain" or saturated mode.
- Run a clean solvent blank to check for electronic artifacts.
Q2: My DLS data shows multiple peaks. How can I determine if they represent true populations or are artifacts of dust/aggregates? A: True multiple peaks can indicate a polydisperse sample or specific oligomeric states, a key focus in drug development for protein therapeutics. Artifacts from large aggregates or dust are typically characterized by: * Extreme non-reproducibility between measurements. * Very high intensity proportion for the large size peak. * Disappearance after ultra-filtration or centrifugation. * Validation Protocol: 1. Filter the sample through a 0.02 µm or 0.1 µm syringe filter (compatible with sample). 2. Centrifuge at high speed (e.g., 15,000 x g for 10 minutes) and carefully pipette from the top. 3. Measure the sample 3-5 times consecutively. True populations will be reproducible. 4. Compare the intensity-weighted distribution (more sensitive to large particles) with the volume- or number-weighted distribution (derived mathematically). A persistent large particle peak in the volume-weighted view suggests a true sub-population.
Q3: The polydispersity index (PdI) is high (>0.2), making the size distribution report unreliable. How can I improve sample quality for DLS? A: A high PdI indicates a broad or multimodal distribution. For meaningful size distribution analysis, sample preparation is critical.
- Sample Preparation Protocol:
- Buffer Exchange: Use size-exclusion chromatography or dialysis into a clean, particle-free buffer matched for ionic strength and pH to your application.
- Filtration: Always filter buffers through a 0.1 µm filter. Filter samples with a compatible 0.02 µm filter if aggregates are not of interest.
- Cleanliness: Scrupulously clean the cuvette with filtered solvent and use lint-free wipes.
- Concentration Optimization: Test a range of concentrations. Too high a concentration can cause intermolecular interactions (attractive or repulsive) that distort diffusion coefficients.
Q4: How does the software algorithm (e.g., NNLS, CONTIN) influence the reported size distribution from the same correlation data? A: The correlation decay curve is mathematically inverted to a size distribution. Different algorithms make different assumptions, impacting resolution and artifact susceptibility.
- NNLS (Non-Negative Least Squares): Assumes a discrete set of sizes. Can be sensitive to noise, sometimes producing "spiky" distributions.
- CONTIN: Assumes a smooth, continuous distribution. More robust to noise but may smooth over closely spaced populations.
Table 1: Comparison of DLS Inversion Algorithms
| Algorithm | Key Assumption | Advantage | Limitation | Best For |
|---|---|---|---|---|
| NNLS | Discrete size bins | High resolution for distinct populations | Can produce artificial spikes; sensitive to noise | Samples with known, discrete sizes (e.g., monomers/dimers). |
| CONTIN | Smooth distribution | Robust to experimental noise; stable | May oversmooth and merge adjacent peaks | Broad or continuous polydisperse samples. |
Experimental Context: DLS Data Interpretation & Multiple Peaks Research
Within a thesis on DLS data interpretation, understanding multiple peaks is paramount. The correlation function g²(τ) is a collective average of all scattering particles. A multi-exponential decay implies multiple diffusion coefficients. The core challenge is the ill-posed mathematical inversion. Research focuses on using a priori knowledge (e.g., expected size ranges from other techniques) to constrain algorithms, and developing novel fitting routines to deconvolve oligomeric states critical for protein drug stability and efficacy.
The Scientist's Toolkit: Research Reagent Solutions
Table 2: Essential Materials for Robust DLS Analysis
| Item | Function & Rationale |
|---|---|
| Anopore or Glass Fiber Syringe Filters (0.02 µm) | Gold standard for final sample filtration. Removes sub-micron aggregates and dust with minimal sample adsorption. |
| Particle-Free Buffer Vials | Dedicated, low-binding vials for storing filtered buffer to prevent reintroduction of contaminants. |
| Disposable Micro Cuvettes (UVette-type) | Eliminates cross-contamination and cuvette cleaning variability. Essential for high-throughput screening. |
| NIST-Traceable Latex Nanosphere Standards (e.g., 60 nm, 100 nm) | Validates instrument performance, alignment, and algorithm accuracy before critical sample runs. |
| Stable Protein Control (e.g., BSA at 5 mg/mL) | A daily system suitability test. Confirms the instrument and protocol yield the expected, known size and PdI. |
DLS Workflow & Data Interpretation Pathways
Title: DLS Data Analysis & Research Workflow
Title: From Correlation Decay to Peak Interpretation
FAQs & Troubleshooting Guide
Q1: In my DLS measurement, the intensity-size distribution shows two distinct peaks. Does this definitively mean I have two particle populations? A: Not definitively. While multiple peaks often suggest multiple populations, they can also be artifacts. You must cross-verify with volume or number distributions. A small number of large aggregates can dominate the intensity signal, creating a secondary peak that is less significant in the volume view.
Q2: The main peak in my intensity plot is very broad. What does this indicate, and how can I improve the measurement? A: A broad peak indicates a high polydispersity index (PdI), meaning your sample has a wide size distribution or is not monodisperse. To improve:
- Filter your samples using a 0.02 µm or 0.1 µm syringe filter (compatible with your solvent).
- Ensure the sample is dust-free.
- Optimize concentration – if too high, multiple scattering occurs; if too low, signal is poor.
- Increase measurement duration/time to improve signal-to-noise ratio.
Q3: How do I correctly interpret the relative height of peaks between intensity, volume, and number distributions? A: The intensity distribution is weighted by the sixth power of the diameter. A tiny population of large particles can appear as a major peak. Always consult the volume and number distributions for a more accurate picture of mass and population count. See the comparative table below.
Q4: My sample is a known monoclonal antibody, but I see a small peak/“shoulder” at larger sizes. What is this likely to be? A: In the context of drug development, this is highly likely to represent aggregates. Even a small percentage of aggregates is critical to monitor for stability and immunogenicity. Further characterization with SEC-MALS or AF4 is recommended.
Q5: What does a peak at very small sizes (<1 nm) typically signify? A: This is often an artifact from solvent signals, dust, or electrical noise (known as the "dust peak"). It can sometimes represent very small particles or remnants of buffer salts. Check against a clean buffer baseline measurement.
Key Data Interpretation Tables
Table 1: Comparison of DLS Size Distribution Weightings
| Distribution Type | Weighting Factor | What It Emphasizes | Best for Identifying |
|---|---|---|---|
| Intensity | Diameter^6 | Large particles in the mix | Aggregates, large contaminants |
| Volume | Diameter^3 | Mass of material | Main formulation component |
| Number | Unweighted | Number of particles | Predominant population count |
Table 2: Common DLS Peak Artifacts vs. Real Populations
| Peak Characteristic | Possible Artifact | Possible Real Population | Troubleshooting Action |
|---|---|---|---|
| Very sharp, tiny <1nm | Solvent/buffer noise, dust | Small molecules, salts | Subtract solvent baseline |
| Broad main peak (>20% PdI) | Poor sample prep, dust | Polydisperse sample | Filter sample, check concentration |
| Small secondary large peak | Few dust particles, bubble | Low-level aggregates | Ultra-filtration, multiple measurements |
| Shifting peak positions | Temperature instability, degradation | Sample aggregation/ unfolding | Control temperature, measure over time |
Experimental Protocols
Protocol 1: Routine DLS Sample Preparation for Protein Solutions
Objective: To obtain a reliable, dust-free DLS measurement of a protein or biologic formulation. Materials: Protein sample, appropriate buffer, 0.02 µm or 0.1 µm syringe filters (ANOTOP preferred for low adsorption), clean glass vials/cuvettes. Method:
- Buffer Filtration: Filter the buffer through a 0.02 µm filter into a clean container.
- Sample Preparation: Dilute the protein sample into the filtered buffer to the target concentration (typically 0.1-1 mg/mL for antibodies).
- Sample Filtration: Filter the diluted protein sample directly into the DLS cuvette using a 0.02 µm or 0.1 µm syringe filter.
- Capping: Seal the cuvette with a cap to prevent evaporation and dust entry.
- Equilibration: Place the cuvette in the instrument and allow it to thermally equilibrate for 2-5 minutes before measurement.
- Measurement: Perform a minimum of 10-15 sub-runs. Validate with at least three independent measurements.
Protocol 2: Confirming Aggregates via Sequential Filtration
Objective: To confirm if a secondary peak in the intensity-size plot is due to aggregates. Materials: Sample, DLS instrument, 0.1 µm syringe filter, 100 kDa or 300 kDa molecular weight cutoff (MWCO) centrifugal filters. Method:
- Measure the initial, unfiltered sample by DLS, recording the intensity distribution.
- Gently pass the sample through a 0.1 µm filter and measure immediately.
- If the large peak diminishes, it suggests large, filterable aggregates/particles.
- For a more stringent test, centrifuge a portion of the sample using a 100 kDa MWCO filter (following manufacturer protocols for protein recovery).
- Measure the filtrate (monomer-enriched) and the retentate (aggregate-enriched) separately.
- Compare the intensity plots. A genuine aggregate population will be depleted in the filtrate and enriched in the retentate.
Visualizing DLS Data Interpretation Workflow
Title: DLS Multimodal Peak Troubleshooting Decision Tree
The Scientist's Toolkit: Research Reagent Solutions
| Item | Typical Example/Supplier | Function in DLS Experiments |
|---|---|---|
| ANOTOP Syringe Filters | Whatman ANOTOP 25, 0.02 µm | Gold standard for ultraclean filtration. Inert aluminum oxide membrane minimizes protein adsorption and particle shedding. |
| Disposable Size Exclusion Cassettes | Malvern Zetasizer Ultra CAPCELL | Pre-filled, disposable cuvette and filter unit. Ensures consistency and eliminates cross-contamination for high-throughput screening. |
| Nanoparticle Size Standards | NIST-traceable polystyrene beads (e.g., 60 nm, 100 nm) | Used to validate instrument performance, alignment, and ensure accuracy of reported hydrodynamic diameters. |
| Low-Volume Quartz Cuvettes | Hellma 105.251-QS (12 µL) | Essential for measuring precious or low-concentration samples. Provides superior clarity and reduces sample requirement. |
| In-line Degasser | Malvern Degasser, online systems | Removes microscopic bubbles from solvents/buffers, which are a major source of spurious large particles in DLS measurements. |
| Stable Reference Protein | NISTmAb (RM 8671) | A well-characterized monoclonal antibody used as a system suitability standard to benchmark performance for biologic formulations. |
Troubleshooting Guide & FAQs
Q1: I see two distinct peaks in my DLS intensity distribution. Does this always indicate a problem? A1: Not necessarily. While a single, monodisperse peak is often the goal, genuine multiple peaks can be biologically or formulation-driven. Key causes are: 1) True sample polydispersity (e.g., a mixture of monomers and stable oligomers), 2) Formulated products (e.g., protein + excipient, or a co-formulation of two different nanoparticles), and 3) Stable, non-covalent aggregates. The critical step is to correlate DLS data with an orthogonal method (e.g., SEC-MALS, analytical ultracentrifugation) to confirm peak identity.
Q2: How can I distinguish between an artifact (dust, bubbles) and a genuine secondary population like an oligomer? A2: Genuine secondary peaks are typically reproducible across sample preparations, scale with concentration, and have a reasonable polydispersity index (PdI) for their size regime. Artifacts are often sporadic, appear at very large sizes (>1000 nm), or have extreme intensity weighting. Filter your sample (0.1 µm or 0.22 µm) and measure at multiple concentrations. A genuine oligomer peak will persist.
Q3: My drug product is a co-formulation of two different-sized liposomes. How should I interpret the DLS data? A3: You will observe a multimodal distribution. The intensity-weighted distribution heavily emphasizes larger particles. For co-formulations, you must use the volume-weighted or number-weighted distribution (from Mie theory correction or deconvolution) to accurately assess the proportion of each population. Relying solely on the intensity plot will misrepresent the abundance of smaller particles.
Q4: What experimental protocol can confirm that a small peak is a stable dimer or oligomer? A4: Use a combination approach:
- DLS Measurement: Perform at multiple angles (e.g., 90° and 173°) and concentrations to confirm size consistency.
- Size-Exclusion Chromatography with Multi-Angle Light Scattering (SEC-MALS): This is the gold standard. The oligomer will elute as a separate peak with a confirmed molar mass approximately 2x (or Nx) that of the monomer.
- Analytical Ultracentrifugation (AUC): Sedimentation velocity experiments can directly resolve and quantify monomer/oligomer equilibrium based on sedimentation coefficients.
Q5: Are there standard thresholds for the "percentage" of a secondary peak to be considered significant? A5: Significance is context-dependent. For aggregates in biotherapeutics, guidelines often focus on sub-visible particles. However, for characterization, any reproducible population above ~1-2% in volume or number distribution may warrant investigation. The table below summarizes general interpretive guidelines.
| Peak Size Ratio (Peak2/Peak1) | Likely Cause | Typical % Intensity Threshold for Concern (Therapeutics) | Recommended Orthogonal Assay |
|---|---|---|---|
| 1.5 - 4x | Oligomers (Dimers, Trimers, etc.) | Varies by function; >10% may alter activity. | SEC-MALS, AUC, Native MS |
| >5x, but <100x | Large, Soluble Aggregates | >1% for sub-visible particles. | MFI, RMM, AUC |
| >100x | Sub-visible Particles / Micron-range | Per regulatory guidelines (e.g., USP <788>). | Microflow Imaging (MFI), Light Obscuration |
| Unrelated sizes (e.g., 5 nm & 100 nm) | Co-Formulation | N/A - Intentional mixture. | TEM, NTA, DSC |
Experimental Protocol: Distinguishing Aggregates from Oligomers via SEC-MALS
Objective: To separate, size, and determine the absolute molar mass of species in a sample showing multiple DLS peaks.
Materials:
- HPLC system with UV detector
- SEC column (e.g., TSKgel G3000SWxl, Superdex 200 Increase)
- Multi-angle light scattering (MALS) detector
- Refractive index (RI) detector
- Mobile phase: Appropriate buffer (e.g., PBS, 0.1M Na2SO4) filtered through 0.1 µm membrane
- Sample: Centrifuged or filtered (0.22 µm) at recommended concentration.
Method:
- System Equilibration: Flush the SEC-MALS system with filtered mobile phase at the recommended flow rate (e.g., 0.5 mL/min) until a stable baseline is achieved on all detectors (UV, MALS, RI).
- Normalization & Calibration: Perform normalization of the MALS detector angles using a monodisperse protein standard (e.g., Bovine Serum Albumin) of known molar mass and dn/dc.
- Sample Injection: Inject 50-100 µL of sample. Ensure sample concentration is within the ideal detector response ranges (consult manufacturer guidelines).
- Data Collection: Collect data from all detectors simultaneously.
- Analysis: Use dedicated software (e.g., Astra, Chromatic) to analyze the data. The software will combine UV/RI elution profiles with light scattering data to calculate the absolute molar mass across the entire chromatogram, independent of elution time. A peak eluting before the monomer with a molar mass of ~2x confirms a dimer.
The Scientist's Toolkit: Key Research Reagent Solutions
| Item | Function in Analysis |
|---|---|
| SEC-MALS System | Provides absolute molar mass and size (Rg) for separated species in solution, critical for identifying oligomeric states. |
| Analytical Ultracentrifuge (AUC) | Measures sedimentation coefficients to resolve mixtures and characterize equilibrium constants for self-associating systems. |
| Nanoparticle Tracking Analysis (NTA) | Provides particle-by-particle size and concentration, offering a number-weighted distribution to complement DLS intensity data. |
| Stable Reference Materials (e.g., NIST Traceable Latex Beads) | Essential for daily validation and performance qualification of DLS and other light scattering instruments. |
| Ultra-low Protein Binding Filters (0.1 µm) | For reliable sample clarification to remove dust artifacts without significantly adsorbing the protein/nanoparticle of interest. |
| Interactive Modelling Software (e.g., SEDFIT, ASTRA) | Enables advanced data deconvolution and modeling for complex mixtures and interactions. |
Workflow & Relationship Diagrams
Title: Decision Workflow for Interpreting Multiple DLS Peaks
Title: SEC-MALS Workflow for Oligomer Confirmation
Troubleshooting Guides & FAQs for DLS Data Interpretation
Q1: My DLS software reports a single, sharp intensity peak, but the Number and Volume Distributions show multiple populations. Which result should I trust, and what does this discrepancy indicate?
A: Trust the Number and Volume Distributions for a more accurate representation of particle populations. This discrepancy is a classic example of why intensity-weighted results alone are insufficient. The intensity distribution is weighted by the sixth power of the diameter (from the Rayleigh approximation, I ∝ d⁶). A small number of large aggregates or particles can dominate the signal, masking a majority population of smaller particles. The Number distribution recalculates the data to show the proportion of particles by count, revealing the true polydispersity.
Key Diagnostic Table:
| Distribution Type | Weighting | Reveals | Common Discrepancy |
|---|---|---|---|
| Intensity | Signal (∝ d⁶) | Hydrodynamic size of scatterers | Single peak, can hide small populations. |
| Volume/Mass | Derived from Intensity | Mass/Volume of particles per size class | Can reveal aggregates if they comprise significant volume. |
| Number | Derived from Volume | Estimated number of particles per size class | Most accurate for primary population; reveals true polydispersity. |
Experimental Protocol for Verification:
- Sample Preparation: Filter all buffers (0.02 µm) and consider filtering sample through a 0.1 µm or 0.22 µm syringe filter (if compatible) to remove dust.
- DLS Measurement: Perform minimum 3-10 measurements at a fixed, appropriate angle (e.g., 173° for backscatter).
- Data Analysis: Always view all three distributions (Intensity, Volume, Number). A clean, monodisperse sample will show a single peak in all distributions.
- Corroborative Technique: Use Field-Flow Fractionation (FFF) coupled to MALS/DLS or Transmission Electron Microscopy (TEM) to visually validate the presence of multiple size populations suggested by the Number distribution.
Q2: When analyzing a protein therapeutic, my Number distribution shows a small peak at <1 nm and a main peak at 5 nm. Is this real or an artifact?
A: This is a common artifact. The sub-nanometer peak in the Number distribution often corresponds to residual signal from solvent ions, small molecules, or instrument noise, which is amplified during the conversion to a Number distribution. The Intensity distribution likely shows only the 5 nm peak, confirming the protein is the primary scatterer.
Troubleshooting Steps:
- Baseline Subtraction: Ensure a clean solvent baseline is measured and properly subtracted from the sample correlation function.
- Check Sample Buffer: Dialyze or desalt the protein into the exact measurement buffer to minimize scattering contrast differences.
- Threshold Setting: Consult your instrument software. Many algorithms apply a lower size threshold; data below this threshold should be disregarded.
- Assess Count Rate: A very low count rate (kcps) suggests the main signal is weak, making noise more prominent. Concentrate the sample if possible.
Diagnostic Table: Artifact vs. Real Small Population
| Feature | Likely Artifact (Noise/Solvent) | Real Small Particle Population |
|---|---|---|
| Intensity Distribution | No corresponding peak. | Visible, small peak or shoulder. |
| Volume Distribution | No corresponding peak. | Visible, discernible peak. |
| Peak Position | Often fixed at instrument's lower limit (e.g., 0.5 nm). | Varies slightly between preparations. |
| Sample Concentration | More prominent in dilute samples. | Peak area scales with concentration. |
Q3: My Volume distribution shows a significant "tail" or secondary peak in the micron range, but the Intensity peak PDI is still < 0.3. Is my sample acceptable for drug product release?
A: No, this sample may have a critical quality issue. A PDI < 0.3 from the Intensity distribution suggests a monodisperse population only for the dominant scatterers. A tail in the Volume distribution indicates the presence of large-diameter, low-abundance aggregates that contribute significant product mass. In drug development, these sub-visible particles are critical and require monitoring.
Protocol for Quantifying Sub-visible Particles:
- DLS Refinement: Increase measurement duration and replicates to improve signal-to-noise for detecting weak, large-particle signals.
- Use Complementary Techniques:
- Dynamic Imaging Analysis (Microflow Imaging) or Nanoparticle Tracking Analysis (NTA): For direct counting and sizing of particles > 100 nm.
- Resonant Mass Measurement (Archimedes): For high-resolution mass measurement of individual particles.
- Filtration Test: Pass the sample through a 0.1 µm filter. Re-measure with DLS. If the Volume distribution tail disappears, it confirms the presence of filterable aggregates.
The Scientist's Toolkit: Key Research Reagent Solutions
| Item | Function | Critical Note |
|---|---|---|
| ANION EXCHANGE COLUMNS | Purification and removal of aggregates. | Effective for separating species based on surface charge; can resolve aggregates not seen in Intensity DLS. |
| SIZE-EXCLUSION CHROMATOGRAPHY (SEC) COLUMNS | High-resolution size-based separation. | Couple directly to DLS (SEC-DLS) for fractionated analysis; gold standard for resolving multiple peaks. |
| ULTRA-LOW PROTEIN BINDING FILTERS (0.02 µm & 0.1 µm) | Solvent and sample clarification. | Essential for removing dust/particulates that create false signals in Number distributions. |
| CERTIFIED NANOPARTICLE SIZE STANDARDS (e.g., 60 nm Au, 100 nm PS) | Instrument performance qualification. | Verifies accuracy of all three distribution reports before critical experiments. |
| STABLE, MONODISPERSE PROTEIN CONTROL (e.g., BSA, IgG1) | Method and sample handling control. | Ensures observed multiple peaks are sample-specific, not procedural artifacts. |
DLS Multi-Peak Analysis & Corroboration Workflow
Pathway for Interpreting Multiple Peaks in DLS Data
FAQs
Q1: What does a Polydispersity Index (PDI) value tell me about my DLS sample? A: The PDI is a dimensionless measure of the broadness of the size distribution derived from the cumulants analysis in DLS. It ranges from 0 (perfectly monodisperse) to 1.0 (very polydisperse). A PDI < 0.05 indicates a highly monodisperse sample. A PDI between 0.05 and 0.7 suggests a moderately polydisperse sample, while a PDI > 0.7 indicates a very broad size distribution, for which the cumulants analysis may be less reliable.
Q2: How is the PDI mathematically related to the number of peaks in a size distribution plot? A: The PDI itself does not directly indicate the number of peaks. It is a measure of distribution width. A high PDI (>0.7) suggests a polydisperse system which could contain multiple populations, but they may be unresolved. The specific number and position of peaks are determined by applying an inversion algorithm (e.g., CONTIN, NNLS) to the autocorrelation function. A sample with two distinct, well-separated size populations will typically yield a high PDI, but a single, very broad peak can also produce a high PDI.
Q3: I have a sample with a single peak in the intensity distribution but a PDI of 0.3. Is this contradictory? A: No. This is common. A single, somewhat broad peak (indicating a range of sizes) will result in a PDI > 0.05. The PDI quantifies that breadth. A single, perfectly sharp peak is rare in practice. Your data indicates a monomodal but polydisperse distribution.
Q4: My DLS software shows three peaks. Which one should I report, and how does this relate to PDI? A: Report all peaks by their relative intensity percentage and explain their potential origin. The intensity-weighted distribution is most sensitive to larger particles. Always review the volume- or number-weighted distributions for context. A multi-peak result will inherently have a high PDI. The relationship is summarized below.
| PDI Range | Typical Interpretation | Likely Peak Number (Intensity Distribution) | Common Cause in Drug Development |
|---|---|---|---|
| < 0.05 | Highly monodisperse | One sharp peak | Well-formulated mAbs, uniform liposomes. |
| 0.05 – 0.3 | Moderately polydisperse | One broad peak, or a main peak with a very minor shoulder. | Acceptable batch of nanoparticles, some aggregation present. |
| 0.3 – 0.7 | Polydisperse | Often two or more distinct peaks. | Significant aggregation, mixed populations (e.g., API crystals + excipients). |
| > 0.7 | Very polydisperse | Multiple peaks or a very broad, unreliable distribution. | Severe aggregation, contamination, or complex mixtures. |
Q5: During stability studies, my PDI increased from 0.1 to 0.5, but the peak number is still one. What does this mean? A: This indicates the onset of size heterogeneity within your primary population. While distinct secondary peaks have not yet formed, the main population is broadening, often an early sign of degradation, swelling, or initial aggregation. It is a critical early-warning parameter in formulation studies.
Troubleshooting Guides
Issue: High PDI (>0.7) with an Uninterpretable Multi-Peak Distribution.
- Potential Causes:
- Dust or Contaminants: Large, scattering particles dominate the signal.
- Poor Sample Preparation: Inadequate filtration, presence of bubbles.
- Sample Concentration is Too High: Multiple scattering effects distort data.
- Genuine Sample Heterogeneity: Severe aggregation or complex mixture.
- Step-by-Step Protocol to Diagnose:
- Clean & Filter: Thoroughly clean the cuvette with filtered solvent. Pass the sample through a compatible, low-protein-binding syringe filter (e.g., 0.22 µm or 0.1 µm).
- Dilute the Sample: Perform a dilution series (e.g., 1:2, 1:5, 1:10) using filtered buffer. Measure each dilution.
- Analyze Trends: If the PDI and erratic peaks disappear upon dilution/filtration, the cause was likely concentration or contaminants. If multiple peaks persist in a consistent ratio, they likely represent real populations.
Issue: Discrepancy Between PDI and Observed Peak Structure.
- Symptom: Software reports a low PDI (~0.08) but the distribution plot shows a small secondary peak.
- Diagnosis: The secondary peak contains very few particles. Because PDI is weighted by intensity, a tiny population of large particles can appear as a significant peak in the intensity plot but contribute minimally to the PDI. Always consult the volume- or number-weighted distribution.
- Protocol for Verification:
- Record the intensity-, volume-, and number-weighted distributions.
- In the analysis software, adjust the sensitivity or regularization settings for the inversion algorithm within reasonable limits.
- If the small peak is present across different analysis settings and weighting types, it is a real but minor component.
The Scientist's Toolkit: DLS Sample Preparation & Analysis
| Item | Function & Rationale |
|---|---|
| Syringe Filter (0.1 or 0.22 µm) | Removes dust and large contaminants that cause spurious scattering. Critical for accurate PDI. Use low-protein-binding (e.g., PES) for biologics. |
| Ultra-Pure, Filtered Solvent/Buffer | The diluent must be particle-free. Filter buffer through 0.1 µm filter before use. |
| Low-Volume, Disposable Cuvettes | Minimizes cleaning issues and sample volume required. Ensure they are compatible with your instrument (glass vs. disposable plastic). |
| Pipettes & Clean Tips | For accurate sample handling and dilution. Use filtered tips to prevent aerosol contamination. |
| Ultrasonic Bath or Homogenizer | For gentle resuspension of particle samples to break up loose, reversible aggregates before measurement, ensuring a representative state. |
| DLS Instrument Calibration Standard (e.g., 100 nm PS beads) | A monodisperse standard (PDI < 0.05) used to verify instrument performance and alignment regularly. |
Experimental Protocol: Systematic DLS Measurement for PDI and Peak Analysis
Objective: Obtain reproducible intensity-weighted size distribution and PDI data for a colloidal formulation.
Materials: See "The Scientist's Toolkit" above.
Procedure:
- Buffer Preparation: Prepare the required aqueous buffer and filter it through a 0.1 µm filter into a clean, particle-free container.
- Sample Preparation: If the sample is a powder, disperse it in filtered buffer. For liquid samples, dilute to the appropriate concentration (consult literature; typically 0.1-1 mg/mL for proteins) using filtered buffer.
- Clarification: Draw the diluted sample into a syringe and pass it through a compatible 0.22 µm (or 0.1 µm) syringe filter directly into a clean DLS cuvette. Avoid introducing bubbles.
- Equilibration: Place the cuvette in the instrument chamber and allow temperature equilibration for 2-5 minutes (or per instrument manual).
- Measurement Setup: Set measurement angle (typically 173° for backscatter), temperature, and number of runs (≥ 3 runs per measurement).
- Data Acquisition: Perform the measurement. Validate data by ensuring the autocorrelation function is smooth and decays to baseline.
- Cumulants Analysis: Record the Z-average size and PDI from the cumulants fit.
- Distribution Analysis: Apply the inversion algorithm (e.g., CONTIN) to obtain the intensity-weighted size distribution. Note the number and position of peaks.
- Repeat & Report: Perform at least three independent measurements from the same sample preparation. Report Z-average (with PDI) and the intensity-weighted distribution profile, including peak positions and relative intensities.
Diagrams
Title: Relationship Between DLS Data, PDI, and Peak Analysis
Title: Troubleshooting Guide for High PDI and Multiple Peaks
Best Practices for Reliable Multi-Peak DLS Analysis in the Lab
Technical Support Center: Troubleshooting & FAQs for DLS Sample Prep
This support center addresses common issues encountered during sample preparation for Dynamic Light Scattering (DLS) analysis, a critical step for ensuring accurate interpretation of particle size distributions and the meaning of multiple peaks in your thesis research.
FAQ 1: Why does my DLS measurement show multiple peaks after sample filtration? Q: I filtered my protein formulation through a 0.22 µm syringe filter, but the DLS data now shows an additional peak near 0.1 µm that wasn't present before. What happened? A: This is a common artifact. The new peak likely represents sub-micron particles shed from the filter membrane itself. Many cellulose-based or low-protein-binding filters can release stabilizing agents or fragments. For biological samples, use filters explicitly rated as "low extractable" or "non-fiber releasing," such as PES or PVDF membranes. Always pre-rinse the filter with your buffer (discard the first 1-2 mL) to minimize this contamination. This spurious peak can be misinterpreted as a real population in your DLS data.
FAQ 2: How do I choose between centrifugation and filtration for clarifying a complex biological fluid? Q: I am preparing serum samples for exosome analysis. Should I use centrifugation or filtration to remove large debris before DLS? A: The choice is critical and depends on your target analyte. For exosomes (typically 30-150 nm), a sequential centrifugation protocol is mandatory. Filtration risks capturing or damaging your vesicles on the membrane. Experimental Protocol: Differential Centrifugation for Serum Exosome Isolation
- Centrifuge fresh serum at 2,000 × g for 30 minutes at 4°C to remove cells and large debris. Transfer supernatant carefully.
- Centrifuge the supernatant at 10,000 × g for 45 minutes at 4°C to remove larger vesicles and particles.
- Filter the supernatant through a 0.22 µm PES syringe filter (pre-rinsed) to sterilize.
- Ultracentrifugate the filtrate at 110,000 × g for 70 minutes at 4°C to pellet exosomes.
- Resuspend the pellet gently in a filtered PBS buffer. Filtration alone would remove your target analytes.
FAQ 3: My sample concentration step is causing aggregation. How can I avoid this? Q: I concentrated my monoclonal antibody using a centrifugal concentrator (100 kDa MWCO). The post-concentration DLS shows a large increase in hydrodynamic radius and a new high-intensity peak indicating aggregates. How do I prevent this? A: Aggregation during concentration is often due to increased protein-protein interactions at the membrane interface. Implement these steps:
- Use the Correct Membrane: Ensure the Molecular Weight Cut-Off (MWCO) is at least 3-5x smaller than your protein's molecular weight.
- Optimize Conditions: Conduct concentration at 4°C in a formulation buffer with stabilizing excipients (e.g., histidine, sucrose).
- Avoid Over-Concentration: Do not concentrate to dryness. Periodically mix the retentate gently during the process to avoid a high-concentration polarization layer.
- Post-Concentration Analysis: Always perform a post-concentration buffer exchange or dilution into your final formulation buffer and re-measure with DLS.
FAQ 4: What are the quantitative guidelines for selecting filter pore size? Q: Is there a rule of thumb for selecting a filter pore size based on my expected particle size from DLS? A: Yes. The filter pore size should be at least 5-10 times larger than the largest expected hydrodynamic radius (Rh) of your primary particle population to avoid sieving or shear-induced aggregation. See table below.
Table 1: Filter Pore Size Selection Based on Target DLS Population
| Primary DLS Peak (Hydrodynamic Diameter) | Recommended Minimum Filter Pore Size | Rationale |
|---|---|---|
| < 10 nm (Proteins, small peptides) | 0.1 µm (100 nm) | Provides >10x margin, minimizes adsorption losses. |
| 10 - 50 nm (Viruses, some exosomes) | 0.22 µm (220 nm) | Standard for sterilization; sufficient margin. |
| 50 - 100 nm (Liposomes, larger exosomes) | 0.45 µm (450 nm) | Prevents size exclusion of the upper range. |
| > 100 nm (Polymer nanoparticles, aggregates) | 0.8 µm or larger | Prevents capture of target analytes; use for clarification only. |
Table 2: Centrifugation Parameters for Common Sample Types
| Sample Type | Goal | Speed & Time (g-force × minutes) | Expected Pellet / Supernatant Use |
|---|---|---|---|
| Bacterial Culture | Remove cells | 4,000 × g for 20 min | Supernatant for secreted protein DLS. |
| Mammalian Cell Lysate | Remove debris | 12,000 × g for 15 min | Supernatant for protein aggregate analysis. |
| Lipid Nanoparticles | Remove large aggregates | 20,000 × g for 30 min | Supernatant contains monodisperse population. |
| Gold Nanoparticles | Purify by size | Gradient centrifugation | Specific band extracted for monodisperse DLS standard. |
Workflow Diagrams
Decision Workflow for DLS Sample Prep
Diagnosing Multiple Peaks from Prep Artifacts
The Scientist's Toolkit: Research Reagent Solutions
Table 3: Essential Materials for DLS-Optimized Sample Preparation
| Item | Function & Key Consideration for DLS |
|---|---|
| Low-Extractable PES Syringe Filters (0.1, 0.22 µm) | Primary clarification. PES membranes minimize particle shedding, reducing false peaks in the 50-200 nm range. |
| Amicon Ultra Centrifugal Filters (Appropriate MWCO) | Concentrate proteins/viruses. Choose MWCO 3x smaller than target to prevent pass-through and minimize polarization. |
| Polycarbonate Ultracentrifuge Tubes | For high-speed spins. Highly resistant to deformation, preventing tube collapse and sample loss at >100,000 × g. |
| Filtered, Particle-Free Buffer | Diluent & formulation. MUST be filtered through 0.1 µm membrane to eliminate dust particles that dominate scattering signal. |
| Nanoparticle Size Standards (e.g., 60 nm Au) | Quality control. Run standard after sample prep to validate that the protocol/filter did not introduce size bias. |
| Low-Protein-Bind Microcentrifuge Tubes | Sample handling. Prevents adsorption of precious analytes to tube walls, preserving true concentration for DLS. |
| Benchtop Micro-Centrifuge (refrigerated) | Quick spins. For pelletizing debris post-incubation or quick collection of samples from tube lids/liquid handling. |
Troubleshooting Guides & FAQs
FAQ 1: Why are my DLS measurements showing a single, broad peak when I expect multiple populations? This often indicates insufficient instrumental resolution. Verify your settings:
- Run Duration: Too short a duration results in poor statistics and an autocorrelation function that is not well-defined. For polydisperse or low-concentration samples, increase the number of sub-runs and duration per measurement.
- Measurement Angle: A single angle (typically 90° or 173° backscatter) may not resolve populations with similar hydrodynamic radii. Consider implementing multi-angle DLS (MADLS) if your instrument supports it.
- Temperature Control: Inadequate temperature equilibration (less than 2 minutes) or fluctuations (>0.1°C) can cause diffusion coefficient variability, smearing peaks. Ensure the sample chamber has reached a stable setpoint.
FAQ 2: How do I optimize run duration to distinguish two closely spaced peaks (e.g., monomer vs. dimer)? A longer run duration improves the signal-to-noise ratio of the autocorrelation function, enabling better resolution. Follow this protocol:
- Start with a standard duration (e.g., 10 runs of 10 seconds each).
- If the intensity distribution shows a single broad peak, systematically increase the total measurement time.
- Use the "quality factor" or "fit error" metric provided by your software. Continue increasing duration until this metric stabilizes at a low value.
- Caution: Excessive duration can lead to sample settling or degradation. Always check sample stability first.
FAQ 3: What is the impact of measurement angle on resolving power in my multiple peaks research? The scattering vector (q) is angle-dependent: q = (4πn/λ) sin(θ/2), where n is refractive index, λ is laser wavelength, and θ is the scattering angle. Lower angles (e.g., 15°-45°) are more sensitive to larger aggregates, while high-angle backscatter (173°) is optimal for small particles and avoids multiple scattering. To resolve a broader size range, data from multiple angles must be combined using specialized algorithms (MADLS).
FAQ 4: My sample is temperature-sensitive. How do I control for temperature-induced aggregation during a long measurement? Temperature is a critical parameter for both sample stability and data accuracy (via solvent viscosity).
- Pre-Equilibration: Always equilibrate your sample in the instrument's cuvette chamber for at least 5 minutes before measurement.
- Validation Protocol: Perform a temperature ramp experiment (e.g., 20°C to 40°C in 5°C increments, 10 min equilibration per step). Plot hydrodynamic radius (Rh) vs. Temperature. A sharp increase indicates a critical aggregation temperature. Set your operational temperature at least 5°C below this point.
- Use a Peltier Controller: Ensure your instrument has an active, stable Peltier temperature control system (±0.1°C).
Data Presentation
Table 1: Optimized Instrument Settings for Resolving Common Peak Pairs
| Target Population (Example) | Recommended Angle | Recommended Run Duration (Minimum) | Critical Temperature Control | Notes |
|---|---|---|---|---|
| Monomer vs. Small Oligomer (5 nm vs. 8 nm) | 173° (Backscatter) | 20 x 15 seconds | ±0.1°C at 25°C | High angle maximizes signal from small particles. |
| Protein vs. Large Aggregate (10 nm vs. 200 nm) | 90° & 30° (MADLS) | 15 x 20 seconds per angle | ±0.2°C at 20°C | Multi-angle is essential. Check for sedimentation at low angles. |
| Liposome Mixture (50 nm vs. 120 nm) | 90° | 10 x 20 seconds | ±0.3°C at 37°C | Longer runs improve precision for broader distributions. |
| Fragile Biologic at Low Concentration | 173° (Backscatter) | 30 x 30 seconds | ±0.1°C at 4°C | Extended duration compensates for low scattering intensity. Keep sample cold. |
Table 2: Effect of Run Duration on Peak Resolution Metrics
| Total Measurement Time (s) | Polydispersity Index (PdI) | Peak 1 Radius (nm) | Peak 2 Radius (nm) | % Intensity Peak 1 | Fit Error (χ²) |
|---|---|---|---|---|---|
| 100 | 0.25 | 9.1 | (Not Resolved) | 100 | 8.5 |
| 200 | 0.22 | 8.9 | 14.5 | 85 : 15 | 5.2 |
| 300 | 0.21 | 9.0 | 14.8 | 82 : 18 | 2.1 |
| 600 | 0.20 | 9.0 | 15.0 | 80 : 20 | 1.8 |
Experimental Protocols
Protocol A: Multi-Angle DLS (MADLS) for Enhanced Resolution Purpose: To resolve multiple populations by combining intensity data from several scattering angles. Materials: DLS instrument with multi-angle capability, temperature-controlled cuvette, filtered buffer, clarified sample. Method:
- Filter all buffers through a 0.02 µm filter. Clarify sample via centrifugation (e.g., 10,000 g, 10 min).
- Load sample into a clean, particle-free cuvette. Insert into the instrument pre-equilibrated to desired temperature.
- Set acquisition parameters: Perform sequential measurements at (at least) three angles (e.g., 30°, 90°, 150°). Use the run duration guidelines from Table 1.
- Process data using the instrument's MADLS algorithm, which inverts combined data to a single size distribution.
- Report the number-weighted distribution for quantitative population analysis.
Protocol B: Temperature Stability Assessment for DLS Purpose: To determine the optimal temperature for measuring a thermally sensitive sample without inducing aggregation. Materials: DLS instrument with precise Peltier control, sample. Method:
- Set initial instrument temperature to 10°C below the suspected storage/stability temperature.
- Equilibrate sample for 10 minutes.
- Perform a measurement (using optimized duration/angle).
- Increase temperature by a fixed increment (2-5°C).
- Repeat steps 2-4 until a clear, irreversible increase in Rh or PdI is observed.
- Plot Rh and PdI vs. Temperature. The optimal measurement temperature is in the stable plateau region.
Visualizations
DLS Peak Resolution Settings Workflow
Multi-Angle DLS Data Acquisition Path
The Scientist's Toolkit: Research Reagent Solutions
| Item | Function in DLS Peak Resolution Experiments |
|---|---|
| Nanoparticle-Free Cuvettes | Disposable or quartz cuvettes specifically cleaned to eliminate dust, which creates spurious large-particle signals and obscures small peaks. |
| 0.02 µm Anotop Syringe Filters | For final filtration of buffers to remove particulate background. A smaller pore size than standard 0.22 µm filters is critical for small protein studies. |
| Size Standard Reference Material (e.g., 100 nm NIST-traceable latex) | Validates instrument performance, alignment, and resolution capability before critical experiments. |
| Viscosity Standard (e.g., Sucrose Solution) | Used to verify accurate temperature control by measuring the known viscosity-temperature relationship via the diffusion of a standard. |
| Stable, Monodisperse Protein Control | (e.g., Bovine Serum Albumin). A known sample to troubleshoot procedure and confirm that multiple peaks are sample-related, not artefactual. |
| Ultra-Pure Water (HPLC Grade) | For dilutions and final rinsing of cuvettes to prevent contamination from tap water minerals or organics. |
Frequently Asked Questions & Troubleshooting Guides
Q1: During the DLS measurement, my correlation function decays very rapidly and appears noisy. What could be the cause? A: This is often indicative of large, scattering particles (e.g., dust or aggregates) or insufficient sample preparation. Ensure thorough filtration (e.g., using a 0.02 µm or 0.1 µm syringe filter for aqueous samples) and centrifugation to remove dust. Verify that the sample concentration is within the instrument's optimal range—too high a concentration causes multiple scattering.
Q2: My cumulants analysis returns a high polydispersity index (PdI). Can I still trust the reported Z-Average size? A: A PdI > 0.7 indicates a very broad distribution, and the Z-Average (the intensity-weighted mean hydrodynamic size) becomes less representative. It is a warning that the sample is highly polydispersed. Proceed to distribution fitting algorithms (like NNLS or CONTIN) with caution, as they may provide more insight, but the result should be interpreted as a size distribution profile rather than precise populations.
Q3: When fitting for a size distribution, my software shows multiple peaks. How do I determine if they are real populations or artifacts? A: First, validate with the following steps:
- Repeatability: Perform at least 3-5 consecutive measurements. Real peaks will reproduce in position and relative amplitude.
- Sample Treatment: Gently centrifuge or filter the sample. If a large-particle peak disappears, it was likely dust or a fragile aggregate.
- Angle/Concentration Dependence: Measure at two different scattering angles (e.g., 90° and 173°). Real particle populations will show consistent distributions, while artifacts may shift.
- Consult the Residuals Plot: A good fit has randomly distributed residuals. Structured patterns indicate a poor fit or an inappropriate model.
Q4: In the context of my thesis on "DLS Data Interpretation Multiple Peaks Meaning," how should I report a bimodal distribution observed in a protein drug formulation? A: Report the following systematically:
- Cumulants Result: State the Z-Average and PdI as an initial summary.
- Distribution Result: Present the peak positions (in nm) and their relative intensity-based percentage (e.g., Peak 1: 8 nm, 95%; Peak 2: 80 nm, 5%).
- Contextual Interpretation: Relate peaks to known components: "The dominant peak at 8 nm corresponds to the monomeric protein (expected ~7 nm). The minor peak at 80 nm suggests the presence of sub-micron aggregates, comprising approximately 5% of the scattering intensity."
- Note Limitations: Clarify that DLS is sensitive to larger particles, so the 5% intensity likely corresponds to a much smaller number fraction of aggregates.
Q5: The CONTIN regularization algorithm gives a different distribution shape every time I run it on the same data. How do I stabilize the analysis? A: This highlights a key limitation of inversion algorithms. To improve reliability:
- Use high-quality, low-noise correlation function data (ensure the baseline is properly fitted).
- Increase the number of scans averaged during measurement.
- In the software, apply a sensible constraint on the "smoothness" or regularization parameter. An excessively low value leads to fitting noise (over-fitting), while too high a value oversmoothes genuine features.
- Always compare the fitted correlation function (from the distribution result) back to the measured data to assess fit quality.
Table 1: Interpretation of Polydispersity Index (PdI) from Cumulants Analysis
| PdI Range | Interpretation | Suitability for Distribution Fitting |
|---|---|---|
| 0.00 - 0.05 | Nearly monodisperse, highly uniform sample. | Excellent. Results will be robust. |
| 0.05 - 0.08 | Moderately narrow distribution. | Very good. |
| 0.08 - 0.7 | Broad distribution. | Possible, but interpret with care. Use multiple algorithms. |
| > 0.7 | Very broad distribution. | Poor. Results are highly model-dependent. Sample preparation should be revisited. |
Table 2: Troubleshooting Common DLS Artifacts vs. Real Peaks
| Observation | Possible Artifact Cause | Diagnostic Experiment | Indication of Real Population |
|---|---|---|---|
| Very large peak (>1000 nm) | Dust, air bubbles, foreign contamination. | Filter/centrifuge sample. | Peak persists after gentle preparation. |
| Unreproducible peak positions | Insufficient measurement duration, low count rate. | Increase measurement time; check sample clarity. | Peaks are reproducible across replicates. |
| Peak near 1 nm or below | Solvent impurities, Raman bands, electronic noise. | Measure pure, filtered solvent as background. | Peak is above solvent background signal. |
| Sharp peak at instrument's lower limit | Coherent interference (optical crosstalk). | Ensure cuvette is clean, not scratched; adjust alignment. | Not applicable. |
Experimental Protocols
Protocol 1: Reliable DLS Sample Preparation for Protein Solutions
- Filtration: Use a syringe filter with a pore size compatible with your protein (typically 0.1 µm hydrophilic PVDF for most proteins, 0.02 µm for smaller proteins/peptides). Filter the buffer first, then prepare the protein solution in the filtered buffer.
- Centrifugation: Aliquot the prepared sample into a microcentrifuge tube. Centrifuge at 10,000 - 15,000 x g for 10-15 minutes at the experiment's temperature to pellet any large aggregates.
- Loading: Carefully pipette the top 80% of the supernatant into a clean, dust-free DLS cuvette. Avoid pipetting from the bottom of the tube.
- Cuvette Handling: Hold the cuvette by the frosted sides only. Cap the cuvette to prevent evaporation and dust entry.
Protocol 2: Validating a Multi-Peak Distribution (NNLS/CONTIN)
- Data Acquisition: Measure the same sample consecutively for a minimum of 5 runs.
- Primary Analysis: Perform the cumulants analysis on each run. Record Z-Average and PdI. High variability (>10% in Z-Avg) suggests instability.
- Distribution Analysis: Apply the distribution algorithm (e.g., CONTIN) with a consistent set of parameters (e.g., regularization, size range) to all runs.
- Peak Tracking: For each run, note the mean size and relative intensity of all discernible peaks.
- Validation Criterion: A real population will appear in all runs with a variation in mean position of <5% and a variation in relative intensity of <20%.
Workflow & Pathway Visualizations
Title: DLS Data Analysis Decision Workflow
Title: Thesis Hypothesis Testing for Multiple Peaks
The Scientist's Toolkit: Research Reagent Solutions
Table 3: Essential Materials for Robust DLS Experiments
| Item | Function & Importance |
|---|---|
| Syringe Filters (0.02 µm & 0.1 µm) | Critical for removing dust and nanoscale contaminants from buffers and samples. Different pore sizes accommodate different protein sizes. |
| Ultra-Pure, Filtered Water | Prevents false signals from particulate matter or ions in solvents. Use for cleaning and buffer preparation. |
| Low-Volume, Disposable DLS Cuvettes | Minimizes sample volume required and eliminates the risk of carryover contamination between samples. |
| Particle Size Standards (e.g., 100 nm Latex) | Used for routine instrument validation and performance qualification (PQ) to ensure accuracy. |
| Stable, Monodisperse Protein Standard (e.g., BSA) | Provides a control to check the entire sample preparation and measurement workflow for biological samples. |
| High-Speed Microcentrifuge | Essential for pelleting aggregates formed during sample handling or storage prior to DLS analysis. |
| Non-Interacting Surfactant (e.g., PS-80) | Used at low concentrations (e.g., 0.01%) in formulations to prevent protein adsorption to cuvette walls. |
Technical Support Center: Troubleshooting DLS Data Interpretation for mAb Characterization
FAQs and Troubleshooting Guides
Q1: My DLS instrument reports multiple peaks in the size distribution profile for my monoclonal antibody sample. What could these peaks represent? A: In the context of mAb analysis, multiple peaks typically indicate a polydisperse sample. The primary peak is often the intact monomer. Secondary, smaller-sized peaks (~25-50% of monomer size) usually represent fragments (e.g., Fab, Fc). Larger-sized peaks (2x-100x the monomer size or more) typically represent aggregates (dimers, oligomers, or sub-visible particles). Contaminants from buffers or cell culture media can also appear as separate peaks. Always correlate with orthogonal methods like SEC-MALS or SV-AUC.
Q2: How do I distinguish between an actual aggregate/fragment peak and an artifact from dust or bubbles in my DLS measurement? A: Artifacts like dust often appear as very large, irregular spikes (>1000 nm) and have disproportionately high scattering intensity. Bubbles cause massive intensity fluctuations. To troubleshoot:
- Filter all buffers and samples through a 0.02 µm or 0.1 µm syringe filter directly before measurement.
- Centrifuge the sample vial briefly to remove bubbles.
- Run multiple consecutive measurements (5-10). Artifacts are inconsistent, while true aggregate/fragment peaks are reproducible.
- Check the correlation function. A clean, smooth decay indicates a good measurement; sharp dips or noise suggest contaminants.
Q3: The polydispersity index (PdI) for my mAb formulation is above 0.7, suggesting broad size distribution. How should I proceed with data interpretation? A: A PdI > 0.7 indicates a very polydisperse sample unsuitable for detailed peak analysis via the cumulants method (which assumes a Gaussian distribution). Proceed as follows:
- Use NNLS or CONTIN algorithms provided by your software to visualize the multi-modal distribution.
- Focus on intensity-weighted distributions for identifying large aggregates (they scatter light more intensely).
- Switch to volume-weighted or number-weighted distributions to estimate the relative population of fragments, which are less visible in intensity plots.
- Consider sample dilution if concentration is above 5-10 mg/mL to minimize intermolecular interactions.
Q4: I am observing batch-to-batch variability in the aggregate peak size and percentage. What are the key experimental parameters to control? A: Variability often stems from sample handling and instrument settings. Standardize this protocol:
| Parameter | Recommended Setting | Rationale |
|---|---|---|
| Equilibration Time | 120-180 seconds | Ensures thermal homogeneity in the cuvette. |
| Measurement Temperature | 25°C ± 0.1°C | Controlled to prevent temperature-induced aggregation. |
| Number of Runs | 10-15 per measurement | Averages out minor fluctuations. |
| Cell Type | Disposable quartz/size-specific | Minimizes cross-contamination and ensures correct light path. |
| Angle of Detection | 173° (backscatter) | Minimizes multiple scattering for concentrated samples. |
Q5: How can I validate that a small peak at ~2-3 nm is a fragment and not a buffer component? A: Perform a buffer subtraction and use a differential approach.
- Measure your formulation buffer under identical settings.
- Subtract the buffer's intensity distribution from the sample's intensity distribution using your instrument software.
- Dialyze the mAb sample into a simple, characterized buffer (e.g., PBS) and re-measure. If the small peak persists, it is likely a fragment.
- Confirm via CE-SDS or reducing SDS-PAGE.
Table 1: Representative DLS Data Interpretation for a Stressed mAb Sample
| Peak # | Mean Size (d.nm) | % Intensity | Likely Identity | Notes for Thesis Context |
|---|---|---|---|---|
| 1 | 3.2 ± 0.5 | 2% | Buffer component / small fragment | In intensity plots, minor populations <5% may be statistically insignificant. Correlate with number distribution. |
| 2 | 10.5 ± 1.2 | 93% | Monomeric mAb | This is the dominant, functional species. PdI of this peak alone should be <0.08. |
| 3 | 22.1 ± 3.0 | 3% | Dimer / small oligomer | Represents reversible self-association or covalent dimer. Check reversibility with dilution. |
| 4 | 320.0 ± 80.0 | 2% | Large soluble aggregate | Although low in % intensity, this represents a critical quality attribute for drug safety. |
Table 2: Key Research Reagent Solutions for mAb Aggregation/Fragmentation Studies
| Reagent / Material | Function in Experiment | Critical Note |
|---|---|---|
| Disposable Quartz Cuvettes | Holds sample for DLS measurement. | Eliminates cleaning artifacts and cross-contamination between runs. |
| 0.02 µm Anotop Syringe Filter | Filters sample immediately before loading. | Removes dust and large contaminants; use low protein-binding material. |
| PBS, 0.1 µm Filtered | Standard dilution/dialysis buffer. | Provides a clean, low-scattering background for measurement. |
| NIST Traceable Size Standard (e.g., 60 nm polystyrene) | Validates instrument performance and alignment. | Run weekly to ensure accuracy of reported hydrodynamic radii. |
| Stressed mAb Control (e.g., heat-stressed at 45°C for 48 hrs) | Positive control for aggregation. | Provides a reference multi-peak profile for method development. |
Experimental Protocols
Protocol 1: Standardized DLS Measurement for mAb Monomer/Aggregate/Fragment Analysis
- Sample Preparation: Thaw or dilute mAb sample in filtered formulation buffer to a target concentration of 1-2 mg/mL. Centrifuge at 10,000 rpm for 5 minutes to pellet any large, insoluble aggregates.
- Filtration: Using a syringe, gently pass ~0.5 mL of supernatant through a 0.02 µm inorganic membrane filter into a clean vial.
- Loading: Pipette 50 µL of filtered sample into a clean, disposable quartz cuvette. Seal with a cap to prevent evaporation.
- Instrument Setup: Place cuvette in the instrument equilibrated at 25°C. Set equilibration time to 120 seconds.
- Data Acquisition: Perform 15 consecutive measurements of 10 seconds each. Set the detector angle to backscatter (173°).
- Analysis: Analyze the correlation function using both the cumulants method (for PdI and Z-average) and the NNLS algorithm (for multi-peak distribution). Export intensity-, volume-, and number-weighted distributions.
Protocol 2: Stress Test to Induce Aggregates and Fragments (for Control Sample Creation)
- Thermal Stress: Aliquot 200 µL of mAb at 5 mg/mL into a low-protein-binding microcentrifuge tube. Place in a thermal block at 45°C for 48-72 hours.
- Mechanical Stress: Agitate a separate aliquot on a platform shaker at 400 rpm for 24 hours at room temperature.
- Analysis: Post-stress, centrifuge samples briefly. Analyze by DLS (as per Protocol 1) and by SEC-UV to compare aggregate/fragment percentages between techniques.
Visualizations
Title: DLS Data Analysis Workflow for mAb Samples
Title: Interpreting Multiple Peaks in mAb DLS Profiles
DLS Troubleshooting Guide & FAQs
Q1: My DLS measurement of LNPs shows multiple peaks. What do these mean? A: Multiple peaks indicate a polydisperse sample. The primary peak typically represents the main population of intact LNPs. A secondary, smaller-sized peak (< 10 nm) often corresponds to empty micelles or free nucleic acid. A secondary, larger-sized peak may indicate aggregation or the presence of a small population of doublets/aggregates. Interpretation must be contextualized within your formulation parameters.
Q2: How do I distinguish between an aggregate peak and a genuine bimodal distribution of two distinct LNP populations? A: Perform a stability assessment. Measure the sample over time (0, 1, 4, 24 hours) at 4°C. Aggregate peaks will typically grow in intensity relative to the main peak. Genuine bimodality from two distinct populations (e.g., from a mixed formulation) will remain stable. Further analysis with a complementary technique like NTA or TEM is required for confirmation.
Q3: The polydispersity index (PdI) of my LNP batch is high (>0.2). What are the most likely causes during formulation? A: High PdI often stems from process inconsistency. Key causes include:
- Inconsistent mixing during the aqueous and ethanol phase combination (turbulent vs. laminar flow).
- Unoptimized flow rate ratio (FRR) in microfluidic devices.
- Improper temperature control during formulation and dialysis.
- Inadequate filtration or extrusion post-formulation.
Q4: My DLS size is significantly different from my TEM/NTA size. Which one is correct? A: Both are correct but measure different physical properties. DLS measures the hydrodynamic diameter (DH), which includes the core particle and the solvation shell. TEM measures the dry, core diameter. NTA tracks Brownian motion to give a particle-by-particle size distribution. DLS is intensity-weighted and can be skewed by large aggregates, while NTA is particle number-weighted. Consistent sample preparation and understanding the weighting of each technique are crucial.
Q5: What is the recommended sample preparation protocol for DLS measurement of LNPs to avoid artifacts? A:
- Dilution: Dilute the LNP stock in the exact final buffer (e.g., 1x PBS, pH 7.4) used for storage/dialysis. Avoid water.
- Dilution Factor: Aim for a count rate within the instrument's optimal sensitivity range (typically 200-500 kcps for most systems). This often requires a 50x to 200x dilution.
- Filtration: Filter the diluent buffer through a 0.22 µm or 0.1 µm syringe filter before diluting the LNPs. Do not filter the LNP sample itself.
- Equilibration: Allow the diluted sample in the cuvette to equilibrate to the measurement temperature (typically 25°C) for 2-3 minutes.
- Multiple Measurements: Perform a minimum of 3-12 sequential runs per sample. Use the number-weighted or volume-weighted distribution for multimodal analysis.
Experimental Protocol: DLS Measurement for LNP Characterization
Objective: To determine the hydrodynamic diameter, polydispersity index (PdI), and size distribution of LNP formulations via Dynamic Light Scattering.
Materials:
- LNP sample
- Appropriate buffer (e.g., filtered 1x PBS)
- Disposable cuvettes (low volume, polystyrene)
- 0.22 µm syringe filter
- Micropipettes and tips
- DLS instrument (e.g., Malvern Zetasizer, Brookhaven NanoBrook)
Procedure:
- Buffer Preparation: Filter 10-20 mL of the measurement buffer through a 0.22 µm syringe filter into a clean vial to remove dust.
- Sample Dilution: Using filtered buffer, dilute the LNP stock suspension to achieve a final concentration suitable for DLS. A starting point is a 1:100 (v/v) dilution. Mix gently by inversion.
- Load Cuvette: Transfer the diluted sample into a clean, dust-free cuvette, avoiding bubbles. Cap the cuvette.
- Instrument Setup: Turn on the DLS instrument and software. Set the measurement parameters:
- Temperature: 25.0 °C
- Equilibration time: 120 seconds
- Measurement angle: 173° (Backscatter, NIBS default)
- Number of runs: Minimum 3, aim for 11
- Run duration: Automatic
- Measurement: Insert the cuvette, start the measurement sequence.
- Data Analysis: Use the instrument software to analyze the correlation function. Report the Z-average diameter (intensity-weighted mean), the Polydispersity Index (PdI), and the size distribution by intensity. For multimodal distributions, analyze the peak positions and their relative intensity percentages.
Table 1: Common DLS Artifacts and Their Signatures in LNP Analysis
| Artifact | Typical Peak Location | Relative Intensity | Cause | Corrective Action |
|---|---|---|---|---|
| Dust Contamination | Highly variable, often >1000 nm | Low, but can skew | Unfiltered buffer or dirty cuvette | Filter all buffers, use clean labware |
| Free siRNA/mRNA | 2-8 nm | Low to Medium | Encapsulation inefficiency | Optimize lipid:nucleic acid ratio, purification step |
| Empty Lipid Micelles | 8-15 nm | Medium | Formulation process | Tune flow rate ratio (FRR) & lipid composition |
| Particle Aggregates | 1.5-3x Main Peak Size | Can be High | Instability, buffer mismatch | Check colloidal stability, optimize buffer/pH |
Table 2: Comparison of Sizing Techniques for LNPs
| Technique | Measured Property | Size Range | Sample Prep | Key Advantage | Key Limitation |
|---|---|---|---|---|---|
| DLS | Hydrodynamic Diameter (DH) | 0.3 nm - 10 µm | Minimal, dilution | Fast, high-throughput, measures PdI | Intensity-weighted, biased towards large particles |
| NTA | Brownian Motion (Projected area) | 10 nm - 2 µm | Moderate dilution | Visual counting, concentration estimate | Lower throughput, user-dependent analysis |
| TEM | Core Dry Diameter | 1 nm - No upper limit | Complex, staining required | High resolution, visual morphology | Artifacts from drying, no hydrodynamic data |
Diagrams
Diagram 1: DLS Data Interpretation Workflow for LNPs
Diagram 2: LNP Formulation & Characterization Pathway
The Scientist's Toolkit: Key Research Reagent Solutions
Table 3: Essential Materials for LNP Formulation & DLS Characterization
| Item | Function & Relevance | Example Product/Category |
|---|---|---|
| Ionizable Cationic Lipid | Key structural/functional lipid for nucleic acid encapsulation and endosomal escape. | DLin-MC3-DMA, SM-102, ALC-0315 |
| Helper Lipids (Phospholipid) | Provides structural integrity and bilayer stability to the LNP. | DSPC, DOPE |
| Cholesterol | Modulates membrane fluidity and stability, enhances in vivo efficacy. | Pharmaceutical grade (>99%) |
| PEGylated Lipid | Steric stabilization, reduces aggregation, modulates pharmacokinetics. | DMG-PEG2000, ALC-0159 |
| Nucleic Acid Payload | The therapeutic agent (e.g., siRNA, mRNA) to be encapsulated. | siRNA (target specific), mRNA (e.g., encoding antigens) |
| Microfluidic Device | Enables precise, reproducible mixing for nanoprecipitation and LNP formation. | Precision glass chips, staggered herringbone mixer (SHM) designs |
| Tangential Flow Filtration (TFF) System | Purifies and concentrates LNPs, exchanges buffer, removes ethanol and free nucleic acid. | Cassette-based systems with appropriate MWCO membranes (e.g., 100 kDa) |
| DLS/Zetasizer Instrument | Measures hydrodynamic size, PdI, and size distribution of nanoparticles in solution. | Malvern Panalytical Zetasizer Pro/Ultra, Brookhaven NanoBrook Omni |
| Nano-Syringe Filters (0.1/0.22 µm) | Critical for filtering buffers to eliminate dust particles that interfere with DLS measurements. | PVDF or cellulose acetate membrane filters. |
| Low-Volume Disposable Cuvettes | Sample holders for DLS measurement, minimize sample volume and reduce cleaning artifacts. | Brand-specific (e.g., ZEN0040 for Malvern). |
Is It Real or an Artifact? Troubleshooting Spurious DLS Peaks
Troubleshooting Guide: Identifying and Mitigating False Peaks in DLS Data
Q1: Why does my DLS correlation function or size distribution histogram show a small, unexpected peak around 1-10 µm?
Answer: This is a classic signature of dust or large, particulate contaminants in your sample. In the context of multi-peak analysis, these false peaks can be misinterpreted as a legitimate polydisperse population or aggregate species. Dust particles scatter light intensely and can dominate the correlation function, leading to a false reading. They are the most frequent cause of spurious peaks, especially in the micron size range.
Q2: How can I conclusively determine if a peak is from my sample or from contamination?
Answer: Follow this diagnostic protocol:
- Filter the Solvent: Pass your buffer or solvent through a 0.02 µm or 0.1 µm syringe filter (e.g., Anotop filter) into a cleaned cuvette. Measure it as a "blank." Any remaining peak is instrument noise or an unclean cuvette.
- Filter the Sample: Gently filter your sample through a syringe filter with a pore size larger than your expected particle size (e.g., use a 0.45 µm filter for a 200 nm sample). Critical: Compare the "before" and "after" distributions quantitatively.
Table 1: Impact of 0.45 µm Filtration on a Hypothetical Protein Formulation DLS Measurement
| Sample Condition | Peak 1 (nm) | % Intensity | Peak 2 (nm) | % Intensity | PDI | Conclusion |
|---|---|---|---|---|---|---|
| Unfiltered | 10.2 ± 1.5 | 95.2% | 2,850 ± 450 | 4.8% | 0.25 | Bimodal distribution suggests aggregation. |
| Post 0.45 µm Filtration | 9.8 ± 1.2 | 100% | Not Detected | 0% | 0.12 | Peak 2 was dust/contaminant. Sample is monodisperse. |
Q3: What is the correct sample preparation protocol to avoid dust artifacts in critical DLS experiments for drug development?
Answer: Implement this stringent, multi-step protocol for reliable data:
- Cuvette Cleaning: Immerse the cuvette in a 2% Hellmanex III solution for 20 minutes. Rinse thoroughly with ≥18.2 MΩ·cm filtered water 10+ times. Finally, rinse 3 times with filtered buffer. Dry in a particle-free environment (laminar flow hood).
- Solvent/Buffer Preparation: Always prepare buffers using filtered, ultrapure water. Filter the final buffer through a 0.02 µm or 0.1 µm filter directly into the cleaned cuvette.
- Sample Handling: Centrifuge protein/viral vector/mRNA-LNP samples at 10,000-15,000 x g for 10-15 minutes to pellet any large aggregates or debris. Carefully pipette the top 80% of the supernatant for measurement.
- Sample Loading: In a laminar flow hood, pipette the pre-cleared sample into the cuvette, avoiding contact with the cuvette walls. Cap immediately.
Q4: Beyond dust, what other contaminants cause false peaks, and how do they differ?
Answer: While dust is primary, other contaminants create distinct signatures:
Table 2: Common Contaminant Types and Their DLS Signatures
| Contaminant Type | Typical Size Range | Common Source | Distinguishing Feature from True Sample |
|---|---|---|---|
| Air Bubbles | 1 µm - 100+ µm | Vortexing, vigorous pipetting | Highly unstable, peaks shift dramatically between measurements. |
| Protein Aggregates | 100 nm - 10+ µm | Stressed formulation, improper storage | Often appears as a "shoulder" on the main peak; concentration and temperature-dependent. |
| Silicon Oil | 200 nm - 5 µm | Leaky syringe pumps, sealing agents | Peak position may be consistent but unrelated to sample chemistry. |
| Filter Debris | 1 µm - 20 µm | Shedding from syringe filters | Random, non-reproducible peaks between samples. |
Diagram Title: Decision Tree for Diagnosing False Peak Sources
FAQs on DLS Multi-Peak Interpretation
Q5: How do I differentiate a true bimodal distribution (e.g., monomer/aggregate) from a dust artifact?
Answer: Perform a concentration series dilution. A true aggregate peak will show a consistent size but a varying intensity proportion relative to the monomer upon dilution. A dust peak will be random in both size and intensity across dilutions. Always run multiple (≥5) consecutive measurements; dust causes high variability, while true aggregates are reproducible.
Q6: What are the best practices for data presentation in publications to convince reviewers peaks are real?
Answer: Always include:
- A table of mean hydrodynamic diameter (Z-average), PDI, and peak intensity percentages from ≥3 independent sample preparations.
- A figure showing the correlation function and the intensity-size distribution from the same measurement.
- A statement in methods detailing the sample filtration and centrifugation protocol used.
Diagram Title: DLS Sample Prep Workflow for Contaminant-Free Data
The Scientist's Toolkit: Essential Research Reagent Solutions
Table 3: Key Materials for Robust DLS Sample Preparation
| Item | Function & Rationale | Example Product/Tip |
|---|---|---|
| Ultrapure Water System | Provides 18.2 MΩ·cm water with minimal ionic/organic contaminants, the foundation of all buffers. | Millipore Milli-Q, Thermo Scientific Barnstead. |
| Anotop 0.02 µm Syringe Filter | For definitive filtration of buffers/solvents. Inorganic aluminum oxide membrane minimizes protein adsorption. | Merck Millipore Anotop 10 (0.02 µm). |
| Low-Protein-Binding Syringe Filter | For filtering sensitive biological samples (mAbs, LNPs). PES or PVDF membranes in 0.1 or 0.22 µm pore sizes. | Pall Acrodisc PF, Sartorius Minisart. |
| Hellmanex III Solution | Specialized alkaline detergent for cuvettes. Effectively removes hydrophobic films and particles without damaging quartz. | Hellma Analytics Hellmanex III. |
| Disposable, Pre-Cleaned Cuvettes | For critical applications or screening, eliminates variability from cleaning. Ensure they are certified particle-free. | Malvern ZEN0040, Wyatt Technologies. |
| Bench-Top Micro-Centrifuge | For pelleting large aggregates prior to measurement. Must reach 10,000-15,000 x g. | Eppendorf 5424, Thermo Scientific Pico 17. |
| Positive Displacement Pipettes | For viscous samples or formulations containing surfactants, preventing bubble formation during loading. | Gilson Microman. |
Technical Support Center: Troubleshooting DLS Measurements
Troubleshooting Guides & FAQs
Q1: During DLS measurement, my sample shows multiple peaks in the size distribution. Could bubbles or airborne contaminants be the cause? A: Yes, absolutely. Bubbles and large airborne particles (e.g., dust) scatter light intensely and can appear as spurious large-diameter peaks (often > 1000 nm) or cause a significant, unreliable signal in the baseline. This is a primary source of artifact peaks that complicate the interpretation of DLS data, especially when studying polydisperse systems like protein aggregates in drug development.
Q2: What are the definitive signs that a peak is from a bubble versus a real particle? A: Bubbles are often transient. Key indicators include:
- Peak Instability: The suspected peak's position and intensity vary dramatically between consecutive measurements (e.g., 1-2 minutes apart).
- Pressure/Ultrasound Test: Applying gentle pressure to the cuvette seal or a brief, low-power ultrasonic pulse (if sample allows) may cause the bubble-related peak to diminish or shift.
- Asymmetric Correlation Function: Bubbles can cause a non-exponential decay in the intensity autocorrelation function, often visible as a "kink" or distinct curvature at short delay times.
Q3: What is the most effective protocol to eliminate bubbles from a sensitive protein sample before DLS? A: Degassing & Gentle Filtration Protocol:
- Prepare Solution: Use filtered (0.02 µm or 0.1 µm) buffer to prepare your sample stock.
- Degas Buffer: Prior to sample dilution, degas the buffer using a vacuum desiccator or by gently heating (37°C) followed by cooling in a sealed container.
- Sample Handling: Avoid vortexing. Mix by gentle, repeated pipetting or slow inversion.
- Loading the Cuvette: Tilt the cuvette and pipette the sample slowly down the side. If using a syringe, ensure the tip is at the cuvette bottom and dispense slowly.
- Settling: Allow the loaded cuvette to sit in the sample compartment for 30-60 seconds before starting measurement to let larger bubbles rise.
Q4: How can I design my lab environment to minimize airborne particle contamination? A: Implement a Clean Workflow:
- Workstation: Use a laminar flow hood or clean bench for all sample preparation.
- Cuvette Cleaning: Use a dedicated procedure: rinse with filtered solvent (e.g., ethanol), then filtered deionized water, and dry in a particle-free environment (inverted on clean lint-free wipes).
- Lid Management: Keep cuvette lids on at all times except during the brief loading period.
- Air Filtration: Consider using a portable HEPA filter in the immediate sample prep area.
Table 1: Characteristic Signatures of Common Artifacts in DLS
| Artifact Type | Typical Apparent Size Range | Effect on PDI | Effect on Correlation Function | Stability Over Repeats |
|---|---|---|---|---|
| Microbubbles | 1000 - 5000 nm | Drastically increases (>0.5) | Causes non-exponential decay at short lag times | Highly unstable |
| Dust / Airborne Particles | 500 - 5000 nm | Increases (0.3-0.5) | Can add a slow decay component | Moderately unstable |
| Protein Aggregates (Real) | 100 - 1000 nm | Varies with sample | Fits a multimodal distribution model | Stable & reproducible |
| Contaminated Solvent | < 50 nm (background) | Slightly increases baseline | Adds constant background noise | Stable |
Table 2: Efficacy of Common Bubble Elimination Techniques
| Technique | Efficacy (%)* | Sample Risk | Typical Time Required | Best For |
|---|---|---|---|---|
| Bench-top Centrifugation | 85-95 | Low to Moderate | 5-10 min | Stable protein solutions, colloids |
| Vacuum Degassing | >95 | Low (buffer only) | 10-15 min | Buffer preparation |
| Ultrasonic Bath (Gentle) | 70-80 | High (can denature) | 30-60 sec | Robust, non-biological samples |
| Settling/Waiting | 50-70 | None | 2-5 min | All samples, as a final step |
*Estimated reduction in bubble-induced intensity scatter, based on standard lab protocols.
Experimental Protocols
Protocol 1: Systematic Verification of Particle Identity (Bubble vs. Aggregate) Objective: To distinguish between an artifact bubble peak and a genuine particle population. Materials: DLS instrument, degassed/filtered buffer, low-protein binding filters (0.1 µm), syringe. Methodology:
- Measure the sample as prepared, recording the intensity-size distribution.
- Carefully extract the sample from the cuvette using a syringe.
- Pass the sample through a 0.1 µm syringe filter (low-protein binding if proteins are present) into a clean vial.
- Gently load the filtered sample back into a clean cuvette.
- Measure immediately under identical instrument settings.
- Interpretation: If the large-diameter peak disappears completely, it was likely composed of bubbles or dust >0.1 µm. If it persists or is only partially diminished, it represents a real particle population (e.g., aggregates).
Protocol 2: Clean Room Cuvette Loading for Ultra-Sensitive Measurement Objective: To load a DLS cuvette with minimal introduction of bubbles or airborne particles. Materials: Laminar flow hood, clean gloves, filtered pipette tips, degassed sample/buffer. Workflow Diagram:
Title: Cuvette Loading Protocol in a Clean Hood
The Scientist's Toolkit: Essential Research Reagent Solutions
Table 3: Key Materials for Artifact-Free DLS Sample Preparation
| Item | Function & Rationale |
|---|---|
| 0.02 µm Anodisc or PES Syringe Filter | For ultimate buffer clarification; removes nearly all particulate background. |
| Low-Protein Binding 0.1 µm Filters | For filtering protein samples without significant sample loss due to adsorption. |
| Disposable, Pre-Cleaned Cuvettes | Eliminates variability and contamination from reusable cuvette cleaning. |
| Vacuum Degassing Station | Removes dissolved gases from buffers to prevent bubble nucleation. |
| Certified Particle-Free Water/Buffer | Commercial solutions with guaranteed low background scatter for calibration and dilution. |
| Laminar Flow Clean Bench | Provides a particle-free workspace for sample and cuvette handling. |
| Lint-Free, Anti-Static Wipes | For cleaning instrument windows and external cuvette surfaces without leaving fibers. |
DLS Data Interpretation: Context of Multiple Peaks
Logical Decision Pathway for Diagnosing Multiple Peaks
Title: Diagnostic Flowchart for DLS Multiple Peaks
Technical Support Center: Troubleshooting DLS Data Interpretation
FAQs & Troubleshooting Guides
Q1: My DLS measurement of a protein formulation at 10 mg/mL shows a large, reproducible peak at ~1 nm and a smaller, variable peak in the micron range. The sample is known to be monodisperse. What is causing this artifact? A1: This is a classic sign of multiple scattering at high concentrations. The primary, correct signal (the ~1 nm peak) is attenuated as photons are scattered more than once before reaching the detector. This can artificially enhance low-level aggregates or dust, making them appear more significant. The variability in the larger peak is a key indicator of an artifact.
- Solution: Perform a concentration series (e.g., 0.1, 0.5, 1.0, 5.0 mg/mL). The true particle size should be concentration-independent. If the larger peak diminishes proportionally with dilution and the main peak's intensity increases, it confirms multiple scattering. Use backscatter detection (NIBS) or attenuate the laser (via filter or power adjustment) for high-concentration measurements.
Q2: During analysis of a viral vector, my intensity size distribution shows two distinct peaks. How do I determine if this represents a true bimodal population or a non-ideal scattering artifact? A2: This is central to thesis research on multiple peaks. The following diagnostic protocol is essential:
| Observation | Possible True Bimodality | Possible Artifact (Non-Ideal/Concentration) |
|---|---|---|
| Peak Shift with Concentration | Peaks remain at same hydrodynamic radius (Rh). | Peak positions (especially main peak) shift significantly with dilution. |
| Peak Ratio Change | Ratio of peak intensities/areas changes predictably. | Erratic changes in peak ratios; small peak may disappear upon dilution. |
| Polydispersity Index (PDI) | PDI may be high but consistent at optimal concentration. | PDI decreases dramatically upon dilution to an optimal range. |
| Correlation Function Fit | Good fit for multiple populations. | Poor fit; residuals show systematic error. |
Q3: What specific experimental protocols can I use to validate DLS peaks in concentrated, complex formulations like antibody-drug conjugates (ADCs)? A3: Protocol for Validating Peaks in Concentrated Biologics
- Serial Dilution: Start with the formulation buffer as the diluent. Measure at the target concentration (e.g., 20 mg/mL) and then at 10, 5, 2, and 1 mg/mL. Plot Rh and PDI vs. concentration.
- Cross-Validation with Orthogonal Technique: Take the original sample and the most dilute sample (where artifacts are minimized) and analyze by Size-Exclusion Chromatography coupled with Multi-Angle Light Scattering (SEC-MALS). SEC separates populations before light scattering, avoiding interference effects.
- Sample Filtration: Pass the sample through a 0.1 µm or 0.22 µm syringe filter. If a large-particle peak disappears entirely, it was likely dust or an incidental aggregate, not an intrinsic sample property.
- Viscosity Adjustment: For very high concentrations, measure the solution viscosity independently (using a viscometer) and input the exact value into the DLS software to improve calculation accuracy.
Q4: How does the "dust filter" or "attenuation setting" in my DLS software work, and when should I adjust it? A4: These settings control the signal intensity reaching the detector.
- Dust Filter/Threshold: Discards intensity spikes from rare, large particles (dust). Use cautiously; setting it too high can mask real, low-abundance large aggregates.
- Attenuator/ND Filter/ Laser Power: Reduces the incident laser power. This is the primary tool for concentrated samples. The goal is to achieve an attenuator index/count rate within the instrument's optimal linear range (consult manufacturer specs, often 100-500 kcps for backscatter detectors). A saturated detector signal causes artificial broadening and false peaks.
Table 1: Impact of Concentration on Apparent DLS Results for a Monodisperse 10 nm Gold Nanoparticle Standard
| Concentration (nM) | Apparent Rh (nm) | PDI | Peak 1 Intensity (%) | Peak 2 (Artifact) Intensity (%) | Attenuation Setting | Diagnosis |
|---|---|---|---|---|---|---|
| 1 | 10.2 ± 0.3 | 0.05 | 100 | 0 | Auto | Ideal measurement |
| 10 | 10.5 ± 0.4 | 0.08 | 100 | 0 | Auto | Near-ideal |
| 100 | 12.1 ± 1.2 | 0.15 | 98 | 2 (40 nm) | Auto | Onset of non-ideal scattering |
| 1000 | 15.5 ± 3.1 | 0.35 | 85 | 15 (~100 nm) | Auto | Severe multiple scattering |
| 1000 | 10.8 ± 0.8 | 0.09 | 100 | 0 | Manual (Low) | Corrected via attenuation |
Table 2: Troubleshooting Guide for Common Artifact Symptoms
| Symptom | Likely Cause | Immediate Check | Corrective Action |
|---|---|---|---|
| Very high count rate, saturated detector | Sample too concentrated or scattering too strongly. | Attenuator index/Count rate. | Manually increase attenuation (add ND filter, reduce power). |
| Unphysical peak >1000 nm that varies between repeats | Dust or large, incidental aggregate. | Visual sample clarity; run buffer blank. | Filter sample (0.22 µm) and cuvette. Use ultraclean buffers. |
| Main peak size decreases with dilution | Non-ideal interactions (electrostatic, attractive). | Check solvent conditions (pH, ionic strength). | Dilute in matching formulation buffer. Use appropriate dispersant. |
| Correlation function has a "tail" at long decay times | Very low level of large aggregates OR multiple scattering. | Perform serial dilution. | Dilute sample. If tail persists, aggregates may be real (validate via SEC). |
The Scientist's Toolkit: Key Research Reagent Solutions
| Item | Function in DLS Troubleshooting |
|---|---|
| Nanoparticle Size Standards (e.g., NIST-traceable latex beads, 10 nm & 100 nm) | Validate instrument performance and measurement accuracy under various conditions. |
| Disposable Membrane Filters (0.1 µm & 0.22 µm, PES or AN) | Remove dust and incidental aggregates from samples and buffers prior to measurement. |
| Low-Volume Disposable Cuvettes (e.g., 12 µL, 45 µL, quartz) | Minimize sample volume required, reduce cleaning artifacts, and provide optimal optical quality. |
| In-Line Syringe Filters (0.02 µm, Anodisc) | For ultra-filtration of buffers when measuring very small particles (<10 nm). |
| Precision Gas-Tight Syringes | Allow for accurate, bubble-free loading of small-volume cuvettes. |
| Standard Reference Material 1962 (100 nm) | Gold-standard for validating measurements in the size range critical for biologics and viruses. |
| Viscosity Standard Oils | To calibrate or verify the temperature-dependent viscosity settings in the DLS software. |
Experimental Workflow & Decision Diagrams
Title: DLS Multiple Peak Diagnostic Workflow
Title: Single vs Multiple Scattering Pathways in DLS
Technical Support Center: DLS Data Interpretation & Multiple Peaks
Troubleshooting Guides & FAQs
Q1: My DLS measurement shows multiple peaks in the size distribution. Does this mean my sample is polydisperse? A: Not necessarily. Multiple peaks can indicate true polydisperse or multimodal samples, but they are also common artifacts. First, assess measurement reproducibility. Run at least 3-5 consecutive measurements of the same sample aliquot. Use the following table to interpret correlation coefficient and polydispersity index (PdI) trends:
| Observation | Correlation Coefficient | PdI Trend | Likely Interpretation |
|---|---|---|---|
| Consistent multiple peaks | High (>0.95) & stable | Consistent | True sample polydispersity/multimodality. |
| Peak positions shift | Low or variable | High & variable | Dust/aggregate contamination or poor sample preparation. |
| Secondary peak at <1 nm | High & stable | Low | Electrical noise artifact (common in buffers with low ionic strength). |
| Unstable baseline | Low & decaying | Very high | Sample is aggregating or sedimenting during measurement. |
Experimental Protocol for Reproducibility Assessment:
- Sample Preparation: Filter all buffers (0.02 µm pore size) and clean cuvettes meticulously. Pass protein samples through a 0.1 µm filter or centrifuge at 10,000-15,000 x g for 10 minutes to remove large aggregates/dust.
- Measurement: Equilibrate sample in the instrument for 2 minutes. Perform a minimum of 5 consecutive measurements of 30-60 seconds each.
- Data Analysis: Record the correlation function, intensity-based size distribution, and number-based distribution for each run. Calculate mean and standard deviation for the Z-Average size and PdI. Visually overlay all size distribution plots.
Q2: How can I determine if a small secondary peak is real or an artifact? A: Conduct a confidence assessment via a concentration series dilution experiment. A real population will scale predictably with concentration; an artifact will not.
Experimental Protocol for Confidence Assessment via Dilution:
- Prepare a stock solution of your sample (e.g., monoclonal antibody at 5 mg/mL).
- Serially dilute in the same filtered buffer to 2.5, 1.0, and 0.5 mg/mL.
- Measure each dilution in triplicate as per the protocol above.
- Analyze the volume- or number-based distribution. Plot the relative percentage of the suspected population against concentration.
| Dilution | Main Peak (nm) | Suspected Peak (nm) | % Intensity Susp. Peak | % Volume Susp. Peak | Interpretation |
|---|---|---|---|---|---|
| 5.0 mg/mL | 10.2 | 3.2 / 120 | 15% | <1% | Large aggregate (120 nm) visible by intensity; small peak (3.2 nm) likely buffer/electrical noise. |
| 2.5 mg/mL | 10.1 | 3.2 / 115 | 8% | <1% | Aggregate % decreases with dilution. |
| 1.0 mg/mL | 10.3 | 3.2 / - | 5% | <1% | Aggregate dissipates, confirming it was reversible. 3.2 nm peak persists, confirming artifact. |
Q3: What are the critical steps to ensure reproducible DLS data for my thesis on protein aggregation? A: Standardize your sample and measurement environment. The primary causes of poor reproducibility are contaminants, temperature fluctuations, and incorrect instrument settings.
Workflow for Optimal DLS Data Acquisition:
Diagram Title: DLS Data Quality Assurance Workflow
The Scientist's Toolkit: Research Reagent Solutions
| Item | Function in DLS Sample Prep |
|---|---|
| Anotop 0.02 µm Syringe Filter | Filters buffers to remove nanoparticulate dust, the most common source of spurious large peaks. |
| Ultrafree-MC VV 0.1 µm Centrifuge Filter | Gently clarifies protein samples without excessive adsorption or shear stress. |
| Disposable Micro Cuvettes (Spectrosil) | Pre-cleaned, quartz cells for high sensitivity; disposable to avoid cross-contamination. |
| Particle-Free Water & Ethanol | For final rinsing of reusable cuvettes in a laminar flow hood. |
| NIST-Traceable Latex Nanosphere Standards | Essential for validating instrument performance and size accuracy (e.g., 60 nm standard). |
Q4: How should I report DLS data, especially with multiple peaks, in my thesis? A: Report both the primary intensity-based distribution and the derived volume/number distributions. Always include the raw correlation function data and quality metrics in an appendix.
Logical Framework for Reporting Complex DLS Data:
Diagram Title: Thesis Data Reporting Structure
Troubleshooting Guides & FAQs
Q1: My DLS software reports a single, sharp peak for a protein sample I know is a mixture. Could this be software over-smoothing or under-fitting? A: Yes. DLS analysis software using non-negative least squares (NNLS) or CONTIN algorithms can under-fit complex data, forcing a single distribution. First, verify data quality: the baseline of the autocorrelation function must be stable and the cumulants fit (polydispersity index, PDI) should be reasonable (<0.08 for monodisperse, >0.3 indicates likely multimodality). If the raw data is noisy but the correlation decay is visibly non-single exponential, the software's regularization parameter may be set too high, oversmoothing. Protocol Check: Re-analyze with a lower regularization setting and increased number of iterations. Compare the residual plot; a random residual indicates a good fit, while a structured residual suggests under-fitting.
Q2: I see multiple peaks in my DLS size distribution, but they shift dramatically with slight changes in regularization or number of bins. Is this over-fitting? A: This is a classic sign of over-fitting, where the model captures noise instead of true signal. The software is interpreting minor fluctuations in the autocorrelation function as distinct populations. Protocol Check: 1) Dilute your sample and re-measure. True peaks should be reproducible and concentration-independent. 2) Gradually increase the regularization parameter; robust peaks will persist, while spurious peaks will vanish. 3) Always perform measurements at multiple angles (if using multi-angle DLS) to confirm size trends.
Q3: How do I objectively choose between a one-peak and a two-peak model for my therapeutic protein aggregate data? A: Use statistical model selection criteria integrated into or applied to your DLS software output. Protocol: Analyze the same autocorrelation data with both models. Extract the residual sum of squares (RSS) and the number of parameters (k). Calculate the Akaike Information Criterion (AIC) or Bayesian Information Criterion (BIC). The model with the lower score is more justified. Always cross-validate with orthogonal methods (e.g., SEC-MALS).
Q4: My DLS data shows a small aggregate peak (<1% by intensity). Is this a real aggregate or an interpretation artifact? A: Intensity-weighted DLS is exceptionally sensitive to large particles. A tiny intensity percentage can correspond to a negligible number of particles but must be investigated. Troubleshooting Protocol: 1) Filter all buffers and sample through a 0.02µm filter. Remeasure. If the peak disappears, it was likely dust. 2) Perform a volume-weighted or number-weighted transformation (using known Mie scattering parameters). If the "aggregate" peak becomes negligible in number, it may not be a biophysical concern. 3) Conduct a spike-in experiment with a known volume fraction of monodisperse large vesicles to calibrate the sensitivity of your system.
Q5: The software's "Quality" parameter is high, but the size distribution looks physically impossible for my known sample. What's wrong? A: A high "quality" metric often reflects a good mathematical fit to the autocorrelation data, not the physical accuracy of the derived distribution. The underlying distribution model (e.g., assuming spherical, non-interacting particles) may be invalid. Protocol Check: 1) Confirm your sample's refractive index and viscosity parameters are correctly set. 2) Check for inter-particle interactions: measure at 3-4 concentrations. A size that trends with concentration suggests an interaction effect confounding the model. 3) Consider if your particle shape (rod, chain) violates the spherical model assumption.
Table 1: Impact of Regularization Parameter (α) on DLS Peak Resolution for a Bimodal Standard
| Regularization (α) | Reported Peak 1 (nm) | Peak 1 Intensity % | Reported Peak 2 (nm) | Peak 2 Intensity % | Residual Sum of Squares | Likely Interpretation |
|---|---|---|---|---|---|---|
| Very Low (1e-5) | 5.2 | 65% | 52.1 | 18% | 9.8e-6 | Over-fit (noise modeled as 3rd peak) |
| Optimal (0.1) | 9.8 | 85% | 98.5 | 15% | 1.2e-5 | Correct fit (true bimodality) |
| High (10) | 12.5 | 100% | - | 0% | 8.5e-5 | Under-fit (missed second population) |
Table 2: Model Selection Criteria for a Monoclonal Antibody Sample
| Distribution Model | Number of Parameters (k) | Residual Sum of Squares (RSS) | Akaike IC (AIC) | Bayesian IC (BIC) | Recommended Model |
|---|---|---|---|---|---|
| Single Peak | 3 | 4.32e-4 | -5432.1 | -5420.5 | |
| Two Peaks | 5 | 1.87e-4 | -5489.7 | -5471.2 | Two Peaks |
| Three Peaks | 7 | 1.82e-4 | -5483.4 | -5458.1 |
Experimental Protocols
Protocol: Validating DLS Software Output Against a Known Bimodal Standard
- Standard Preparation: Use a certified latex nanoparticle bimodal mix (e.g., 20nm & 100nm). Dilute in filtered, deionized water to a final concentration of ~0.005% w/v to avoid multiple scattering.
- Instrument Calibration: Perform calibration using a pure, monodisperse standard (e.g., 60nm latex) at the same temperature and cell position as the sample run.
- Data Acquisition: Set measurement temperature to 25°C. Perform a minimum of 10 consecutive runs of 60 seconds each. Use an automatic attenuator selection to ensure the detected count rate is within the instrument's optimal range.
- Iterative Analysis: Export the averaged autocorrelation function. Analyze it using the CONTIN algorithm in your software. Start with the manufacturer's default regularization (α).
- Parameter Sweep: Re-analyze the same data file systematically, varying α across a logarithmic scale (e.g., 0.001, 0.01, 0.1, 1, 10). Record the resulting size distributions and fit residuals for each.
- Validation: The "correct" α produces two stable peak positions across repeated measurements, has a random residual plot, and aligns with the known standard certificate values within instrument error margins.
Protocol: Orthogonal Verification of DLS Multiple Peaks via Asymmetric Flow Field-Flow Fractionation (AF4)
- Sample Prep: Use the exact same protein or nanoparticle formulation analyzed by DLS.
- AF4 Method Development: Choose an appropriate membrane (e.g., 10kDa cutoff for proteins). Optimize the cross-flow decay program to separate the expected size range.
- Inline Multi-Angle Light Scattering (MALS): Connect the AF4 outlet directly to a MALS detector and a refractive index (RI) detector. The MALS provides absolute, weight-average molar mass (Mw) for each eluting slice.
- Data Correlation: The AF4 fractogram (RI signal vs. time) provides a separation-based profile. Compare the elution times of peaks to the hydrodynamic radius (Rh) calculated from DLS. The first eluting peak in AF4 should correspond to the larger Rh peak in DLS. This confirms if DLS multiple peaks represent distinct, separable populations or fitting artifacts.
Visualizations
Title: DLS Data Analysis Workflow & Pitfall Decision Points
Title: Thesis Context: Interpreting DLS Multiple Peaks
The Scientist's Toolkit: Research Reagent Solutions
Table 3: Essential Materials for Robust DLS Data Interpretation
| Item | Function & Rationale |
|---|---|
| Certified Nanosphere Size Standards (e.g., NIST-traceable latex) | Provides an absolute reference to validate instrument performance and software accuracy for monomodal and bimodal distributions. Critical for distinguishing software artifact from real signal. |
| Anotop 0.02µm Syringe Filters (or equivalent) | For ultrafiltration of all buffers and samples to remove dust and sub-micron particulates, which are a primary source of spurious large "peaks" in intensity-weighted DLS. |
| Disposable Micro Cuvettes (Low Volume, UV-transparent) | Minimizes sample volume, reduces cleaning artifacts, and allows for quick, reproducible loading. Essential for high-throughput screening of formulation conditions. |
| Stable, Monodisperse Protein Control (e.g., BSA, Lysozyme) | A well-characterized, non-aggregating protein standard to establish baseline system performance for biological samples under standard buffer conditions. |
| Dynamic Light Scattering Software with Adjustable Regularization | Software that allows user control over fitting parameters (like the regularization α in CONTIN) is mandatory for investigating over-fitting/under-fitting, not just a "black box" report. |
| SEC-MALS or AF4-MALS System | The primary orthogonal technique. Separates populations by size/hydrodynamic volume before light scattering detection, providing definitive validation of DLS-resolved peaks. |
Validating DLS Multi-Peak Data with Orthogonal Techniques
Troubleshooting Guides & FAQs for DLS Data Interpretation (Multiple Peaks)
This technical support center addresses common challenges in interpreting Dynamic Light Scattering (DLS) data, particularly the presence of multiple peaks, within the context of advanced nanoparticle and protein therapeutic research.
FAQ: Interpreting Multiple Peaks
Q1: My DLS correlation function is multi-exponential, and my size distribution shows multiple peaks. Does this always mean I have a polydisperse sample with distinct particle populations?
A: Not necessarily. While multiple peaks can indicate a true polydisperse mixture (e.g., monomers, aggregates, and fragments), they can also be artifacts. Common causes include:
- Dust or Foreign Particles: A single large contaminant can create a false "large particle" peak.
- Viscosity/Temperature Errors: Incorrect solvent parameters in the software can distort calculated sizes.
- Scattering Angle Effects: For large particles (>100 nm), a single angle measurement may not be sufficient to resolve true size distribution. Triangulation using multiple techniques is required for validation.
Q2: I see a peak below 1 nm in my intensity-weighted distribution. Is this real?
A: Almost certainly not. Peaks below 1 nm (or below the solvent molecule size) are typically noise artifacts from the fitting algorithm deconvoluting the correlation function. Refer to the volume- or number-weighted distribution, which will typically suppress this noise, and cross-check with a high-resolution technique like Size Exclusion Chromatography (SEC).
Q3: How do I distinguish between a true aggregate peak and a mis-specified solvent viscosity?
A: Use the following diagnostic protocol:
| Observation | If viscosity is too HIGH (in software) | If viscosity is too LOW (in software) |
|---|---|---|
| Reported Hydrodynamic Size | All peaks shift to smaller than true size. | All peaks shift to larger than true size. |
| Polydispersity Index (PdI) | May appear artificially improved. | May appear artificially worse. |
| Diagnostic Test | Measure a NIST-traceable latex standard in the same solvent and temperature. Adjust solvent parameters until the standard reads correctly. |
Experimental Protocol: Triangulating DLS Multi-Peak Data
To confirm the physical reality of multiple peaks, employ this multi-technique workflow:
Protocol Title: Validation of Apparent Polydispersity via Orthogonal Sizing Techniques.
Objective: To confirm whether multiple peaks observed in DLS represent distinct particle populations.
Materials:
- Purified sample.
- DLS instrument (e.g., Malvern Zetasizer, Wyatt DynaPro).
- Supporting orthogonal technique (e.g., SEC with MALS detection, Analytical Ultracentrifugation (AUC), Nanoparticle Tracking Analysis (NTA)).
- Appropriate buffers and column (if using SEC).
Method:
- DLS Measurement: Perform DLS at minimum three angles (e.g., 90°, 45°, 173° backscatter) if instrument capable. Record intensity, volume, and number-weighted distributions.
- Sample Fractionation (if aggregates suspected): Inject sample into an SEC system coupled to a UV detector.
- In-line Multi-Angle Light Scattering (MALS): Direct the SEC eluent through a MALS detector. This provides an absolute molecular weight/size for each eluting population independent of elution time.
- Data Correlation: Align the SEC chromatogram (UV signal) with the MALS-derived size data and the original DLS distribution.
- Interpretation:
- True Polydispersity: A strong correlation between DLS peak sizes and SEC-MALS peak sizes is observed.
- DLS Artifact: Peaks present in DLS do not correspond to distinct elution peaks in SEC-MALS.
Diagram Title: Decision Workflow for Interpreting Multiple Peaks in DLS.
The Scientist's Toolkit: Research Reagent Solutions
| Item | Function in DLS/Triangulation Experiments |
|---|---|
| NIST-Traceable Nanosphere Standards (e.g., 60nm, 100nm) | Calibrate and validate instrument performance, verify solvent viscosity/temperature settings. |
| Anotop 0.02 µm Syringe Filters (Inorganic) | Filter solvents and samples to remove dust without introducing organic contaminants. |
| Size Exclusion Columns (e.g., Superdex 200 Increase, TSKgel G3000SW) | Separate populations by hydrodynamic size for orthogonal analysis via SEC-MALS. |
| MALS Detector (e.g., Wyatt DAWN, Optilab) | Provides absolute molecular weight/size measurement for each population eluting from SEC. |
| Stable, High-Purity Buffer (e.g., PBS, Histidine) | Minimizes scattering background and unwanted sample interactions during analysis. |
| Quartz or Disposable Micro Cuvettes | High-quality, particle-free cuvettes for DLS measurements to minimize scattering artifacts. |
Troubleshooting Guides & FAQs
Q1: My DLS measurement shows a single, sharp peak, but SEC-MALS reveals multiple oligomeric states. Which result should I trust? A: Trust the SEC-MALS result. DLS measures hydrodynamic radius (Rh) averaged by scattering intensity, heavily weighted towards larger species. A single, sharp DLS peak often indicates a monodisperse sample, but it cannot resolve species with similar Rh (e.g., a dimer vs. a slightly expanded monomer). SEC-MALS first separates by size, then independently measures molar mass, providing resolution of different oligomers. The DLS result may be a weighted average of unresolved species.
Q2: During SEC-MALS, I observe a negative peak or a dip in the UV signal at the void volume. What causes this? A: A negative UV peak is typically a refractive index (RI) artifact caused by a mismatch between the sample and running buffer. The sample buffer has a different RI than the SEC running buffer. When a large aggregate or particle elutes at the void volume, it displaces the running buffer in the flow cell, causing a temporary shift in the RI and a consequent dip in the UV baseline. Ensure thorough buffer exchange into the exact SEC running buffer prior to injection.
Q3: My DLS autocorrelation function decays very slowly, and the software reports a very large particle size with low quality. What's wrong? A: This usually indicates the presence of large, scattering aggregates or contaminants (dust/fibrils). These dominate the scattering signal, corrupting the correlation function for the protein of interest. The "slow decay" corresponds to the slow diffusion of these large particles.
- Troubleshooting Steps:
- Centrifuge or filter your sample (e.g., 0.02 µm or 0.1 µm filter for proteins) immediately before loading into the DLS cuvette.
- Ensure the cuvette is impeccably clean.
- Check sample for precipitate or turbidity.
- If problem persists, the sample may be inherently aggregating; optimize buffer conditions (pH, salt, stabilizers).
Q4: How do I interpret multiple peaks in my DLS size distribution plot within my thesis research on DLS data interpretation? A: In the context of your thesis, multiple peaks indicate a polydisperse sample containing particles with distinct hydrodynamic radii. Critical interpretation is required:
- Peak Size Ratio: Peaks with radii differing by less than a factor of 2-3 may be unreliable resolutions (e.g., monomer vs. dimer). SEC-MALS is needed for confirmation.
- Peak Intensity: The intensity-weighted distribution over-represents larger species. A small peak of large aggregates can overshadow a major peak of the desired protein.
- Artifact vs. Reality: Always correlate with SEC-MALS and sample history. A small-molecule peak (e.g., from ATP) will have a tiny Rh; a dust/aggregate peak will be very large and variable.
- Thesis Analysis: Frame DLS multiple peak data as a preliminary assessment of sample homogeneity and a guide for further orthogonal analysis (like SEC-MALS), not as a definitive quantification of oligomeric state.
Q5: SEC-MALS shows my protein exists in a monomer-dimer equilibrium. How can I determine the Kd using this data? A: SEC-MALS provides direct, mass-based measurement across the elution peak. For a reversible monomer-dimer system, the apparent molar mass will vary across the peak, being highest at the leading edge (dimer-rich) and lowest at the trailing edge (monomer-rich).
- Protocol: Inject the sample at multiple, increasing concentrations. For each run, use the MALS data to calculate the weight-average molar mass (Mw) at multiple slices across the peak. Analyze the concentration dependence of Mw using software (like ASTRA) to fit a monomer-N-mer association model and extract the equilibrium constant (Kd).
Data Presentation
Table 1: Comparison of DLS and SEC-MALS for Oligomeric State Analysis
| Feature | Dynamic Light Scattering (DLS) | Size-Exclusion Chromatography with Multi-Angle Light Scattering (SEC-MALS) |
|---|---|---|
| Primary Measurement | Hydrodynamic radius (Rh) via diffusion coefficient | Molar mass (Mw) via Rayleigh scattering; size via SEC retention time |
| Sample State | Bulk solution, no separation | Separated by hydrodynamic volume in-line |
| Resolution | Low. Cannot reliably resolve species with <2-3x difference in Rh. | High. Can resolve species with different Mw that co-elute or have similar Rh. |
| Weighting | Intensity-weighted, biased towards larger particles. | Mass-weighted (from MALS); concentration-weighted (from UV/RI). |
| Key Output | Size distribution plot (intensity vs. Rh); polydispersity index (PdI). | Chromatograms (UV/RI vs. time); absolute molar mass vs. time/elution volume. |
| Best For | Rapid assessment of sample monodispersity/aggregation, stability studies. | Defining absolute oligomeric state, detecting aggregates, analyzing complexes. |
Table 2: Common Artifacts and Solutions in DLS & SEC-MALS
| Issue | Likely Cause | Solution |
|---|---|---|
| DLS: Poor correlation function fit | Aggregates, dust, or too low/high concentration. | Filter/centrifuge sample; optimize concentration. |
| DLS: Multiple peaks with similar size | May be fitting artifact, not true populations. | Verify with SEC-MALS; use regularization algorithms cautiously. |
| SEC-MALS: High pressure | Column clogging from aggregated sample or buffer particulates. | Centrifuge/filter sample (0.1 µm); filter all buffers (0.02 µm). |
| SEC-MALS: Negative UV peak at void | Refractive index mismatch between sample and running buffer. | Perform complete buffer exchange into running buffer. |
| SEC-MALS: Mw varies across peak | Non-ideal column interactions or reversible self-association. | Vary injection concentration; analyze for equilibrium; consider different SEC buffer. |
Experimental Protocols
Protocol 1: Basic DLS Measurement for Oligomeric State Screening
- Sample Preparation: Dialyze or desalt protein into a clear, particle-free buffer (e.g., 20 mM HEPES, 150 mM NaCl, pH 7.4). Avoid high concentrations of absorbers or scatterers (e.g., >1 mM DTT, >0.1% Triton).
- Clarification: Centrifuge sample at >15,000 x g for 10 minutes at 4°C, or filter through a 0.1 µm (for proteins >50 kDa) or 0.02 µm centrifugal filter.
- Loading: Pipette supernatant directly into a clean, low-volume quartz or glass cuvette. Avoid bubbles.
- Measurement: Equilibrate to instrument temperature (typically 20°C or 25°C). Set measurement duration to achieve a high signal-to-noise correlation function (typically 5-10 acquisitions of 10 seconds each).
- Analysis: Use instrument software to obtain the intensity-based size distribution and polydispersity index (PdI). A PdI <0.1 suggests monodisperse; >0.2 indicates significant polydispersity.
Protocol 2: SEC-MALS for Absolute Oligomeric State Determination
- System Equilibration: Equilibrate the HPLC system and SEC column (e.g., Superdex 200 Increase) with at least 1.5 column volumes of degassed, filtered (0.02 µm) running buffer at a constant flow rate (e.g., 0.5 mL/min).
- Detector Calibration & Normalization: Perform MALS detector normalization using a monodisperse protein standard (e.g., BSA). Calibrate the differential refractometer (dRI) response using a known concentration of standard.
- Sample Preparation: Dialyze/exhaustively desalt the protein into the running buffer. Centrifuge at >15,000 x g for 10 min and carefully extract supernatant. Determine precise concentration (A280).
- Injection & Separation: Inject 50-100 µL of sample (at a concentration where MALS signal is sufficient, often 1-5 mg/mL for a 150 kDa protein). Begin data collection from all detectors (UV, MALS, dRI).
- Data Analysis: In software (e.g., ASTRA), select the protein peak. Define baselines. The software will combine the MALS and dRI (or UV-concentration) signals to calculate the absolute molar mass across the peak. The average across the peak apex confirms the oligomeric state.
Mandatory Visualization
Title: Workflow for Oligomeric State Analysis Using DLS and SEC-MALS
Title: Interpreting Multiple Peaks: DLS vs. SEC-MALS Data
The Scientist's Toolkit
Table 3: Essential Research Reagent Solutions for DLS & SEC-MALS
| Item | Function | Critical Specification |
|---|---|---|
| SEC Running Buffer | Mobile phase for chromatography. Must be compatible with protein and columns. | Low UV absorbance, filtered through 0.02 µm membrane, degassed. Common: PBS, Tris-HCl, HEPES with 150+ mM NaCl. |
| Protein Standard (for MALS) | Used to normalize MALS detector angles and verify system performance. | Monodisperse, stable protein with known molar mass and dn/dc (e.g., BSA, thyroglobulin). |
| SEC Column | Separates molecules by hydrodynamic size in solution. | Pore size selected for target protein's molecular weight range (e.g., Superdex 75 for 3-70 kDa, Superdex 200 for 10-600 kDa). |
| dRI Standard (e.g., Sucrose) | Used to calibrate the differential refractometer response for concentration determination. | High-purity, known dn/dc in the running buffer. |
| 0.02 µm & 0.1 µm Filters | Removes sub-micron particulates and aggregates that interfere with light scattering signals. | Anopore or similar hydrophilic membranes for minimal protein binding. |
| Concentration Measurement Tool | Precisely determines sample concentration for SEC-MALS injection and dn/dc input. | UV-Vis spectrophotometer with accurate pathlength, using known extinction coefficient. |
| Centrifugal Filter Units | For buffer exchange into SEC running buffer and sample clarification. | Appropriate molecular weight cutoff (MWCO) to retain protein while passing buffer salts. |
Troubleshooting Guides & FAQs
Q1: Why does my DLS measurement show multiple peaks in the size distribution, while NTA shows a single, broader peak? A: DLS intensity-weighted distributions are highly sensitive to larger particles (scattering ~diameter^6). A small number of aggregates or dust can create a secondary peak. NTA provides a direct, particle-by-particle count. The "broader" NTA peak may more accurately represent the true polydispersity. Verify sample cleanliness via filtration (e.g., 0.02 µm syringe filter) and ensure no air bubbles are present.
Q2: My particle concentration from NTA is consistently 2-3 orders of magnitude lower than the theoretical or DLS-derived concentration. What is wrong? A: This is expected and not an error. DLS estimates concentration from the derived diffusion coefficient and assumed scattering models, which can be inaccurate for complex formulations. NTA only counts particles within its detection threshold (typically ~10-100 nm to ~1 µm, depending on material). Particles outside this range or with low scattering index are not counted. Confirm your sample is within the optimal concentration for NTA (10^7-10^9 particles/mL).
Q3: How should I prepare samples differently for DLS versus NTA to ensure comparable results? A: Follow this protocol:
- Common Step: Filter your buffer (0.02 µm) to remove background contaminants.
- For DLS: Filter sample through a 0.45 µm or 0.22 µm filter to remove dust. Use a low-volume quartz cuvette. Optimal concentration is higher than for NTA.
- For NTA: Do NOT filter the sample if your particles are >200 nm, to avoid loss. Dilute in filtered buffer to achieve 20-100 particles per frame. Use a 1 mL syringe for manual, slow injection into the sample chamber.
Q4: I am studying protein aggregation. Which technique is better for distinguishing monomeric from oligomeric peaks? A: NTA is generally superior for this application. DLS struggles to resolve populations with size ratios < 3:1. A 5 nm monomer and a 15 nm oligomer may appear as a single broad peak. NTA can visually resolve and count these sub-populations individually, provided they are above the detection limit and differ sufficiently in scattering intensity.
Q5: What does a stable, unimodal DLS correlation function with a "clean" decay indicate about sample quality for NTA? A: A clean, single-exponential decay in the DLS correlation function suggests a monodisperse sample with minimal aggregates or dust. This is an ideal pre-screening indicator. For such a sample, NTA should show a tight Gaussian-like size distribution, and the measured concentration is highly reliable.
Data Presentation
Table 1: Core Comparative Metrics of DLS vs. NTA
| Parameter | Dynamic Light Scattering (DLS) | Nanoparticle Tracking Analysis (NTA) |
|---|---|---|
| Measured Principle | Fluctuations in scattered light intensity | Brownian motion of individual particles |
| Primary Output | Intensity-weighted size distribution (Z-average) | Number-weighted size distribution & concentration |
| Size Range | ~0.3 nm to ~10 µm | ~10 nm to ~2 µm (instrument/model dependent) |
| Concentration Range | ~0.1 mg/mL to >10 mg/mL (sample dependent) | ~10^7 to 10^9 particles/mL (optimal for counting) |
| Resolution | Low (cannot resolve peaks with < 3x diameter difference) | Medium-High (can visualize sub-populations) |
| Sample Preparation | Often requires filtration; minimal dilution | Requires significant dilution; filtration can be problematic |
| Key Artifact Source | Dust, aggregates, multiple scattering (high conc.) | Improper dilution, background debris, camera settings |
Table 2: Typical Data Discrepancy Analysis (Protein Nanoparticle Formulation)
| Observation | Probable Cause | Diagnostic Experiment |
|---|---|---|
| DLS: 2 peaks (8 nm & 60 nm). NTA: 1 peak at 15 nm. | DLS overly sensitive to trace aggregates. NTA may miss small monomers. | Perform analytical ultracentrifugation (AUC) as a gold standard. |
| NTA concentration stable, DLS Z-average increasing over time. | Sample is aggregating. DLS intensity-weighting amplifies this signal early. | Take NTA samples at each time point to monitor aggregation onset visually. |
| DLS PDI > 0.3, but NTA shows a narrow distribution. | A sub-population of large aggregates/vesicles is skewing the DLS result. | Pre-filter sample through a 0.1 µm filter and repeat DLS. |
Experimental Protocols
Protocol 1: Cross-Validation of DLS and NTA for Liposome Formulations
- Sample Prep: Prepare liposomes via extrusion (100 nm filter). Dilute stock in 1xPBS (pre-filtered 0.02 µm).
- DLS Measurement:
- Load 50 µL into a low-volume cuvette.
- Equilibrate to 25°C for 2 min.
- Perform 5 measurements of 10 runs each.
- Record Z-average, PDI, and intensity distribution.
- NTA Measurement:
- Dilute sample further in PBS to achieve ~50 particles/frame.
- Load into syringe, inject into chamber slowly.
- Capture three 60-second videos at camera level 14.
- Analyze with detection threshold constant across all videos.
- Record mode size and particle concentration.
- Analysis: Compare DLS intensity peak to NTA number mode. NTA concentration can be used with DLS size to refine scattering models.
Protocol 2: Investigating Multiple Peaks in DLS (Thesis Context)
- Objective: Determine if secondary DLS peaks represent true populations or artifacts.
- Procedure:
- Measure raw sample via DLS, record correlation function and distribution.
- Centrifuge sample at 10,000 x g for 15 minutes to pellet large aggregates.
- Carefully extract and measure the supernatant via DLS.
- If the secondary peak disappears, it likely represented aggregates.
- If it persists, fractionate sample via size-exclusion chromatography (SEC).
- Collect fractions and analyze each independently via DLS and NTA to isolate sub-populations.
- Thesis Integration: This protocol helps differentiate between true heterogeneity (multiple stable species) and sample instability (aggregation), a critical nuance in data interpretation.
Mandatory Visualization
Diagram 1: Decision Pathway for Technique Selection
Diagram 2: Sample Prep & Analysis Workflow for Cross-Validation
The Scientist's Toolkit: Research Reagent Solutions
| Item | Function in DLS/NTA Experiments |
|---|---|
| Anotop 0.02 µm Syringe Filter | Filters buffer to remove nanometer-scale contaminants that cause background scattering. Essential for both techniques. |
| Disposable Plastic Cuvettes (for DLS) | Low-cost, low-volume cuvettes for screening samples where quartz cuvettes are not necessary. |
| Quartz Micro Cuvette (for DLS) | Provides optimal clarity and minimal background for accurate DLS measurements of delicate samples. |
| 1 mL Disposable Syringes | Used for manual injection of samples into the NTA sample chamber without introducing bubbles. |
| PBS, 0.02 µm Filtered | A common, isotonic, and particle-free dilution buffer for biological nanoparticles (e.g., liposomes, EVs, proteins). |
| Latex Nanosphere Standards | Monodisperse particles (e.g., 100 nm) for verifying instrument calibration and performance for both DLS and NTA. |
| Particle-Free Water | Used for final rinsing of all syringes, cuvettes, and chambers to prevent cross-contamination. |
DLS vs. Tunable Resistive Pulse Sensing (TRPS) for High-Resolution Sub-Populations
Technical Support Center
Troubleshooting Guides & FAQs
Q1: My DLS measurement shows a single, sharp peak, but my sample is known to contain two distinct particle sizes. What could cause this?
A: This is a common DLS data interpretation issue. A single peak can result from:
- Low Resolution: The size difference is below DLS's inherent resolution limit (~3:1 diameter ratio for reliable separation).
- Intensity-Weighting Bias: The larger sub-population dominates the scattered light intensity, masking the signal from smaller particles.
- Sample Preparation: Aggregation or instability may have created a dominant monomodal distribution.
- Analysis Settings: An excessively high "dust filter" or incorrect viscosity/temperature parameters can obscure smaller populations.
Protocol for Diagnosis: Run a serial dilution. If the peak position shifts significantly with concentration, interparticle interactions are likely skewing results. Validate with a complementary technique like TRPS.
Q2: During TRPS measurements, the event rate suddenly drops to zero or becomes erratic. How do I resolve this?
A: This indicates a pore blockage or stability issue.
- Immediate Action: Stop the measurement. Apply a reverse pressure pulse (if your instrument supports it).
- Cleaning Protocol: Flush the system with the recommended cleaning solution (e.g., 2% Hellmanex III, followed by copious filtered water and buffer).
- Prevention: Always centrifuge and filter (e.g., 0.1 µm syringe filter) your samples and buffers immediately before analysis. Ensure no air bubbles are introduced into the fluidic system.
- Pore Check: Use a standard calibration particle sample. If the event rate remains unstable, the pore membrane may need replacement.
Q3: In my DLS data for a protein therapeutic, I consistently see multiple peaks. How do I determine if they represent true sub-populations (e.g., monomers, aggregates, fragments) or are artifacts?
A: Interpreting multiple peaks is central to DLS data interpretation multiple peaks meaning research. Follow this validation workflow:
- Repeat under Dilution: Measure at multiple concentrations. True aggregate peaks will persist and often scale non-linearly.
- Change Measurement Angle: Use a multi-angle DLS (MALS-DLS) system. True aggregates will show characteristic angular dependence.
- Cross-Validate: Perform a parallel analysis using TRPS.
- Protocol: Dilute the same sample in filtered PBS. Run on a TRPS system using a NP200 or NP400 pore. Compare the number-weighted distribution from TRPS to the intensity-weighted DLS distribution.
- Stress Test: Subject the sample to a known stress (e.g., heat, freeze-thaw). A true aggregate peak will grow systematically.
Q4: My TRPS concentration results are consistently lower than expected from my preparation. What are potential sources of particle loss?
A: Particle loss in TRPS is often due to adsorption.
- Surface Passivation: Silanize the fluidic cell or use dynamic coatings. A standard protocol is to incubate the system with 1% w/v Pluronic F-127 or bovine serum albumin (BSA) in buffer for 30 minutes, then flush with working buffer.
- Buffer Optimization: Increase ionic strength (e.g., use 100-200 mM NaCl) and use a non-ionic surfactant (e.g., 0.01% Tween 20).
- Control Experiment: Spike in a known concentration of standard particles (e.g., 200 nm carboxylated PS) to determine your system's recovery efficiency.
Q5: For characterizing a bimodal viral vector sample, which technique provides more reliable sub-population resolution, and why?
A: TRPS is superior for resolving discrete sub-populations in a bimodal mixture (e.g., full vs. empty viral capsids).
- Reason: DLS's intensity weighting and low resolution can merge two close populations (e.g., 70 nm vs. 100 nm). TRPS provides direct, particle-by-particle size and concentration measurement, offering high resolution on a number-weighted basis, which is critical for quantifying sub-population ratios.
Comparative Data Table: DLS vs. TRPS for Sub-Population Analysis
| Parameter | Dynamic Light Scattering (DLS) | Tunable Resistive Pulse Sensing (TRPS) |
|---|---|---|
| Weighting | Intensity-weighted (biased toward larger particles) | Number-weighted (counts individual particles) |
| Size Resolution | Low (~3:1 ratio for reliable peak separation) | High (can distinguish particles with <10% size difference) |
| Concentration Measurement | Indirect, requires assumptions | Direct and absolute (particles/mL) |
| Sample Throughput | High (seconds/minutes per measurement) | Low (minutes to tens of minutes per measurement) |
| Minimum Detectable Size | ~0.3 nm (proteins) | ~40 nm (with standard pores) |
| Key Artifact/Error Source | Dust, aggregate formation, viscous samples | Pore blockage, sample adsorption, electrolyte choice |
| Ideal Use Case | Rapid stability assessment, hydrodynamic size trends, detecting large aggregates. | High-resolution sub-population quantification, precise concentration analysis, complex mixtures. |
The Scientist's Toolkit: Research Reagent Solutions
| Item | Function in DLS/TRPS Experiments |
|---|---|
| Filtered Buffer (0.1 µm) | Provides ultraclean dispersant for sample dilution and system flushing, eliminating dust artifacts. |
| Pluronic F-127 (1% w/v) | Non-ionic surfactant used to passivate fluidic surfaces in TRPS, minimizing sample adsorption. |
| Standard Polystyrene Particles (e.g., 100 nm, 200 nm) | Essential for instrument calibration (DLS: angle alignment; TRPS: pore calibration, size & concentration verification). |
| Hellmanex III (2% v/v) | Aqueous cleaning concentrate for removing organic contaminants from TRPS fluidic cells and DLS cuvettes. |
| Disposable Syringe Filters (0.1 µm PES) | For final filtration of all buffers and samples prior to TRPS analysis to prevent pore blockage. |
| Zeta Potential Standard | Used to validate DLS system performance for electrophoretic mobility measurements. |
| NP200 / NP400 Pore Membranes (TRPS) | Stretchable pores for analyzing particles in the ~70-1000 nm size range. NP200 for smaller sizes, NP400 for larger. |
Experimental & Data Interpretation Workflows
DLS Multiple Peak Interpretation Decision Tree
TRPS Event Rate Troubleshooting Guide
DLS & TRPS Complementary Analysis Workflow
Establishing a Correlative Characterization Protocol for Complex Biologics
Technical Support Center: Troubleshooting DLS Data Interpretation for Multi-Domain Biologics
FAQs & Troubleshooting Guides
Q1: During DLS analysis of my monoclonal antibody formulation, I consistently observe multiple peaks. Does this always indicate aggregation? A: Not necessarily. Multiple peaks can indicate multiple particle populations. For a monoclonal antibody, a small second peak at a larger hydrodynamic radius (Rh) often suggests the presence of aggregates. However, a peak at a very small Rh (<1 nm) could indicate signal from excipients or buffer components. A peak with an Rh slightly larger than the main monomer peak could indicate fragments or flexible conformers. Correlation with orthogonal techniques like SEC-MALS is essential.
Q2: How do I distinguish between a true aggregate peak and interference from dust or large particulates in my DLS measurement? A: Dust/particulates typically cause a very large, variable signal and can skew the intensity-weighted distribution. Follow this protocol:
- Sample Preparation: Filter all buffers through a 0.02 µm or 0.1 µm syringe filter. Centrifuge the protein sample at 10,000-15,000 x g for 10 minutes before loading into the cuvette.
- Instrument Check: Perform a buffer background measurement. The measured count rate (kcps) should be low and stable.
- Data Consistency: Run the sample in triplicate. True aggregates will show consistent peak positions and relative intensities. Dust spikes are irregular.
- Threshold Setting: Use the instrument's "dust rejection" or similar algorithm if available.
Q3: My DLS data shows a single peak, but my SEC-HPLC indicates high molecular weight species. Why the discrepancy? A: DLS is intensity-weighted, meaning larger particles scatter light much more strongly. A small population of large aggregates (e.g., 0.1% by mass) may dominate the DLS signal, obscuring the main monomer peak if not properly analyzed. Conversely, SEC can separate species but may suffer from column interactions. This highlights the need for a correlative protocol.
Q4: For an ADC (Antibody-Drug Conjugate), how do I deconvolute DLS peaks arising from the native antibody, drug payload, and potential conjugate aggregates? A: This requires a controlled, stepwise correlative analysis. Establish a baseline DLS profile for the unconjugated antibody. After conjugation, any new peak at a larger Rh may indicate aggregated ADC. A slight shift in the main peak's Rh is expected due to payload attachment. Use the following table to guide interpretation:
Table 1: Interpreting Multiple Peaks in DLS for ADCs
| Peak Hydrodynamic Radius (Rh) | Possible Identity | Correlative Technique for Verification |
|---|---|---|
| Rh ≈ 5-6 nm | Native Monoclonal Antibody (reference) | SEC-UV, Native MS |
| Rh ≈ 6-8 nm (shift from main) | Successfully conjugated ADC monomer | HIC-HPLC, HDX-MS |
| Rh > 10 nm | ADC aggregates (covalent or non-covalent) | SEC-MALS, AF4-MALS |
| Rh < 2 nm | Free drug payload or linker fragments | RP-HPLC, LC-MS |
Q5: What is a robust correlative protocol to establish the meaning of multiple DLS peaks for a complex biologic like a bispecific antibody? A: The following stepwise protocol integrates DLS with orthogonal methods.
Experimental Protocol: Correlative Analysis of DLS Multi-Peak Data Objective: To identify the physicochemical nature of subpopulations detected by DLS in a bispecific antibody sample. Materials: Purified protein sample, DLS instrument, SEC-HPLC system, MALS detector, CD spectrometer, appropriate buffers. Procedure:
- DLS Primary Screening:
- Perform DLS measurement at a minimum of three concentrations (e.g., 0.5, 1.0, 2.0 mg/mL) in formulation buffer at 25°C.
- Record the intensity-weighted size distribution for each run.
- Note the hydrodynamic radius (Rh) and percentage intensity of each observed peak.
- SEC-MALS Correlation:
- Inject the same sample onto an SEC column coupled to MALS and refractive index (RI) detectors.
- Compare the elution profile with DLS data. The molar mass (from MALS) of each eluting peak confirms if a larger DLS Rh corresponds to a higher molar mass (aggregate) or similar molar mass (conformational change).
- Thermal Stress Test:
- Incubate aliquots of the sample at 40°C and 55°C for 30 minutes, then cool to 25°C.
- Analyze stressed samples by DLS and SEC-MALS. Track the growth of specific peaks to assess product stability.
- Conformational Assessment via CD Spectroscopy:
- If a DLS peak suggests a conformational variant (similar molar mass but different Rh), analyze the fractions corresponding to SEC peaks by Circular Dichroism (CD).
- Compare far-UV CD spectra to assess secondary structural differences.
Visualization: Correlative Characterization Workflow
Diagram Title: Workflow for Correlating DLS Multi-Peak Data
The Scientist's Toolkit: Key Research Reagent Solutions
Table 2: Essential Materials for Correlative Characterization Studies
| Item | Function in Protocol | Example/Note |
|---|---|---|
| High-Purity Formulation Buffer | Provides stable, low-noise background for DLS. Must be filtered. | 20 mM Histidine-HCl, pH 6.0, filtered through 0.1 µm membrane. |
| Size Exclusion Chromatography Column | Separates species by hydrodynamic volume for orthogonal analysis. | TSKgel SuperSW mAb HR, UHPLC column for high-resolution separation of mAbs and fragments. |
| Multi-Angle Light Scattering (MALS) Detector | Directly measures absolute molar mass of eluting species, independent of shape. | Coupled online with SEC and RI detectors. |
| Analytical Ultracentrifuge (AUC) | Provides gold-standard solution mass and shape data without immobilization. | Used to validate DLS/SEC-MALS findings, especially for small aggregate populations. |
| Dynamic Light Scattering Instrument | Measures hydrodynamic size distribution and monitors sample stability/polydispersity. | Instruments with high sensitivity detectors and automated temperature control. |
| Syringe Filters (0.02/0.1 µm) | Critical for removing dust and particulates that interfere with DLS measurements. | Low protein-binding PSU or PVDF membranes are recommended. |
| Stable Reference Protein Standards | For calibration and system suitability checks of DLS and SEC systems. | Monodisperse IgG or BSA for DLS; protein molar mass standards for SEC-MALS. |
Conclusion
Accurate interpretation of multiple peaks in DLS is paramount for reliable nanomaterial and biomolecule characterization. A foundational understanding distinguishes genuine polydispersity from artifacts, while rigorous methodology ensures data quality. Systematic troubleshooting is essential to validate peaks, and orthogonal techniques like SEC-MALS or NTA are non-negotiable for confirmation. Moving forward, integrating DLS into automated, multi-modal analysis platforms will be crucial for accelerating the development of next-generation therapeutics, from complex APIs to advanced delivery systems, ensuring safety and efficacy through precise physical attribute control.