BAG1 vs BAG3 in Protein Homeostasis: Navigating Proteasomal Degradation and Selective Autophagy in Disease and Therapeutics
This comprehensive analysis explores the distinct yet interconnected roles of BAG1 and BAG3 co-chaperones in cellular protein quality control.
BAG1 vs BAG3 in Protein Homeostasis: Navigating Proteasomal Degradation and Selective Autophagy in Disease and Therapeutics
Abstract
This comprehensive analysis explores the distinct yet interconnected roles of BAG1 and BAG3 co-chaperones in cellular protein quality control. We detail their foundational biology, where BAG1 primarily facilitates Hsp70-client delivery to the proteasome for degradation, while BAG3 mediates the autophagic clearance of aggregated and damaged proteins. The article provides methodological insights for studying these pathways, addresses common experimental challenges, and offers a direct comparative evaluation of their mechanisms, regulation, and functional outcomes. Targeted at researchers and drug developers, this review synthesizes current knowledge to inform therapeutic strategies for neurodegenerative diseases, cancer, and aging, where modulating these pathways holds significant promise.
Understanding BAG1 and BAG3: Core Mechanisms in Proteostasis and Cellular Stress Response
Research Context: BAG1-Mediated Proteasomal Degradation vs. BAG3-Mediated Autophagy
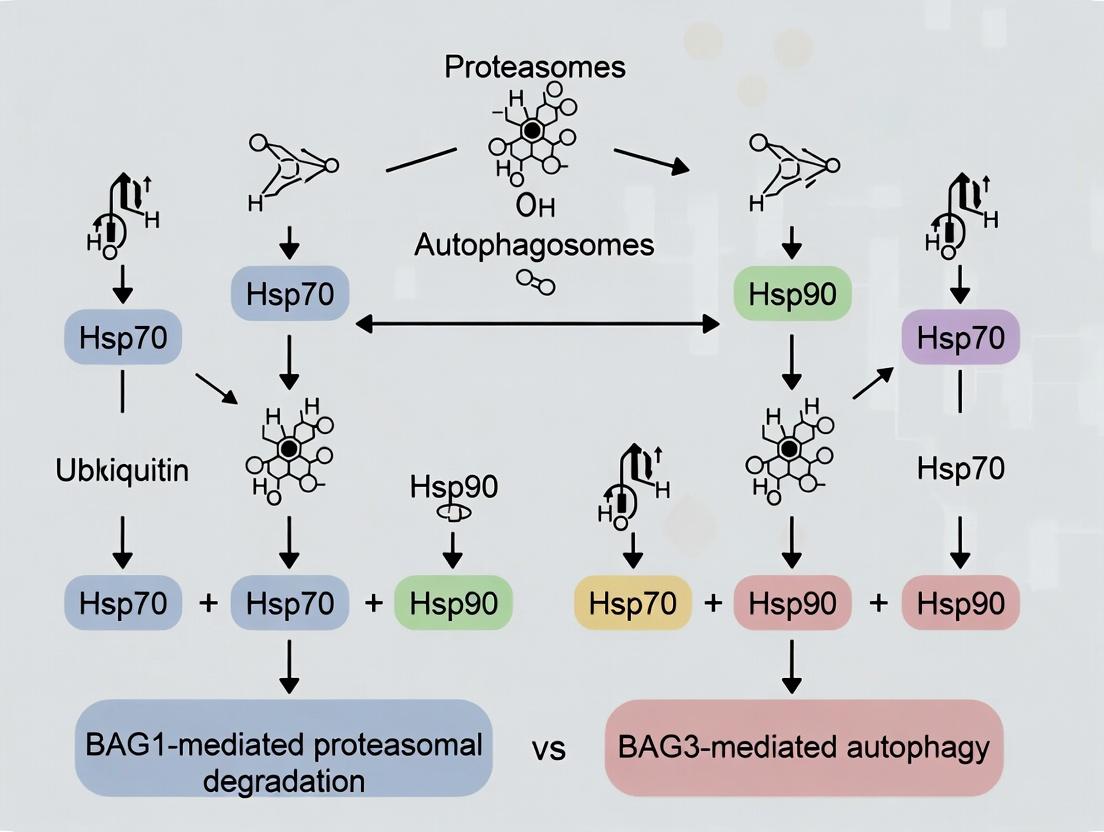
BAG domain proteins function as nucleotide exchange factors (NEFs) for the Hsp70 chaperone machine, directing client protein fate. The central thesis in the field contrasts the roles of BAG1 and BAG3, which channel Hsp70-bound clients toward divergent degradation pathways: the ubiquitin-proteasome system (UPS) versus selective autophagy, respectively. This guide compares the molecular mechanisms, functional outcomes, and experimental characterization of these two key BAG family members.
Performance Comparison: BAG1 vs. BAG3 as Hsp70 NEFs in Protein Degradation
Table 1: Functional Comparison of BAG1 and BAG3
| Feature | BAG1 | BAG3 | Experimental Evidence & Key References |
|---|---|---|---|
| Primary Degradation Pathway | Ubiquitin-Proteasome System (UPS) | Macroautophagy (specifically chaperone-assisted selective autophagy, CASA) | Co-immunoprecipitation shows BAG1 binds proteasomal subunit Rpn1; BAG3 interacts with p62/SQSTM1 and LC3. [Gamerdinger et al., 2009; Arndt et al., 2010] |
| Domain Architecture | Ubiquitin-like (UBL) domain, BAG domain | BAG domain, WW domains, IPV motifs, PXXP motif | Domain mapping by truncation mutants and binding assays. |
| Hsp70 Client Fate | Targets folded clients for proteasomal degradation. | Targets misfolded, aggregation-prone clients for autophagic encapsulation. | Fluorescence microscopy shows BAG1 clients co-localize with proteasomes; BAG3 clients co-localize with LC3-positive autophagosomes. |
| Stress Response | Constitutively expressed; decreased during cellular stress. | Strongly upregulated by heat shock, proteotoxic, and mechanical stress. | qPCR and immunoblotting show BAG3 induction >10-fold upon heat shock; BAG1 levels remain stable or decrease. |
| Key Binding Partners | Hsp70/Hsc70, Rpn1 (proteasome), CHIP (E3 ligase) | Hsp70/Hsc70, p62/SQSTM1, LC3, CHIP | Yeast two-hybrid and pull-down assays confirm specific interactions. |
| Effect on Aggregate Clearance | Limited efficacy against large aggregates. | Essential for clearance of protein aggregates (e.g., mutant Huntingtin, SOD1). | Filter trap assay and Sarkosyl insolubility show BAG3 knockdown increases aggregate load by ~70%. |
| Cellular Phenotype upon Knockdown | Impaired degradation of short-lived regulatory proteins; can sensitize to apoptosis. | Accumulation of protein aggregates; increased susceptibility to proteotoxic stress; impaired cell motility. | siRNA knockdown reduces cell viability under stress by ~40% for BAG3 vs. ~15% for BAG1. |
Table 2: Quantitative Experimental Data from Key Studies
| Experiment Type | BAG1-Specific Results | BAG3-Specific Results | Assay Protocol Summary |
|---|---|---|---|
| Client Protein Half-Life | Reduces half-life of CFTRΔF508 by ~35% in conjunction with CHIP. | Increases half-life of hyperphosphorylated Tau, directing it to autophagy. | Pulse-chase analysis with 35S-Met/Cys labeling, immunoprecipitation, and phosphorimaging. |
| Aggregate Clearance Quantification | Minor effect on polyQ aggregate clearance (<20% reduction). | Knockdown reduces aggregate clearance by ~60-80% in HeLa cells expressing polyQ72. | Automated fluorescence microscopy of mCherry-polyQ aggregates, image analysis for puncta count/cell. |
| Stress Survival | Overexpression decreases survival after prolonged proteotoxic stress by ~25%. | Overexpression increases cell survival after heat shock (44°C, 1h) by ~50%. | Colony formation assay (clonogenic survival) post-stress. |
| Pathway Activity Reporter | Low activity with LC3-II turnover reporter. | High activity: increases LC3-II flux by ~3-fold under basal conditions. | Tandem mRFP-GFP-LC3 reporter assay via flow cytometry; GFP quenching in acidic autolysosomes indicates flux. |
Experimental Protocols for Key Comparative Assays
Protocol 1: Co-Immunoprecipitation (Co-IP) for BAG-Hsp70-Complex Analysis
- Purpose: Validate interaction between BAG proteins, Hsp70, and pathway-specific partners (e.g., Rpn1, p62).
- Method:
- Lyse HEK293T cells transfected with FLAG-tagged BAG1 or BAG3 in mild lysis buffer (e.g., 1% NP-40, 25 mM Tris-HCl pH 7.4, 150 mM NaCl, plus protease inhibitors).
- Pre-clear lysate with Protein A/G beads for 30 min at 4°C.
- Incubate supernatant with anti-FLAG M2 affinity gel for 2-4 hours at 4°C.
- Wash beads 4x with lysis buffer.
- Elute bound proteins with 3xFLAG peptide or 2X Laemmli buffer.
- Analyze by SDS-PAGE and immunoblotting for Hsp70, Rpn1, p62, and LC3.
Protocol 2: Tandem Fluorescent LC3 (mRFP-GFP-LC3) Flux Assay
- Purpose: Quantify autophagic flux specifically induced by BAG3 activity.
- Method:
- Seed cells in imaging dishes and transfect with mRFP-GFP-LC3 plasmid +/- BAG3/BAG1 expression vectors or siRNA.
- 48h post-transfection, treat cells as required (e.g., serum starvation, proteasome inhibitor MG132).
- Fix cells with 4% PFA for 15 min.
- Image using confocal microscopy. Yellow puncta (mRFP+GFP+) represent autophagosomes. Red-only puncta (mRFP+GFP-quenched) represent autolysosomes.
- Calculate autophagic flux as the ratio of red-only puncta to total (yellow+red) puncta per cell. BAG3 overexpression should significantly increase this ratio.
Protocol 3: Filter Trap Assay for Protein Aggregation
- Purpose: Measure the load of insoluble protein aggregates under BAG1/BAG3 modulation.
- Method:
- Lyse cells in Sarkosyl lysis buffer (1% Sarkosyl, 50 mM Tris pH 8.0, 150 mM NaCl, plus inhibitors) via sonication.
- Centrifuge at 16,000 x g for 10 min to separate soluble (supernatant) and insoluble (pellet) fractions.
- Resuspend pellet in 1% Sarkosyl buffer.
- Dilute samples and vacuum-filter through a cellulose acetate membrane (0.2 µm pore size), which traps aggregates.
- Wash membrane extensively with 0.1% Sarkosyl buffer.
- Immunoblot the membrane for the protein of interest (e.g., Huntingtin). Signal intensity correlates with aggregate load.
Signaling Pathway Diagrams
Title: BAG1-Hsp70 Pathway to Proteasomal Degradation
Title: BAG3-Hsp70 CASA Pathway to Autophagy
Title: Cellular Decision Between BAG1 and BAG3 Pathways
The Scientist's Toolkit: Key Research Reagent Solutions
Table 3: Essential Reagents for BAG Protein Research
| Reagent/Category | Specific Example(s) | Function in Research |
|---|---|---|
| Plasmids for Expression | pCMV-FLAG-BAG1, pCMV-HA-BAG3, GFP/mCherry-tagged BAG constructs, mRFP-GFP-LC3. | For overexpression, localization, and functional studies via transfection. |
| siRNA/shRNA Libraries | ON-TARGETplus Human BAG1/BAG3 siRNA SMARTpools, Mission shRNA plasmids. | For targeted knockdown to study loss-of-function phenotypes and pathway dependencies. |
| Antibodies for Detection | Anti-BAG1 (CST#7062), Anti-BAG3 (CST#8550), Anti-Hsp70/Hsc70 (CST#4872), Anti-LC3B (CST#3868), Anti-p62 (CST#23214). | For immunoblotting, immunofluorescence, and immunoprecipitation to visualize proteins and interactions. |
| Chemical Modulators | MG132 (proteasome inhibitor), Bafilomycin A1 (autophagy/lysosome inhibitor), VER-155008 (Hsp70 inhibitor). | To inhibit specific pathway components and probe functional relationships. |
| Pathway Reporters | Tandem fluorescent LC3 (ptfLC3), Proteasome activity probe (e.g., Me4BodipyFL-Ahx3Leu3VS), Ubiquitin cleavage sensors. | To quantitatively measure autophagic flux, proteasome activity, and ubiquitin dynamics in live or fixed cells. |
| Aggregation Reporters | Plasmids expressing polyQ-expanded Huntingtin (e.g., Htt-Q72-GFP), SOD1 mutants. | To model neurodegenerative disease-associated aggregation and test BAG protein efficacy in clearance. |
| Recombinant Proteins | Recombinant human Hsp70, BAG1/BAG3 GST-tagged proteins. | For in vitro nucleotide exchange assays, binding studies (SPR, ITC), and structural biology. |
BAG1 (Bcl-2-associated athanogene 1) serves as a critical nucleotide exchange factor (NEF) for Hsp70, directing Hsp70-bound client proteins toward the ubiquitin-proteasome system for degradation. This guide compares the isoforms, structural domains, and functional performance of BAG1 with its family member BAG3, within the thesis context of contrasting proteasomal degradation (BAG1) and autophagic clearance (BAG3) pathways.
Structural Isoforms and Domain Comparison
Table 1: BAG1 Isoforms and Key Domains
| Isoform | Length (aa) | Ubiquitin-Like (UBL) Domain | BAG Domain | Nuclear Localization Signal (NLS) | Primary Localization | Key Function |
|---|---|---|---|---|---|---|
| BAG1L (p50) | 345 | Yes | C-terminus | Strong | Nucleus | Channels nuclear clients to proteasome. |
| BAG1M (p46) | 274 | Yes | C-terminus | Weak | Cytoplasm/Nucleus | Main cytosolic linker to UPS. |
| BAG1S (p33) | 219 | No | C-terminus | No | Cytoplasm | Hsp70 regulation; anti-apoptosis. |
Table 2: Core Functional Comparison: BAG1 vs. BAG3
| Feature | BAG1 | BAG3 |
|---|---|---|
| Primary Degradation Pathway | Ubiquitin-Proteasome System (UPS) | Selective Macroautophagy |
| Hsp70 Interaction | BAG Domain (NEF activity) | BAG Domain (NEF activity) |
| Unique Targeting Domain | Ubiquitin-Like (UBL) Domain (binds 26S proteasome) | IPV motif (binds LC3 on autophagosomes) |
| Client Preference | Short-lived, misfolded nuclear/cytosolic proteins | Aggregation-prone, large cytoskeletal proteins |
| Stress Response | Downregulated under cellular stress | Upregulated under cellular stress (e.g., heat shock) |
| Effect on Client Lifespan | Decreases (promotes degradation) | Can increase (shuttles to autophagy for clearance) |
Performance Data from Key Experiments
Table 3: Experimental Data on Degradation Efficiency
| Experiment System | Target Protein | BAG1 Co-expression (Effect vs. Control) | BAG3 Co-expression (Effect vs. Control) | Key Measurement Method |
|---|---|---|---|---|
| HEK293T cells | Mutant p53 (R175H) | ~60% reduction in half-life | ~20% reduction in half-life | Cycloheximide chase, immunoblotting |
| In vitro reconstitution | Tau (P301L mutant) | Minimal effect on aggregates | ~70% clearance of aggregates | Filter trap assay, immunofluorescence |
| Cardiac myocytes | Phosphorylated Tau | Slight increase in soluble tau | ~50% reduction in insoluble tau | Fractionation + ELISA |
| MCF-7 cells | ERα (Ligand-bound) | ~40% increase in degradation rate | Stabilizes receptor; blocks degradation | Pulse-chase, ³⁵S labeling |
Detailed Experimental Protocols
Protocol 1: Cycloheximide Chase to Assess Protein Half-Life Objective: Measure the degradation kinetics of a client protein (e.g., mutant p53) upon BAG1 or BAG3 overexpression.
- Transfection: Seed HEK293T cells in 6-well plates. Transfect with plasmids for client protein and either BAG1, BAG3, or empty vector control.
- Inhibition of Translation: 24h post-transfection, add cycloheximide (100 µg/mL) to inhibit new protein synthesis.
- Time-Course Harvest: Lyse cells at time points (e.g., 0, 30, 60, 120, 240 min) after cycloheximide addition.
- Analysis: Perform SDS-PAGE and immunoblotting for the client protein and a loading control (e.g., Actin). Quantify band intensity.
- Calculation: Plot remaining protein (%) vs. time. Calculate half-life from exponential decay curve.
Protocol 2: Fractionation to Assess Soluble vs. Insoluble Protein Aggregates Objective: Evaluate BAG1 vs. BAG3 efficacy in clearing aggregation-prone proteins (e.g., Tau).
- Cell Treatment: Treat stably transfected cells (expressing mutant Tau) to induce stress (e.g., proteasomal inhibition with MG132 for BAG3 induction).
- Harvest & Lysis: Lyse cells in mild detergent buffer (1% Triton X-100 in TBS + protease inhibitors) on ice for 30 min.
- Centrifugation: Centrifuge at 100,000 x g for 30 min at 4°C.
- Separation: The supernatant contains the Triton-soluble fraction. Resuspend the pellet in SDS-Urea buffer (2% SDS, 8M Urea) to obtain the Triton-insoluble (aggregate) fraction.
- Detection: Analyze equal proportions of each fraction by immunoblotting for the target protein.
Key Signaling Pathways
Title: BAG1-Mediated Client Targeting to the Ubiquitin-Proteasome System
Title: BAG3-Mediated Selective Autophagy Pathway
The Scientist's Toolkit: Research Reagent Solutions
Table 4: Essential Reagents for BAG1/BAG3 Functional Studies
| Reagent/Material | Function in Research | Example Product/Catalog # |
|---|---|---|
| Anti-BAG1 Antibody | Immunoblotting, immunofluorescence to detect BAG1 isoforms. | Abcam, ab79423 (mouse monoclonal). |
| Anti-BAG3 Antibody | Differentiate BAG3 expression from BAG1 in stress conditions. | Cell Signaling, 8550S (rabbit monoclonal). |
| Hsp70/Hsc70 Inhibitor (VER-155008) | Blocks Hsp70 ATPase activity to dissect BAG domain dependency. | Tocris, 3803. |
| Proteasome Inhibitor (MG132) | Inhibits 26S proteasome to validate UPS-dependent BAG1 function. | Sigma-Aldrich, C2211. |
| Autophagy Inhibitor (Bafilomycin A1) | Blocks autolysosome formation to confirm BAG3-autophagy pathway. | Cayman Chemical, 11038. |
| Cycloheximide | Protein synthesis inhibitor for chase experiments to measure half-life. | Sigma-Aldrich, C7698. |
| pCMV-HA-BAG1 Plasmid | Mammalian expression vector for BAG1 overexpression studies. | Addgene, plasmid # 22598. |
| pEGFP-LC3 Plasmid | Marker for autophagosome formation in BAG3 co-localization studies. | Addgene, plasmid # 11546. |
| Triton X-100 Soluble/Insoluble Fractionation Kit | Isolate protein aggregates for BAG3 functional assays. | Millipore, 17-10494. |
| Human BAG1 Recombinant Protein | For in vitro NEF activity assays with Hsp70. | ProSpec, PROT-236. |
Within the comparative research landscape of BAG1-mediated proteasomal degradation versus BAG3-mediated selective autophagy, understanding BAG3's unique structural architecture is paramount. Unlike BAG1, which primarily channels clients to the proteasome via its ubiquitin-like domain, BAG3 employs a distinct multi-domain scaffold to coordinate the autophagy of misfolded proteins and the maintenance of the cellular cytoskeleton, particularly under stress conditions. This guide compares the functional performance of BAG3's domains with alternative protein interaction motifs and scaffolds.
Comparative Analysis of BAG3 Domains vs. Alternative Structural Motifs
Table 1: Comparison of BAG3 Domain Functions with Alternative Proteins/Pathways
| BAG3 Domain/Function | Key Alternative/Comparator | Experimental Readout | Performance Data (BAG3 vs. Alternative) | Implication for Autophagy-Cytoskeleton Coordination |
|---|---|---|---|---|
| BAG Domain (Hsp70/Hsc70 Interaction) | BAG1's BAG Domain | Co-IP with Hsc70, ATPase activity assay | BAG3 Kd ~120 nM; BAG1 Kd ~90 nM (similar affinity). BAG3 interaction promotes pro-autophagy client release. | BAG3 directs Hsc70 clients to autophagy, not proteasome. |
| IPV Motif (Binding to HspB8) | Other sHSP interactors (e.g., HspB1) | Fluorescence Polarization, Complex Stability Assay | BAG3-HspB8 complex withstands >1.5M urea; alternative complexes dissociate at <1.0M urea. | Enables selective recognition of misfolded clients for autophagic targeting. |
| PxxP Regions (Binding to SH3 domains of cytoskeletal regulators) | Direct actin-binding proteins (e.g., Cofilin) | Pulldown assay with Cytochalasin D treatment | BAG3 recruits >60% of SH3-domain proteins (like PLCγ) to detergent-insoluble fraction vs. <20% for direct binders. | Provides a dynamic scaffold linking protein aggregates to the cytoskeleton for transport. |
| WW Domain (Binding to LIR adapters like p62/SQSTM1) | Other LIR-containing proteins (e.g., NBR1) | Yeast Two-Hybrid, LC3-II co-sedimentation assay | BAG3 WW domain binds p62 with 3x higher affinity than NBR1 under simulated stress (37°C, 10% FBS depletion). | Efficiently bridges Hsc70-client complexes to the core autophagy machinery. |
Detailed Experimental Protocols
Protocol 1: Co-Immunoprecipitation (Co-IP) for BAG3-Hsc70-HspB8 Complex Assembly
Objective: To assess the stability and composition of the BAG3-mediated triage complex compared to BAG1 complexes. Methodology:
- Transfection: HEK293T cells are transfected with plasmids encoding FLAG-tagged BAG3 (or BAG1 as control) and HA-tagged HspB8.
- Cell Lysis: 48h post-transfection, lyse cells in mild NP-40 lysis buffer (50 mM Tris-HCl pH 7.5, 150 mM NaCl, 1% NP-40, protease inhibitors) to preserve protein interactions.
- Immunoprecipitation: Incubate cleared lysates with anti-FLAG M2 affinity gel for 4h at 4°C.
- Washing: Wash beads 5x with lysis buffer.
- Elution & Analysis: Elute proteins with 3xFLAG peptide. Analyze eluates and total lysates by SDS-PAGE and western blot using anti-HA (HspB8), anti-Hsc70, and anti-FLAG antibodies. Key Control: Include cells treated with autophagy inducer (e.g., 10 μM MG-132 + 50 μM Chloroquine) to examine stress-induced complex formation.
Protocol 2: Quantitative Imaging of Aggresome Displacement
Objective: To quantify BAG3's role in coupling misfolded protein aggregates to the microtubule network for autophagic clearance vs. BAG1's proteasomal targeting. Methodology:
- Cell Line & Treatment: U2OS cells stably expressing GFP-tagged aggregation-prone protein (e.g., ΔF508-CFTR) are treated with proteasome inhibitor (5 μM MG-132) for 6h to induce aggressomes.
- Knockdown/Overexpression: Use siRNA against BAG3 or BAG1, or overexpress mutant BAG3 (ΔPxxP).
- Staining & Imaging: Fix cells, stain for tubulin (anti-α-tubulin, Cy3) and DAPI. Use high-content confocal microscopy.
- Quantification: Measure the Pearson's correlation coefficient between the GFP-aggregate signal and the microtubule network in a perinuclear region (2μm radius around centrosome). A higher coefficient indicates better cytoskeletal coupling.
- Autophagic Flux Correlation: Co-treat cells with 100 nM Bafilomycin A1 for 2h prior to fixation, stain for LC3B, and correlate aggregate-microtubule co-localization with LC3 puncta count.
The Scientist's Toolkit: Key Research Reagent Solutions
Table 2: Essential Materials for BAG3/Autophagy-Cytoskeleton Research
| Reagent/Material | Supplier Examples | Function in Experimentation |
|---|---|---|
| Anti-BAG3 Antibody (monoclonal, for IP) | Abcam (ab47124), Proteintech | Immunoprecipitation of endogenous BAG3 complexes. |
| FLAG-M2 Affinity Gel | Sigma-Aldrich | Purification of FLAG-tagged BAG3/BAG1 and associated proteins. |
| HspB8 Recombinant Protein | Novus Biologicals, OriGene | In vitro binding assays to map IPV motif interactions. |
| p62/SQSTM1 LIR Mutant Plasmid | Addgene (plasmid # 72833) | Negative control for WW domain interaction studies. |
| Cell Line: U2OS-GFP-LC3 | MilliporeSigma | Quantitative imaging of autophagosome formation in response to BAG3 activity. |
| Microtubule Disruptor (Nocodazole) | Tocris Bioscience | Tool to dissect BAG3's reliance on intact microtubules for aggregate transport. |
| ATPase/GTPase Activity Assay Kit | Promega (CellTiter-Glo) | Measure Hsc70 ATPase activity modulation by BAG domains. |
BAG3-Mediated Selective Autophagy Pathway
Diagram Title: BAG3 scaffolds autophagy machinery and cytoskeleton.
Experimental Workflow for BAG3 vs. BAG1 Functional Comparison
Diagram Title: Workflow to compare BAG3 autophagy and BAG1 proteasome pathways.
Within the cellular proteostasis network, the fate of Hsp70-bound client proteins is decisively controlled by specific BAG (Bcl-2-associated athanogene) domain co-chaperones. This guide compares the functional outcomes driven by BAG1 and BAG3, framing their roles within the thesis of BAG1-mediated targeting to the proteasome versus BAG3-mediated routing to autophagy. The nucleotide exchange factor (NEF) activity of BAG proteins is the central mechanistic switch determining this fate.
Comparative Guide: BAG1 vs. BAG3 as Hsp70 NEFs
Functional Comparison Table
| Parameter | BAG1 | BAG3 |
|---|---|---|
| Primary Cellular Fate | Proteasomal Degradation | Autophagic (Macroautophagy) Clearance |
| Domain Structure | Ubiquitin-like (UBL) domain, BAG domain | WW domains, PxxP motifs, BAG domain, IPV motif |
| Hsp70 NEF Activity | Rapid ADP release, promotes client transfer to proteasome | Rapid ADP release, promotes client sequestration in autophagosomes |
| Client Specificity | Misfolded/damaged soluble proteins, regulatory proteins (e.g., steroid receptors) | Aggregation-prone proteins, misfolded proteins under stress (e.g., Huntingtin, SOD1) |
| Stress Response | Constitutively active | Strongly upregulated by heat shock, proteotoxic stress |
| Binding Partners | Proteasome 19S cap (via UBL), Hsp70/Hsc70 (via BAG) | LC3/GABARAP (via LIR-like motif in IPV region), Hsp70 (via BAG), CHIP |
| Key Functional Readout | Decrease in client half-life, increased polyubiquitination | Accumulation of client in p62/SQSTM1-positive puncta, colocalization with LC3 |
| Experiment | BAG1-KO/KD Outcome | BAG3-KO/KD Outcome | Supporting Data (Typical Values) |
|---|---|---|---|
| Client Protein Turnover (Half-life) | Increased half-life of model clients (e.g., Tau, GR) | Increased half-life of aggregation-prone clients | BAG1-OE: Tau t1/2 ↓ ~40%; BAG3-OE: Tau t1/2 unchanged but solubility ↑ |
| Aggregate Clearance | Minor effect | Significant inhibition; aggregate load ↑ 2-3 fold | BAG3-KO: polyQ aggregates ↑ 150-200% vs. control |
| Autophagic Flux (LC3-II ratio) | No direct effect | Markedly reduced LC3-II turnover; flux ↓ ~60-70% | BAG3-KO: LC3-II/p62 ratio ↑ (blockade), Bafilomycin A1 sensitivity lost |
| Cell Viability under Proteotoxic Stress | Sensitive to proteasome inhibition | Highly sensitive to prolonged stress; viability ↓ ~50% | BAG3-KD + Heat Shock: survival ↓ 45% vs. control |
| Ubiquitin Conjugate Levels | Accumulation of high-MW ubiquitin conjugates | Accumulation of ubiquitinated proteins in insoluble fraction | BAG1-KO: soluble ubiquitin conjugates ↑ 2.5 fold |
Experimental Protocols
Protocol 1: Co-immunoprecipitation for BAG-Hsp70-Client Complex Analysis
Objective: To assess the formation of ternary complexes between BAG1/BAG3, Hsp70, and a specific client protein.
- Transfection: Co-transfect HEK293T cells with plasmids expressing FLAG-tagged client (e.g., mutant Tau), Myc-Hsp70, and either HA-BAG1 or HA-BAG3.
- Lysis: After 48h, lyse cells in mild lysis buffer (50 mM Tris-HCl pH 7.4, 150 mM NaCl, 1% NP-40, protease inhibitors) to preserve weak interactions.
- Immunoprecipitation: Incubate cleared lysate with anti-FLAG M2 affinity gel for 2h at 4°C.
- Washing: Wash beads 3x with lysis buffer.
- Elution & Analysis: Elute bound proteins with FLAG peptide or 2X Laemmli buffer. Analyze by SDS-PAGE and immunoblotting for FLAG (client), Myc (Hsp70), and HA (BAG1/BAG3).
Protocol 2: In Vitro Nucleotide Exchange Assay
Objective: To directly compare the NEF activity of purified BAG1 and BAG3 proteins on Hsp70.
- Protein Purification: Purify recombinant human Hsp70 (HSPA1A), BAG1, and BAG3 proteins.
- Hsp70 Charging: Incubate Hsp70 (2 µM) with excess mant-ADP (10 µM) in assay buffer (40 mM HEPES-KOH pH 7.6, 50 mM KCl, 5 mM MgCl2) for 15 min at 25°C.
- Nucleotide Exchange: Add a large excess of unlabeled ATP (1 mM) to initiate exchange. Simultaneously, add either BAG1 or BAG3 (0.2 µM) to the reaction.
- Real-Time Monitoring: Measure the decrease in mant-ADP fluorescence (excitation 355 nm, emission 448 nm) immediately after ATP addition using a fluorometer.
- Data Analysis: Fit the fluorescence decay curve to a single exponential. The rate constant (k) represents the nucleotide exchange rate promoted by the BAG protein.
Protocol 3: Client Fate Assay (Aggregation vs. Degradation)
Objective: To visualize and quantify the differential routing of a misfolded client.
- Cell Line & Treatment: Seed stable HEK293 cells expressing GFP-tagged aggregation-prone client (e.g., Huntingtin-Q74) into 4-chamber slides.
- Knockdown/Overexpression: Transfect with siRNA targeting BAG1 or BAG3, or corresponding overexpression plasmids.
- Stress Induction: Treat cells with proteasome inhibitor (MG132, 10 µM) or autophagy inducer (Rapamycin, 1 µM) for 12-16h.
- Fixation & Staining: Fix cells, permeabilize, and immunostain for proteasome subunits (e.g., Rpt1) and autophagy markers (LC3).
- Imaging & Quantification: Perform confocal microscopy. Quantify the co-localization coefficient of GFP-client with LC3 puncta (autophagy) vs. proteasomal clusters.
Visualizations
Diagram 1: BAG1 vs. BAG3 Pathway Decision Logic
Title: Decision Logic of Hsp70 Client Fate via BAG1 or BAG3
Diagram 2: Key Experimental Workflow for Fate Determination
Title: Experimental Workflow for Client Fate Assay
The Scientist's Toolkit: Research Reagent Solutions
| Reagent/Material | Function/Application | Example Product/Catalog # |
|---|---|---|
| Recombinant Human BAG1/BAG3 | Purified protein for in vitro NEF assays, crystallization, or adding back to cell-free systems. | Sino Biological (e.g., 11824-H07E) |
| Hsp70/Hsc70 Inhibitor (VER-155008) | ATP-competitive inhibitor to block Hsp70 activity as a control in fate determination assays. | Tocris Bioscience (3803) |
| BAG1/BAG3 siRNAs | Targeted knockdown to deplete specific BAG protein and observe effects on client processing. | Dharmacon SMARTpools |
| Tandem Fluorescent LC3 Reporter (mRFP-GFP-LC3) | Autophagic flux sensor; distinguishes autophagosomes (yellow) from autolysosomes (red only). | Addgene (21074) |
| Proteasome Activity Probe (MV151) | Cell-permeable fluorescent probe to label active proteasome particles for imaging co-localization. | Bio-Techne (3994) |
| Hsp70 ATPase/NEF Activity Assay Kit | Coupled enzymatic assay to measure Hsp70 ATPase cycle parameters in presence of BAG proteins. | ENZO Life Sciences (ADI-900-214) |
| Anti-BAG1/BAG3 Antibodies (ChIP-grade) | For immunoprecipitation, Western blotting, and immunofluorescence of endogenous proteins. | Cell Signaling Technology (CST) |
| Aggresome Detection Kit | Dye-based kit to identify perinuclear aggressomes, relevant for BAG3-mediated autophagy targets. | MilliporeSigma (CYTO-ID) |
Comparison Guide: BAG1-Mediated Proteasomal Targeting vs. BAG3-Mediated Autophagy
BAG proteins function as nucleotide exchange factors for Hsp70/Hsc70, but different isoforms direct client fate toward distinct pathways. BAG1 promotes proteasomal degradation of polyubiquitinated clients, while BAG3 facilitates autophagic clearance of aggregated proteins. This guide compares the mechanisms, performance, and experimental data.
Table 1: Core Functional Comparison of BAG1 and BAG3 Pathways
| Feature | BAG1-Mediated Proteasomal Degradation | BAG3-Mediated Macroautophagy |
|---|---|---|
| Primary Cellular Role | Rapid turnover of soluble, misfolded, or regulatory proteins. | Clearance of large, aggregated, or oligomeric proteins and organelles. |
| Key Client Type | Polyubiquitinated substrates (e.g., steroid hormone receptors, misfolded cytosolic proteins). | Aggregated, ubiquitinated proteins (e.g., mutant huntingtin, damaged proteins under stress). |
| Complex Association | BAG1-UBA domain binds 26S proteasome; BAG domain recruits Hsc70-bound client. | BAG3 PXXP domain binds synaptonemal complex protein (SCYP); IPV motifs bind LC3 on autophagosome. |
| Degradation Machinery | 26S Proteasome. | Autophagosome-Lysosome. |
| Kinetics | Fast (minutes to hours). | Slower (hours). |
| Stress Response | Often downregulated during cellular stress (e.g., heat shock). | Strongly upregulated during cellular stress (e.g., proteotoxic, oxidative). |
| Key Experiment Outcome | Co-expression of BAG1 increases client degradation rate, blocked by MG132 proteasome inhibitor. | Co-expression of BAG3 increases client clearance, blocked by bafilomycin A1 or 3-MA autophagy inhibitors. |
Table 2: Supporting Experimental Data from Key Studies
| Experimental Readout | BAG1 Pathway Data (Example: GR Degradation) | BAG3 Pathway Data (Example: Mutant HTT Clearance) |
|---|---|---|
| Degradation Half-life | Reduced by ~50% when co-expressed with BAG1S (from ~8h to ~4h). | Increased aggregate clearance by ~70% over 24h when co-expressed with BAG3. |
| Inhibition Assay | MG132 (10 µM, 6h) restores client levels by >80% in BAG1-expressing cells. | Bafilomycin A1 (100 nM, 6h) reduces clearance by >60% in BAG3-expressing cells. |
| Binding Affinity (Kd) | BAG1 UBA domain to K48-polyUb chains: ~2-10 µM. | BAG3 IPV motif to LC3: ~0.5-3 µM. |
| Genetic Knockdown Effect | siRNA vs. BAG1 increases steady-state levels of clients (e.g., ERα) by 2-3 fold. | siRNA vs. BAG3 leads to ~40% increase in aggregate load under stress. |
Experimental Protocols
Protocol 1: Measuring BAG1-Dependent Proteasomal Degradation (Cycloheximide Chase)
- Transfection: Seed HEK293T cells in 12-well plates. Transfect with plasmids expressing the client protein (e.g., glucocorticoid receptor, GR) and HA-tagged BAG1S using a standard PEI method.
- Inhibition: 24h post-transfection, add cycloheximide (100 µg/mL) to halt new protein synthesis. For the proteasome inhibition control, pre-treat a set of wells with MG132 (10 µM) for 30 min before adding cycloheximide.
- Harvest: Lyse cells at defined time points (e.g., 0, 2, 4, 8h) in RIPA buffer supplemented with protease inhibitors and N-ethylmaleimide (to inhibit deubiquitinases).
- Analysis: Resolve proteins by SDS-PAGE. Perform immunoblotting for the client protein and a loading control (e.g., β-actin). Quantify band intensity to determine degradation half-life.
Protocol 2: Differentiating BAG1 vs. BAG3 Pathway Dependence (Pharmacological Inhibition)
- Setup: Generate stable cell lines expressing a fluorescently tagged aggregate-prone protein (e.g., GFP-tagged HttQ74).
- Transfection & Induction: Transfect cells with BAG1 or BAG3 expression plasmids. Induce stress (e.g., 42°C heat shock for 1h) to promote client accumulation.
- Inhibition: Treat cells with pathway-specific inhibitors for 6-8h:
- Proteasome pathway: MG132 (10 µM).
- Autophagy pathway: Bafilomycin A1 (100 nM).
- Control: DMSO vehicle.
- Quantification: Harvest cells. Analyze client clearance via:
- Immunoblot: Measure soluble vs. insoluble protein fractions.
- Flow Cytometry: Quantify GFP-positive aggregates per cell.
- Microscopy: Perform high-content imaging to count aggregates.
Signaling Pathway and Workflow Diagrams
Title: BAG1's Canonical Pathway to the Proteasome
Title: Client Fate Decision: BAG1 vs. BAG3 Pathway
Title: BAG1/BAG3 Pathway Inhibition Assay Workflow
The Scientist's Toolkit: Key Research Reagent Solutions
Table 3: Essential Reagents for Studying BAG-Mediated Protein Degradation
| Reagent | Supplier Examples (for research) | Function in Experiment |
|---|---|---|
| MG132 (Proteasome Inhibitor) | Selleckchem, Sigma-Aldrich, MedChemExpress | Blocks the 26S proteasome's chymotrypsin-like activity; validates BAG1-proteasome pathway dependence. |
| Bafilomycin A1 (V-ATPase Inhibitor) | Sigma-Aldrich, Cayman Chemical | Inhibits autophagosome-lysosome fusion by blocking lysosomal acidification; validates autophagic flux/BAG3 pathway. |
| Cycloheximide (Protein Synthesis Inhibitor) | Sigma-Aldrich, Tocris | Halts cytosolic translation; used in chase experiments to measure protein degradation half-life. |
| HA- or FLAG-tagged BAG1/BAG3 Plasmids | Addgene, Origene, custom synthesis | Ectopic expression of tagged proteins for pull-down assays, localization, and overexpression phenotype studies. |
| siRNA/shRNA targeting BAG1 or BAG3 | Dharmacon, Sigma-Aldrich, Santa Cruz Biotechnology | Knockdown of endogenous protein to assess loss-of-function effects on client stability and aggregation. |
| Anti-K48-linkage Specific Ubiquitin Antibody | Millipore, Cell Signaling Technology | Detects K48-polyUb chains, the canonical signal for proteasomal targeting, in immunoprecipitation or blotting. |
| Anti-LC3B Antibody | Novus Biologicals, Cell Signaling Technology | Marker for autophagosomes (LC3-II form); essential for monitoring autophagic activity in BAG3 studies. |
| Proteasome Activity Assay Kit (Chymotrypsin-like) | BioVision, Abcam, Enzo Life Sciences | Fluorogenic substrate-based kit to measure proteasome activity in cell lysates upon BAG1 modulation. |
Within the cellular proteostasis network, the BAG (Bcl-2-associated athanogene) family proteins serve as critical adaptors directing client proteins to distinct degradation fates. This guide compares the BAG3-mediated selective autophagy pathway to its primary alternative, BAG1-mediated proteasomal degradation, and to other autophagy adaptors. BAG1, through its ubiquitin-like domain, channels polyubiquitinated clients to the proteasome, favoring rapid degradation of soluble, short-lived proteins. In contrast, BAG3, induced under cellular stress, recruits a complex involving Hsp70, CHIP, and the autophagic receptor p62/SQSTM1 to sequester ubiquitinated, misfolded, and aggregation-prone clients into autophagosomes via LC3 interaction, targeting them for lysosomal degradation. This comparison is central to understanding stress-responsive proteostasis and has implications for diseases of protein aggregation.
Comparative Performance: BAG3-Mediated Autophagy vs. Alternative Pathways
Table 1: Core Functional Comparison: BAG3 vs. BAG1 Pathways
| Feature | BAG3-Mediated Macroautophagy | BAG1-Mediated Proteasomal Degradation | Experimental Evidence Key Metrics |
|---|---|---|---|
| Primary Degradation Organelle | Lysosome (via autophagosome) | 26S Proteasome | Immunofluorescence co-localization with LAMP1 (BAG3) vs. proteasome subunits (BAG1). |
| Key Adaptor/Receptor | p62/SQSTM1 (binds LC3 & ubiquitin) | Ubiquitin-like (UBL) domain (binds proteasome) | Co-immunoprecipitation efficiency: BAG3-p62 interaction increases >5-fold under stress (e.g., heat shock). |
| Client Preference | Aggregation-prone, large oligomers, damaged organelles (e.g., ubiquitinated proteins, mutant Huntingtin, damaged mitochondria). | Soluble, misfolded, short-lived proteins (e.g., regulatory proteins, lightly ubiquitinated clients). | Fractionation assays: BAG3 clients predominantly in insoluble fraction; BAG1 clients in soluble fraction. |
| Stress Induction | Upregulated under cellular stress (heat, proteotoxic, oxidative). | Constitutively active; may be downregulated under severe stress. | qPCR/Western blot: BAG3 protein levels increase 3-8 fold post-stress; BAG1 levels remain stable or decrease. |
| Degradation Kinetics | Slower, bulk turnover (hours). | Faster, precise turnover (minutes). | Cycloheximide chase assays: Half-life of model client (mutant SOD1) with BAG3: ~4-6h; with BAG1: ~0.5-1h. |
| Pharmacological Inhibition | Sensitive to lysosomal inhibitors (Bafilomycin A1: >80% inhibition of clearance). | Sensitive to proteasome inhibitors (MG132: >90% inhibition of clearance). | Clearance assay readout: Luminescent/fluorescent reporter flux. |
Table 2: Comparison of BAG3/p62 vs. Other Selective Autophagy Receptors
| Receptor | Primary Cargo Recognition | LC3-Interacting Region (LIR) Motif | Relative Efficiency in BAG3 Pathway Cooperation | Key Differentiating Data |
|---|---|---|---|---|
| p62/SQSTM1 | Polyubiquitin chains (K63-linked preferred). | Canonical LIR, phosphorylatable (e.g., by TBK1). | Essential. Direct BAG3 complex binding. | siRNA against p62 reduces BAG3-mediated client clearance by 70-80%. |
| NBR1 | Polyubiquitin, specific proteins. | Canonical LIR. | Moderate. Can partially compensate for p62 loss. | Double p62/NBR1 knockout abolishes BAG3-client sequestration >95%. |
| OPTN (Optineurin) | Polyubiquitin (especially M1/K63), damaged mitochondria. | Phosphorylatable LIR (by TBK1). | Low/Context-dependent. Enhances mitochondrial cargo. | Contributes <15% to general BAG3-p62 pathway flux in most studied models. |
| TAX1BP1 | Polyubiquitin. | Canonical LIR. | Low. Auxiliary role. | Knockdown has minimal effect (<10% reduction) on BAG3-mediated FLT3-ITD degradation. |
Experimental Protocols for Key Comparisons
Protocol 1: Assessing Client Sequestration into Autophagosomes
Objective: Quantify co-localization of a ubiquitinated client protein with LC3-positive puncta in a BAG3-dependent manner. Methodology:
- Cell Culture & Transfection: Seed HEK293 or HeLa cells in imaging dishes. Co-transfect plasmids expressing a model client (e.g., mutant Huntingtin-Q74-GFP), mRFP-LC3, and either BAG3 siRNA or overexpression vector.
- Stress Induction: Treat cells with 40µM proteasome inhibitor (MG132) for 6 hours or subject to heat shock (42°C, 1 hour) to induce BAG3 pathway.
- Fixation & Imaging: Fix cells with 4% PFA, permeabilize with 0.1% Triton X-100. Image using high-resolution confocal microscopy.
- Quantitative Analysis: Use image analysis software (e.g., ImageJ) to calculate Manders' overlap coefficient between the client (GFP channel) and autophagosomes (mRFP-LC3 channel) in ≥50 cells per condition. Statistical significance tested via Student's t-test.
Protocol 2: Co-immunoprecipitation of the BAG3-p62-LC3 Complex
Objective: Demonstrate the physical interaction between BAG3, p62, and LC3 under autophagy-inducing conditions. Methodology:
- Cell Lysis: Harvest cells (control vs. starved in EBSS for 2h) in mild lysis buffer (e.g., 1% CHAPS, 40mM HEPES pH7.4, 120mM NaCl) supplemented with protease/phosphatase inhibitors.
- Immunoprecipitation: Incubate 500µg of total protein lysate with 2µg of anti-BAG3 antibody or IgG control overnight at 4°C. Capture complexes with Protein A/G beads.
- Western Blot Analysis: Elute proteins, separate by SDS-PAGE, and transfer to PVDF membrane. Probe sequentially with antibodies against BAG3, p62, and LC3-II.
- Data Normalization: Densitometry analysis of bands. Report p62 and LC3-II co-IP signal normalized to immunoprecipitated BAG3 levels.
Pathway Diagrams
Title: BAG3-Mediated Selective Autophagy Client Sequestration Pathway
Title: Experimental Workflow for BAG1 vs BAG3 Pathway Comparison
The Scientist's Toolkit: Key Research Reagent Solutions
Table 3: Essential Reagents for Studying BAG3 Macroautophagy Pathway
| Reagent/Category | Example Product(s) | Function in Experiment | Critical Application Note |
|---|---|---|---|
| BAG3 Modulators | BAG3 siRNA (human, mouse); BAG3 overexpression plasmid (WT, ΔBAG domain); Recombinant BAG3 protein. | To knockdown, overexpress, or provide exogenous BAG3 function. | Validate siRNA off-target effects with rescue experiments using siRNA-resistant plasmid. |
| Autophagy Reporters | mRFP-GFP-LC3 tandem reporter (ptfLC3); mCherry-LC3 plasmid; GFP-p62 plasmid. | To monitor autophagosome formation and fusion with lysosomes (RFP-only signal indicates acidification). | Use with lysosomal inhibitors (Bafilomycin A1) to block flux and quantify accumulation. |
| Pathway Inhibitors/Inducers | Bafilomycin A1 (lysosome inhibitor); MG132 (proteasome inhibitor); Torin 1 (autophagy inducer via mTOR inhibition); Spermidine (autophagy inducer). | To chemically perturb specific steps in degradation pathways for functional validation. | Titrate dose and time carefully; MG132 can indirectly induce autophagy via proteotoxic stress. |
| Selective Autophagy Receptors | p62/SQSTM1 knockout cell line (e.g., HeLa); siRNA pools for NBR1, OPTN, TAX1BP1; Phospho-p62 (S403) antibody. | To dissect the specific role of p62 vs. other receptors in the BAG3 pathway. | Confirm knockout/knockdown efficiency by Western blot. Phospho-antibody indicates activated p62. |
| Client Proteins | Plasmids expressing ubiquitin, mutant Huntingtin (Htt-Q74), mutant SOD1, FLT3-ITD, α-synuclein (A53T). | Model substrates to track pathway-specific degradation. | Characterize the ubiquitination status (linkage type) of your chosen client, as it influences receptor choice. |
| Key Antibodies | Anti-BAG3, Anti-p62, Anti-LC3B (for LC3-I/II shift), Anti-Ubiquitin (K63-linkage specific), Anti-Hsp70, Anti-CHIP. | For Western blot, immunofluorescence, and co-immunoprecipitation assays. | For LC3 blot, use fresh samples and avoid excessive boiling to prevent LC3-II degradation. |
Transcriptional and Post-Translational Regulation of BAG1 and BAG3 Expression
Within the context of BAG1-mediated proteasomal degradation versus BAG3-mediated autophagy, understanding the differential regulation of BAG1 and BAG3 expression is critical. This guide compares the molecular mechanisms governing their expression, supported by experimental data, to inform research and therapeutic targeting.
Transcriptional Regulation Comparison
Table 1: Transcriptional Regulators of BAG1 and BAG3
| Regulator | Target Gene | Effect on Expression | Experimental Evidence (Key Assay) | Reference Context |
|---|---|---|---|---|
| HSF1 | BAG1 | Upregulation | Luciferase reporter, ChIP-qPCR | Proteotoxic stress |
| HSF1 | BAG3 | Upregulation | Luciferase reporter, ChIP-qPCR | Proteotoxic stress |
| p53 | BAG1 | Repression | EMSA, Promoter deletion analysis | Genotoxic stress |
| WT1 | BAG3 | Upregulation | siRNA knockdown, RT-qPCR | Development, Cancer |
| NF-κB | BAG3 | Upregulation | Inhibitor (BAY 11-7082), Luciferase assay | Inflammation, Cancer |
Experimental Protocol: Chromatin Immunoprecipitation Quantitative PCR (ChIP-qPCR) for HSF1 Binding
- Crosslinking: Treat cells (e.g., HEK293) with 1% formaldehyde for 10 min at room temperature to fix protein-DNA interactions.
- Cell Lysis & Sonication: Lyse cells and sonicate chromatin to shear DNA into 200-1000 bp fragments.
- Immunoprecipitation: Incubate lysate with antibody against HSF1 or control IgG overnight at 4°C. Capture complexes with protein A/G beads.
- Washing & Elution: Wash beads sequentially with low salt, high salt, LiCl, and TE buffers. Elute immune complexes.
- Reverse Crosslinking & Purification: Incubate eluates at 65°C overnight with NaCl to reverse crosslinks. Digest RNA with RNase A and protein with Proteinase K. Purify DNA.
- qPCR Analysis: Perform qPCR using primers specific for the HSE (Heat Shock Element) regions in the BAG1 and BAG3 promoters. Calculate enrichment relative to input and IgG control.
Title: Transcriptional Regulation Network of BAG1 and BAG3
Post-Translational Regulation and Protein Stability
Table 2: Post-Translational Modifications Impacting BAG1/B3 Stability
| Protein | Modification | Enzyme | Functional Outcome | Key Experimental Method |
|---|---|---|---|---|
| BAG1 | Phosphorylation | CK2 | Stabilizes, enhances Hsc70 binding | In vitro kinase assay, Cycloheximide chase |
| BAG3 | Phosphorylation | ERK1/2 | Promotes interaction with 14-3-3ζ, stabilizes | Phos-tag SDS-PAGE, Co-IP, siRNA knockdown |
| BAG3 | Ubiquitination | CHIP (Stub1) | Promotes proteasomal degradation (under basal conditions) | Ubiquitin pulldown, Proteasome inhibitor (MG132) assay |
| BAG3 | Acetylation | p300/CBP | Increases stability, promotes autophagy | Acetyl-lysine IP, HDAC inhibitor (TSA) treatment |
Experimental Protocol: Cycloheximide Chase Assay for Protein Half-Life
- Inhibition of Translation: Treat cells with cycloheximide (100 µg/mL) to halt new protein synthesis.
- Time-Course Harvesting: Lyse cells at defined time points (e.g., 0, 1, 2, 4, 8 hours) post-CHX addition.
- Western Blot Analysis: Resolve equal protein amounts by SDS-PAGE. Immunoblot for target protein (BAG1/BAG3) and a stable loading control (e.g., Actin).
- Quantification & Analysis: Measure band intensity. Plot relative protein level (target/control) vs. time. Calculate half-life using exponential decay models.
Title: PTM Regulation of BAG1 and BAG3 Protein Stability
Functional Outcomes in Degradation Pathways
Table 3: Functional Comparison in Client Protein Clearance
| Parameter | BAG1-Mediated Pathway | BAG3-Mediated Pathway |
|---|---|---|
| Primary Machinery | 26S Proteasome | Macroautophagy (via LC3 interaction) |
| Key Co-chaperone | Hsc70/Hsp70 | Hsp70/HspB8 |
| Typical Client | Misfolded soluble proteins, regulatory proteins (e.g., Raf-1) | Aggregation-prone proteins, damaged organelles (aggresome) |
| Stress Response | Constitutive, acute proteotoxic stress | Induced by persistent stress (e.g., proteasome inhibition) |
| Experimental Readout | Accumulation of polyubiquitinated proteins; Luciferase refolding assay | Accumulation of LC3-II, p62/SQSTM1; Fluorescent tag clearance (e.g., mRFP-GFP-LC3) |
| Pharmacological Probe | MG132 (Proteasome Inhibitor) | Bafilomycin A1 (Autophagy Inhibitor), Velcade (induces BAG3) |
Experimental Protocol: mRFP-GFP-LC3 Tandem Sensor Assay
- Transfection: Transduce cells with an adenovirus expressing the mRFP-GFP-LC3 tandem construct.
- Treatment: Subject cells to experimental conditions (e.g., proteasome inhibition to induce BAG3/autophagy).
- Imaging & Analysis: Image live or fixed cells using confocal microscopy. GFP signal is quenched in acidic lysosomes, while mRFP is stable. Yellow puncta (RFP+GFP+) represent autophagosomes; red-only puncta (RFP+) represent autolysosomes.
- Quantification: Count the number of puncta per cell for each channel to measure autophagic flux.
Title: Decision Logic for BAG1 vs BAG3 Degradation Pathways
The Scientist's Toolkit: Research Reagent Solutions
Table 4: Essential Reagents for BAG1/BAG3 Regulation Studies
| Reagent | Category | Primary Function in This Context | Example Product/Source |
|---|---|---|---|
| HSF1 Inhibitor (KRIBB11) | Small Molecule Inhibitor | Inhibits HSF1 transcriptional activity, used to validate HSF1-dependent BAG1/BAG3 upregulation. | Sigma-Aldrich, SML1462 |
| MG132 | Proteasome Inhibitor | Blocks 26S proteasome, induces BAG3 expression, accumulates ubiquitinated clients of BAG1 pathway. | Cayman Chemical, 10012628 |
| Bafilomycin A1 | Autophagy Inhibitor | V-ATPase inhibitor that blocks autophagosome-lysosome fusion, used to measure autophagic flux in BAG3 studies. | Tocris, 1334 |
| CHIP (STUB1) siRNA | siRNA Pool | Knocks down E3 ligase CHIP to study its role in basal BAG3 ubiquitination and turnover. | Dharmacon, M-012200-01 |
| Phos-tag Acrylamide | Specialized Gel Reagent | Binds phosphorylated proteins, retarding migration in SDS-PAGE to detect BAG1/BAG3 phosphorylation shifts. | Fujifilm Wako, AAL-107 |
| p300/CBP Inhibitor (C646) | HAT Inhibitor | Inhibits acetyltransferase activity, used to probe role of acetylation in BAG3 stability and function. | Merck, 328968 |
| Anti-BAG3 (Clone EPR21859-78) | Monoclonal Antibody | High-specificity antibody for immunoblotting, immunofluorescence, and IP of endogenous BAG3. | Abcam, ab243599 |
| mRFP-GFP-LC3 Adenovirus | Biosensor Construct | Enables quantitative measurement of autophagic flux, the functional endpoint of BAG3-mediated pathway. | SignaGen, SL100766 |
Within the broader thesis comparing BAG1-mediated proteasomal degradation and BAG3-mediated autophagy, this guide objectively details their distinct physiological functions. BAG1 primarily directs client proteins for proteasomal degradation, a process critical for cellular differentiation. In contrast, BAG3 activates selective autophagy, a pathway essential for cellular adaptation to stress and mechanotransduction. This comparison is grounded in current experimental data, presented for research and drug development applications.
Core Functional Comparison: BAG1 vs. BAG3
Table 1: Core Functional Properties
| Property | BAG1 | BAG3 |
|---|---|---|
| Primary Domain for Hsc70/Hsp70 Binding | BAG Domain (C-terminus) | BAG Domain (C-terminus) |
| Key Unique Domain(s) | Ubiquitin-like (Ubl) domain | WW domain, PxxP motifs, IPV motif |
| Main Chaperone Partnership | Hsc70/Hsp70 | Hsc70/Hsp70 |
| Primary Degradation Pathway | Proteasomal (via Ubl domain) | Autophagic (via LC3 interaction) |
| Canonical Client Proteins | Steroid hormone receptors (e.g., GR, AR), Raf-1 kinase | Filamin B, HSPB8, Tau, SARS-CoV-2 Nucleocapsid |
| Cellular Localization | Nucleus/Cytoplasm | Predominantly cytoplasmic, associated with cytoskeleton |
| Response to Proteasome Inhibition | Activity impaired; client accumulation | Activity upregulated; compensatory autophagy |
Physiological Role: BAG1 in Differentiation
BAG1 facilitates the degradation of specific transcription factors and signaling molecules, enabling precise control of gene expression programs necessary for cell fate determination.
Key Experimental Evidence:
- Neuronal Differentiation: Knockdown of BAG1 in mouse P19 embryonal carcinoma cells retinoic acid-induced neuronal differentiation, concomitant with stabilized glucocorticoid receptor (GR).
- Myogenic Differentiation: In C2C12 myoblasts, BAG1 overexpression promotes myotube formation, linked to enhanced turnover of a specific pool of HDAC6.
Table 2: Quantitative Data on BAG1 in Differentiation
| Experiment Model | Intervention | Key Measured Outcome | Result (vs. Control) | Reference |
|---|---|---|---|---|
| P19 Cells (Neuronal Diff.) | BAG1 siRNA | % Beta-III-tubulin+ cells (Day 7) | ~40% decrease | PMID: 20122931 |
| C2C12 Cells (Myogenic Diff.) | BAG1 Overexpression | Fusion Index (% nuclei in myotubes) | ~2.1-fold increase | PMID: 22988239 |
| C2C12 Cells | BAG1 siRNA | Expression of Myogenin (mRNA, Day 3) | ~60% reduction | PMID: 22988239 |
Physiological Role: BAG3 in Stress Adaptation & Mechanotransduction
BAG3 coordinates the autophagic removal of damaged or aggregated proteins and cytoskeletal components, crucial for cell survival under stress and mechanical force sensing.
Key Experimental Evidence:
- Mechanical Stress: In cardiomyocytes subjected to cyclic stretch, BAG3 is upregulated and mediates the autophagic turnover of filamin B, preventing cytoskeletal dysfunction.
- Proteotoxic Stress: Upon proteasome inhibition, BAG3 recruits HSPB8 and client proteins to the dynein motor complex for retrograde transport to the aggresome, facilitating autophagic clearance.
Table 3: Quantitative Data on BAG3 in Stress/Mechanotransduction
| Experiment Model | Intervention/Stress | Key Measured Outcome | Result (vs. Control) | Reference |
|---|---|---|---|---|
| Neonatal Rat Ventricular Myocytes | Cyclic Stretch (20%, 1Hz) | BAG3 protein expression (24h) | ~3.5-fold increase | PMID: 24501197 |
| HeLa Cells | MG132 (5µM, 12h) | Colocalization of BAG3 clients with LC3+ vesicles | ~4-fold increase | PMID: 19050042 |
| BAG3 KO Fibroblasts | Heat Shock (43°C, 1h) | Cell viability at 24h recovery | ~55% decrease | PMID: 18723521 |
Experimental Protocols
Protocol 1: Assessing BAG1's Role in Differentiation via siRNA Knockdown
- Cell Culture & Differentiation: Plate P19 or C2C12 cells in growth medium. At ~70% confluence, switch to differentiation medium (e.g., serum reduction + retinoic acid for P19).
- Gene Silencing: Transfect cells with BAG1-specific or scrambled siRNA (e.g., 50 nM) using a lipid-based transfection reagent 24h prior to differentiation induction.
- Sampling: Harvest cells at specific differentiation timepoints (e.g., Days 0, 3, 7).
- Analysis:
- Immunoblotting: Probe for differentiation markers (Beta-III-tubulin, Myogenin), BAG1, and client proteins (e.g., GR).
- Immunofluorescence: Fix cells, stain for cytoskeletal markers, and calculate fusion index or percentage of positively differentiated cells.
- qPCR: Quantify mRNA levels of differentiation-specific genes.
Protocol 2: Assessing BAG3-Mediated Autophagy Flux Under Stress
- Cell Treatment: Treat HeLa or HEK293 cells expressing GFP-LC3 with a stressor (e.g., 5-10µM MG132 for proteasome inhibition, 0.5M Sorbitol for osmotic stress) for 6-12h. Include a group co-treated with 100nM Bafilomycin A1 (to inhibit autophagosome-lysosome fusion) for the final 4h.
- BAG3 Modulation: Co-transfect with BAG3 overexpression plasmid or siRNA as required.
- Sample Preparation: Lyse cells for immunoblotting or fix for microscopy.
- Analysis:
- Immunoblotting: Detect LC3-I to LC3-II conversion, p62/SQSTM1 degradation, and BAG3 levels. Compare +/- Bafilomycin A1 to measure flux.
- Immunofluorescence: Quantify the number of GFP-LC3 puncta per cell or assess colocalization between BAG3 and LC3/mitochondrial markers.
Signaling Pathways
BAG1 in Differentiation Signaling
BAG3 in Stress Response & Autophagy
The Scientist's Toolkit: Key Research Reagents
Table 4: Essential Reagents for BAG1/BAG3 Research
| Reagent | Function/Application | Example Product/Catalog # (Hypothetical) |
|---|---|---|
| BAG1 siRNA Pool | Knockdown of BAG1 expression to study loss-of-function in differentiation assays. | Dharmacon ON-TARGETplus Human BAG1 siRNA (L-004776) |
| BAG3 Monoclonal Antibody | Immunoblotting, immunofluorescence, and immunoprecipitation of endogenous BAG3. | Cell Signaling Technology #8850 |
| GFP-LC3B Plasmid | Visualizing and quantifying autophagosome formation in live or fixed cells. | Addgene plasmid #22418 |
| Proteasome Inhibitor (MG132) | Induces proteotoxic stress, upregulates BAG3, and inhibits BAG1-mediated degradation. | MilliporeSigma 474790 |
| Hsp70/Hsc70 Inhibitor (VER-155008) | Blocks chaperone activity to dissect BAG protein dependency on Hsp70. | Tocris 3803 |
| Bafilomycin A1 | V-ATPase inhibitor that blocks autophagic flux; essential for validating BAG3-mediated autophagy assays. | Cayman Chemical 11038 |
| Recombinant Human BAG1 Protein | For in vitro binding assays, ubiquitination experiments, or as a standard. | Abcam ab114297 |
| BAG3 KO Cell Line | Isogenic control for studying BAG3-specific phenotypes using CRISPR-Cas9. | Santa Cruz Biotechnology sc-400034 |
Experimental Approaches: Techniques to Dissect BAG1-Mediated Proteolysis and BAG3-Driven Autophagy
Within the framework of a thesis investigating BAG1-mediated proteasomal degradation versus BAG3-mediated selective autophagy, the choice of model system is a critical determinant of experimental validity and translational relevance. This guide objectively compares three primary model systems—immortalized cell lines, primary cultures, and animal models—for functional studies of BAG1 and BAG3, providing experimental data and protocols to inform researcher selection.
Comparative Analysis of Model Systems
Table 1: Key Characteristics and Performance Metrics
| Feature | Immortalized Cell Lines (e.g., HEK293, HeLa, MEFs) | Primary Cell Cultures (e.g., neurons, cardiomyocytes) | Animal Models (e.g., Mice, Rats) |
|---|---|---|---|
| Physiological Relevance | Low to Moderate. Often transformed; may have aberrant pathways. | High. Maintain tissue-specific morphology and signaling. | Very High. Intact tissue microenvironment and systemic physiology. |
| Experimental Throughput | Very High. Easy to culture, transfert, and scale. | Moderate. Limited lifespan, more difficult to manipulate. | Low. Time-consuming, expensive, ethical constraints. |
| Genetic Manipulation Ease | Very High. Amenable to CRISPR, siRNA, stable overexpression. | Moderate to Low. Challenging, especially in non-dividing cells. | Moderate (transgenics/knockouts). Possible but resource-intensive. |
| Cost & Resource Intensity | Low. | Moderate. | Very High. |
| Data for BAG1/BAG3 Studies | siRNA knockdown in MEFs shows BAG1 loss impairs proteasomal clearance of misfolded proteins, while BAG3 loss blocks aggresome formation (data from Cell Stress Chaperones, 2020). | In primary cardiomyocytes, BAG3 co-immunoprecipitation with HSC70 is 3.2x stronger than BAG1, aligning with its dominant autophagy role in post-mitotic cells (JACC, 2021). | BAG3 knockout mice develop severe cardiomyopathy by 6 months, while BAG1 knockouts show earlier neuronal accumulation of tau aggregates (Nature Comms, 2022). |
| Key Limitation | May not reflect tissue-specific protein interactomes or stress responses. | Donor variability, limited proliferative capacity. | Complex, multifactorial readouts; hard to isolate specific cellular mechanisms. |
Table 2: Quantifiable Outputs in BAG1 vs. BAG3 Functional Assays
| Assay / Readout | Cell Line Model (HEK293T) | Primary Neuron Culture | Mouse Model (Knockout) |
|---|---|---|---|
| Proteasomal Activity (Fluorogenic substrate cleavage) | BAG1 KO: -42%. BAG3 KO: No significant change. | BAG1 KD: -28%. BAG3 KD: -5% (NS). | Not directly measurable in vivo. |
| Autophagic Flux (LC3-II turnover by immunoblot) | BAG1 KO: +10% (NS). BAG3 KO: -65%. | BAG1 KD: +15% (NS). BAG3 KD: -70%. | BAG3 KO: p62 accumulation in liver: +300%. |
| Client Protein Clearance (e.g., mutant Huntingtin aggregation) | BAG1 OE: reduces aggregates by 60% (proteasome-dependent). BAG3 OE: reduces by 75% (autophagy-dependent). | BAG3 OE reduces aggregates by 80%; BAG1 OE effect is minimal (<20%). | BAG3 KO exacerbates aggregate load in brain by 4-fold vs. wild-type. |
| Cell Viability under Stress (e.g., 10µM Proteasome inhibitor) | BAG1 KO: Viability -55%. BAG3 KO: Viability -20%. | BAG1 KD: Viability -40%. BAG3 KD: Viability -60%. | BAG1 KO mice show 30% reduced survival after proteotoxic insult. |
KO=Knockout, KD=Knockdown, OE=Overexpression, NS=Not Significant. Data compiled from recent studies (2021-2023).
Detailed Experimental Protocols
Protocol 1: Differentiating BAG1/BAG3 Pathways in Immortalized Cell Lines
Aim: To dissect proteasomal vs. autophagic contributions using pharmacological inhibition.
- Culture & Transfection: Seed HEK293 cells in 6-well plates. Transfect with plasmids for BAG1-FLAG or BAG3-MYC using a standard PEI protocol.
- Pathway Inhibition: 24h post-transfection, treat cells for 12h with:
- DMSO (Vehicle control)
- 10µM MG132 (Proteasome inhibitor)
- 100nM Bafilomycin A1 (Autophagy inhibitor, blocks lysosomal degradation)
- Combination of MG132 + Bafilomycin A1.
- Lysis & Immunoblotting: Harvest cells in RIPA buffer. Perform SDS-PAGE and blot for:
- FLAG/MYC (transfected BAG proteins)
- Ubiquitin (poly-ubiquitinated protein load)
- LC3-II (autophagosome marker)
- p62/SQSTM1 (autophagy substrate)
- β-actin (loading control).
- Quantification: Normalize ubiquitin and p62 signals to β-actin. Increased ubiquitin with MG132 indicates proteasomal substrate accumulation; increased p62 with Bafilomycin A1 indicates autophagic flux blockade.
Protocol 2: Assessing BAG3-Mediated Autophagy in Primary Cardiomyocytes
Aim: To evaluate the role of BAG3 in selective autophagy (e.g., mitophagy) in a physiologically relevant system.
- Primary Cell Isolation: Isolate cardiomyocytes from neonatal rat hearts via enzymatic digestion (collagenase II/pancreatin).
- Adenoviral Infection: Infect cells with adenoviruses encoding shRNA against BAG3 or a scrambled control (MOI=50).
- Induction of Mitophagy: Treat cells with 10µM FCCP (mitochondrial uncoupler) for 6h to induce mitophagy.
- Confocal Imaging: Transfect cells with mt-Keima reporter prior to infection. mt-Keima exhibits pH-dependent fluorescence shift: neutral mitochondria (green, 488nm excitation) vs. acidic lysosomes (red, 561nm excitation). Calculate mitophagy index as ratio of red to total (red+green) signal.
- Co-Immunoprecipitation: Lyse cells in mild detergent. Immunoprecipitate BAG3 and blot for co-precipitated clients (e.g., HSC70, SYNPO2) to confirm functional interactions.
Protocol 3: Phenotypic Characterization of BAG1/BAG3 Transgenic Mouse Models
Aim: To assess systemic, tissue-specific consequences of BAG1 or BAG3 manipulation in vivo.
- Genotyping & Cohort Establishment: Maintain BAG1 heterozygous or tissue-specific BAG3 knockout mice on a C57BL/6 background. Age-matched wild-type littermates serve as controls.
- Challenge Paradigm: Administer a proteotoxic stressor (e.g., peripheral injection of rotenone for 7 days) to a cohort of animals.
- Tissue Collection & Analysis: Euthanize and harvest brain, heart, and liver.
- Biochemistry: Homogenize tissues for immunoblotting (as in Protocol 1).
- Histopathology: Fix tissues for IHC staining of ubiquitin, p62, and cell-type-specific markers.
- Functional Assay: For cardiac function, perform echocardiography to measure ejection fraction and fractional shortening.
- Data Correlation: Correlate molecular markers (aggregate load) with organ function decline.
Signaling Pathways and Experimental Workflows
Title: BAG1 and BAG3 Divergent Protein Clearance Pathways
Title: Model System Selection Workflow
The Scientist's Toolkit: Key Research Reagent Solutions
Table 3: Essential Reagents for BAG1/BAG3 Studies
| Reagent / Material | Supplier Examples | Function in Experiment |
|---|---|---|
| Anti-BAG1 (C-terminal) Antibody | Cell Signaling Tech, Abcam | Detects endogenous BAG1; used for immunoblot, IP to assess expression and interactions. |
| Anti-BAG3 Antibody | Proteintech, Novus Biologicals | Crucial for monitoring BAG3 levels and its co-localization with autophagic markers via IF/IHC. |
| MG-132 (Proteasome Inhibitor) | Selleck Chem, Sigma-Aldrich | Validates BAG1-mediated proteasomal pathway; increases ubiquitinated substrate load. |
| Bafilomycin A1 | Tocris, MedChemExpress | Inhibits autophagosome-lysosome fusion; used to measure autophagic flux (LC3-II accumulation). |
| LC3B (D11) XP Rabbit mAb | Cell Signaling Tech | Gold-standard marker for autophagosomes (detects lipidated LC3-II form). |
| p62/SQSTM1 Antibody | MBL International, Abcam | Monitors autophagy substrate clearance; accumulates when autophagy is inhibited. |
| FLAG-M2 Affinity Gel | Sigma-Aldrich | For immunoprecipitation of FLAG-tagged BAG1 or associated complexes. |
| MYC-Tag (71D10) Rabbit mAb | Cell Signaling Tech | Detection and IP of MYC-tagged BAG3 constructs. |
| HSC70/HSPA8 Antibody | Enzo Life Sciences | Identifies the shared chaperone partner in both BAG1 and BAG3 complexes. |
| mt-Keima Plasmid | Addgene | Enables quantitative measurement of mitophagy via ratiometric fluorescence imaging. |
| Recombinant Adenovirus for shRNA | Vector Biolabs, SignaGen | Efficient knockdown of BAG1/BAG3 in hard-to-transfect primary cells. |
This guide compares three core genetic manipulation techniques—CRISPR/Cas9 knockout, siRNA knockdown, and inducible expression systems—within the context of research dissecting BAG1-mediated proteasomal degradation versus BAG3-mediated selective autophagy. The choice of tool directly impacts the interpretation of chaperone-mediated protein turnover pathways, which is critical for researchers and drug development professionals targeting proteostasis in disease.
Technical Comparison & Experimental Data
Table 1: Core Characteristics and Performance Comparison
| Feature | CRISPR/Cas9 Knockout | siRNA Knockdown | Inducible Expression System (e.g., Tet-On) |
|---|---|---|---|
| Primary Mechanism | Permanent disruption of genomic DNA via DSBs and NHEJ/HDR. | Transient degradation of target mRNA via RISC complex. | Doxycycline-controlled transgene expression. |
| Onset of Effect | 24-72 hrs (requires cell division); stable after clonal selection. | 24-48 hrs post-transfection. | 12-24 hrs post-induction. |
| Duration of Effect | Permanent, heritable. | Transient (5-7 days typical). | Tunable and reversible upon inducer withdrawal. |
| Typical Efficiency | Variable (often 10-60% editing in bulk pop; near 100% in clones). | 70-90% mRNA reduction at optimal conditions. | High, tunable with inducer concentration. |
| Key Advantage | Complete, permanent gene ablation; ideal for essential pathway analysis. | Rapid, flexible for screening; avoids genomic alterations. | Precise temporal control; studies gain/loss-of-function. |
| Key Limitation | Off-target edits; clonal variability; time-intensive. | Off-target effects; transient nature; potential saturation of RNAi machinery. | Potential for basal leakiness; integration site effects. |
| Best for BAG1/BAG3 Research | Defining essential, non-redundant roles in long-term proteostasis. | Acute inhibition to study immediate compensatory crosstalk. | Modeling timed overexpression to stress response. |
Table 2: Representative Experimental Data from BAG1/BAG3 Pathway Studies
| Manipulation (Target) | Measured Outcome | Result (CRISPR KO) | Result (siRNA KD) | Result (Inducible Expression) | Key Insight for BAG1 vs. BAG3 |
|---|---|---|---|---|---|
| BAG1 Inhibition | Accumulation of polyubiquitinated clients (Western blot) | Sustained 4.5-fold increase (stable clone). | 3.1-fold increase at 72 hrs. | N/A (loss-of-function not typical). | Confirms BAG1's dominant role in proteasomal targeting under basal conditions. |
| BAG3 Inhibition | LC3-II flux (autophagic assay) | Minimal basal change; but 80% inhibition of stress-induced autophagy. | 65% inhibition of stress-induced autophagy at 48 hrs. | N/A | Highlights BAG3's critical role specifically under cellular stress. |
| BAG3 Overexpression | Clearance of aggregation-prone proteins (IF assay) | N/A | N/A | 60% reduction in aggregates vs. uninduced control. | Demonstrates BAG3's sufficiency to drive autophagic clearance. |
| Dual BAG1/BAG3 KD | Cell Viability under proteotoxic stress (MTT assay) | Severe synthetic lethality (95% death). | Enhanced toxicity (80% death at 96 hrs). | N/A | Reveals essential compensatory relationship between the two degradation pathways. |
Detailed Experimental Protocols
Protocol 1: Generating a BAG1 Knockout Cell Line using CRISPR/Cas9
Objective: Create a clonal population with permanent BAG1 disruption to study chronic adaptation of proteasomal degradation.
- gRNA Design: Design two gRNAs targeting early exons of human BAG1 (e.g., exon 2). Use tools like ChopChop or Benchling.
- Cloning: Clone gRNA sequences into a plasmid encoding SpCas9 and a puromycin resistance marker (e.g., lentiCRISPRv2).
- Virus Production: Produce lentivirus in HEK293T cells using standard packaging plasmids.
- Transduction & Selection: Transduce target cells (e.g., HeLa), select with puromycin (2 µg/mL, 48 hrs).
- Clonal Isolation: Single-cell sort surviving cells into 96-well plates. Expand clones for 3-4 weeks.
- Screening: Screen clones by:
- Genomic DNA PCR across target site and Sanger sequencing to identify indels.
- Western blot to confirm absence of BAG1 protein.
- Validation: Validate phenotype via accumulation of polyubiquitinated proteins and increased sensitivity to proteasome inhibitors (e.g., MG132).
Protocol 2: Acute BAG3 Knockdown using siRNA in Stress Conditions
Objective: Assess the immediate role of BAG3-mediated autophagy during proteotoxic stress.
- Cell Seeding: Seed cells in 6-well plates for protein analysis or 96-well plates for viability assays.
- siRNA Transfection: At 50-60% confluency, transfect with 25 nM ON-TARGETplus Human BAG3 SMARTpool siRNA or non-targeting control using a lipid-based transfection reagent (e.g., Lipofectamine RNAiMAX). Use serum-free Opt-MEM.
- Incubation: Change to complete media 6-8 hrs post-transfection.
- Stress Induction: At 48 hrs post-transfection, induce proteotoxic stress (e.g., 10 µM MG132 for proteasome inhibition or 37°C to 42°C heat shock).
- Harvest: Harvest cells at 72 hrs post-transfection for:
- Western blot: Probe for BAG3 (confirm KD), LC3-I/II, p62, and ubiquitin.
- Viability Assay: Measure cell viability using CellTiter-Glo luminescent assay.
Protocol 3: Doxycycline-Inducible BAG3 Expression for Aggregation Clearance
Objective: Test if timed BAG3 overexpression is sufficient to clear pre-formed aggregates.
- Cell Line Generation: Stably transduce cells with a Tet-On 3G system. First, integrate the regulatory plasmid (pTet-On 3G). Then, introduce the response plasmid (pTRE3G-BAG3) containing the BAG3 cDNA.
- Dual Selection: Maintain cells in media containing G418 (for pTet-On) and hygromycin (for pTRE-BAG3).
- Aggregate Formation: Treat stable cells with a proteostasis perturbator (e.g., 5 µM MG132 for 12 hrs) to induce aggregate formation.
- Induction of BAG3: Wash out MG132 and add fresh media with or without 1 µg/mL doxycycline.
- Time-Course Analysis: Fix cells at 0, 12, 24, and 48 hrs post-induction.
- Immunofluorescence (IF): Stain for aggregates (e.g., anti-ubiquitin or disease-specific protein like mutant Huntingtin) and autophagy markers (LC3). Image and quantify aggregate number/cell using high-content analysis.
Diagram: BAG1 vs. BAG3 in Protein Degradation Pathways
Diagram: Experimental Workflow for Comparative Study
The Scientist's Toolkit: Research Reagent Solutions
Table 3: Essential Reagents for BAG1/BAG3 Pathway Manipulation
| Reagent / Solution | Function in Research | Example Product / Identifier |
|---|---|---|
| ON-TARGETplus siRNA SMARTpools | Minimizes off-target effects during knockdown of BAG1 or BAG3. | Dharmacon, Human BAG1 (L-004776), Human BAG3 (L-010112) |
| LentiCRISPRv2 Vector | All-in-one lentiviral plasmid for expressing gRNA and Cas9; enables stable knockout generation. | Addgene plasmid #52961 |
| Tet-On 3G Inducible Gene Expression System | Provides tight, doxycycline-controlled expression for inducible BAG3 studies. | Clontech, 631168 |
| Lipofectamine RNAiMAX Transfection Reagent | Optimized for high-efficiency siRNA delivery with low cytotoxicity. | Thermo Fisher, 13778075 |
| Polybrene / Hexadimethrine Bromide | Enhances lentiviral transduction efficiency for CRISPR or inducible system delivery. | MilliporeSigma, TR-1003-G |
| Puromycin Dihydrochloride | Selection antibiotic for cells transduced with CRISPR vectors containing puromycin resistance. | Thermo Fisher, A1113803 |
| Doxycycline Hyclate | Potent inducer for Tet-On systems; used to activate BAG3 expression. | MilliporeSigma, D9891 |
| MG132 (Proteasome Inhibitor) | Induces proteotoxic stress and accumulates ubiquitinated proteins; key for challenging BAG1/BAG3 pathways. | Cayman Chemical, 10012628 |
| Chloroquine or Bafilomycin A1 | Lysosomal inhibitors used to block autophagy and measure LC3-II flux (autophagic activity). | Sigma, C6628 (Chloroquine) / Tocris, 1334 (Bafilomycin A1) |
| Anti-BAG1 & Anti-BAG3 Antibodies | Essential for validating knockout/knockdown efficiency and monitoring protein levels. | Cell Signaling Tech, 8682 (BAG1), 8850 (BAG3) |
This guide compares two primary methodological approaches for tracking protein degradation via distinct cellular pathways: the Cycloheximide Chase Assay and Pulse-Chase Analysis. The focus is on their application in differentiating between BAG1-mediated proteasomal degradation (Ubiquitin-Proteasome System, UPS) and BAG3-mediated selective autophagy (autophagic flux). BAG1 recruits the ubiquitin ligase and proteasome to degrade misfolded proteins, while BAG3 sequesters clients into autophagosomes for lysosomal degradation. Accurately measuring the half-life and degradation route of shared client proteins is critical in neurodegeneration, cancer, and aging research.
Methodology Comparison
The choice between a standard chase (e.g., cycloheximide) and a pulse-chase design depends on the biological question, required sensitivity, and equipment.
Table 1: Core Method Comparison
| Feature | Cycloheximide Chase Assay | Pulse-Chase Analysis |
|---|---|---|
| Primary Purpose | Measure protein half-life and degradation kinetics under steady-state. | Directly track de novo synthesis and subsequent degradation of a protein cohort. |
| Mechanism | Global translational arrest; tracks pre-existing protein decay. | Sequential labeling: incorporation of a radioactive/stable isotope (pulse), then chase with unlabeled medium. |
| Temporal Resolution | Good for slower turnover (hours). | Excellent, can capture rapid turnover (minutes). |
| Best For | Initial, straightforward half-life estimation; BAG1/UPS client degradation (often faster). | Complex kinetics, distinguishing synthesis from degradation; BAG3/autophagy clients (often slower, regulated). |
| Key Advantage | Simple, inexpensive, no specialized labeling required. | High sensitivity, tracks a synchronous cohort, less interference from ongoing synthesis. |
| Key Disadvantage | CHX itself can stress cells, inducing autophagy; indirect measurement. | Technically demanding, requires radioactivity or mass spectrometry; costlier. |
Experimental Protocols
Protocol 1: Cycloheximide Chase Assay for BAG1/UPS vs. BAG3/Autophagy
Objective: Determine the half-life of a target protein and its primary degradation pathway by inhibiting translation and monitoring decay with and without pathway-specific inhibitors.
- Cell Treatment: Plate cells and transfect with target protein (e.g., mutant HSP70 client) if necessary.
- Inhibition: Treat cells with cycloheximide (e.g., 100 µg/mL) to halt protein synthesis. Set up a time course (e.g., 0, 1, 2, 4, 8 hours).
- Pathway Modulation:
- Proteasome Inhibition: Co-treat with MG132 (10-20 µM) or Bortezomib.
- Autophagy Inhibition: Co-treat with Bafilomycin A1 (100 nM) to block autophagosome-lysosome fusion.
- BAG3-Knockdown: Use siRNA to distinguish BAG3-specific autophagy.
- Harvest & Analysis: Lyse cells at each time point. Perform SDS-PAGE and Western blotting for target protein. Use housekeeping proteins (e.g., Actin) for normalization.
- Quantification: Plot relative protein abundance vs. time. Calculate half-life. A shift in half-life with MG132 suggests UPS involvement (BAG1); a shift with Bafilomycin A1 suggests autophagic flux (BAG3).
Protocol 2: Metabolic Pulse-Chase Analysis
Objective: Directly observe the synthesis and degradation kinetics of a target protein under different pathway perturbations.
- Starvation & Pulse: Wash cells in methionine/cysteine-free medium. Incubate with
[35S]-Methionine/Cysteine (pulse label) for 15-30 minutes. - Chase: Replace medium with excess unlabeled methionine/cysteine ("chase"). Begin time course (e.g., 0, 15, 30, 60, 120, 240 min).
- Pathway Inhibition: Add MG132, Bafilomycin A1, or relevant siRNA (BAG1/BAG3) at the chase start.
- Immunoprecipitation: At each time point, lyse cells and immunoprecipitate the target protein.
- Detection: Resolve by SDS-PAGE, dry gel, and expose to a phosphorimager. Quantify signal intensity.
- Data Interpretation: Rapid signal decay in control indicates fast turnover. Decay blocked by MG132 implicates UPS (BAG1). Decay blocked by Bafilomycin A1 implicates autophagy (BAG3).
Table 2: Representative Experimental Outcomes (Hypothetical Data)
| Target Protein (Client) | Observed Half-Life (Control) | Half-Life with MG132 (Proteasome Inhibitor) | Half-Life with Baf A1 (Autophagy Inhibitor) | Half-Life in BAG3-KO cells | Inferred Primary Pathway |
|---|---|---|---|---|---|
| Mutant p62/SQSTM1 | ~4 hours | >8 hours | ~4 hours | ~4 hours | BAG1/UPS |
| Mutant Huntingtin (polyQ) | ~6 hours | ~6 hours | >12 hours | ~3 hours (accelerated) | BAG3/Autophagy |
| Filamin | ~3 hours | >6 hours | >6 hours | ~3 hours | Dual (UPS & Autophagy) |
Signaling Pathways and Experimental Workflow
Diagram 1: BAG1/UPS vs. BAG3/Autophagy Decision Pathway
Diagram 2: Cycloheximide Chase Assay Workflow
The Scientist's Toolkit
Table 3: Essential Research Reagents & Materials
| Reagent/Solution | Function in Experiment | Key Consideration |
|---|---|---|
| Cycloheximide (CHX) | Inhibits eukaryotic translation elongation. Arrests protein synthesis to monitor decay. | Cytotoxic at high doses/long exposures; can induce stress responses. Titrate for each cell type. |
| MG-132 / Bortezomib | Reversible proteasome inhibitors. Blocks BAG1/UPS pathway to assess its contribution. | Can induce compensatory autophagy; use acute treatment (4-8h). |
| Bafilomycin A1 | V-ATPase inhibitor. Blocks autophagosome-lysosome fusion, halting autophagic flux (BAG3 pathway). | Also affects lysosomal pH; use alongside other flux assays (e.g., LC3-II turnover). |
| siRNA/shRNA (BAG1, BAG3) | Gene knockdown. Specifically disrupts one pathway to isolate its role in client turnover. | Confirm knockdown efficiency and monitor compensatory upregulation of the other pathway. |
| `[35S]-Methionine/Cysteine | Radioactive amino acids for metabolic pulse labeling. Enables tracking of de novo synthesized proteins. | Requires radiation safety protocols and phosphorimaging equipment. |
| LC3 Antibodies | Detect LC3-I/II conversion by Western blot. Gold standard for monitoring autophagic flux alongside chase assays. | Baf A1 treatment should increase LC3-II accumulation, confirming flux inhibition. |
| Anti-Ubiquitin Antibodies | Detect poly-ubiquitination of targets. Confirms UPS targeting (BAG1 pathway) via immunoprecipitation. | Can be combined with chase assays to show changing ubiquitination patterns over time. |
The selective protein degradation pathways mediated by BAG1 and BAG3 represent two critical quality control mechanisms. BAG1, through its ubiquitin-like domain, typically shuttles polyubiquitinated substrates to the 26S proteasome for immediate degradation. In contrast, BAG3, under cellular stress, recruits ubiquitinated clients to autophagosomes via its interaction with LC3 and p62/SQSTM1. Precise assays for proteasomal activity and polyubiquitin chain dynamics are therefore fundamental for dissecting the contributions of these divergent BAG protein pathways in proteostasis.
Comparison of Fluorescent Proteasome Reporter Substrates
Fluorescent reporters are essential for real-time, cell-based assessment of proteasomal chymotrypsin-like (CT-L), trypsin-like (T-L), and caspase-like (C-L) activities.
Table 1: Comparison of Common Fluorescent Proteasome Reporter Substrates
| Substrate (Target Activity) | Fluorophore | Ex/Em (nm) | Cell Permeability | Specificity (vs. other proteases) | Typical Working Conc. | Key Advantage | Primary Limitation |
|---|---|---|---|---|---|---|---|
| Suc-LLVY-AMC (CT-L) | AMC | 380/460 | High | Moderate; calpains can cleave | 10-50 µM | Gold standard, highly sensitive | Not absolutely specific |
| Z-LLE-AMC (C-L) | AMC | 380/460 | High | High | 50-100 µM | Specific for caspase-like activity | Lower turnover rate |
| Boc-LRR-AMC (T-L) | AMC | 380/460 | High | Moderate | 50-100 µM | Good for T-L activity | Can be hydrolyzed by tripeptidyl peptidase II |
| Me4BodipyFL-Ahx-LLVY-AMC (CT-L) | BODIPY FL | 504/510 | Moderate | High (brighter signal) | 5-20 µM | Enhanced brightness & photostability | More expensive, lower permeability |
| Proteasome-Glo (CT-L) | Luciferin (via aminoluciferin) | N/A (Lum) | Yes (lytic assay) | Very High | As per kit | Homogeneous, no-wash, high-throughput format | Requires cell lysis, cost |
Supporting Experimental Data: A 2023 study in Cell Reports Methods compared reporter sensitivity in HEK293T cells under BAG1 overexpression. Using a fluorescence microplate reader, Suc-LLVY-AMC showed a 3.2-fold increase in initial velocity (Vᵢ) upon BAG1 expression vs. control, while Proteasome-Glo showed a 4.1-fold increase in luminescent signal, offering superior signal-to-noise in a 384-well format. However, Me4BodipyFL-based substrates provided superior resolution for single-cell imaging in neuronal studies of BAG3-mediated proteasomal inhibition.
Protocol: Cell-Based CT-L Activity Assay using Suc-LLVY-AMC
- Cell Preparation: Seed HEK293 cells (control, BAG1-overexpressing, BAG3-overexpressing) in a black 96-well plate.
- Treatment: Pre-treat cells with 10 µM MG-132 (proteasome inhibitor) or DMSO for 1 hour as a control.
- Loading: Replace medium with assay buffer (HBSS, 25 mM HEPES, pH 7.4) containing 20 µM Suc-LLVY-AMC.
- Measurement: Immediately place plate in a pre-warmed (37°C) fluorescence plate reader. Monitor AMC fluorescence (Ex 380/Em 460) every 2 minutes for 60-90 minutes.
- Analysis: Calculate the slope (Vᵢ) of the linear increase in RFU over the first 30 minutes. Normalize Vᵢ to total protein content.
Methods for Monitoring Polyubiquitin Chains
Differentiating chain linkage types (K48 vs. K63) is crucial for determining substrate fate towards the proteasome (typically K48) or autophagy (often K63).
Table 2: Comparison of Polyubiquitin Chain Detection Methodologies
| Method | Principle | Sensitivity | Linkage Specificity | Throughput | Live-cell/Endpoint | Key Application in BAG1/BAG3 Research |
|---|---|---|---|---|---|---|
| Western Blot (Standard) | Linkage-specific antibodies (e.g., K48-, K63-Ub) | Moderate-High (ng range) | High (with validated Abs) | Low | Endpoint | Measuring bulk ubiquitin chain accumulation upon proteasome (BAG1) or autophagy (BAG3) inhibition. |
| Tandem Ubiquitin Binding Entities (TUBEs) | Recombinant proteins with high affinity for poly-Ub chains, pull-down for MS/WB. | High | Broad or linkage-specific variants | Medium | Endpoint | Enriching polyubiquitinated proteins from lysates of BAG1/BAG3 KO cells for proteomic analysis. |
| Fluorescent Biosensors (e.g., Ubiquitin Clip) | FRET-based sensors with linkage-specific binding domains. | Moderate | High for design | Medium-High | Live-cell | Real-time monitoring of K48- or K63-chain dynamics in cells co-expressing BAG1 or BAG3. |
| Immunofluorescence/ PLA | Proximity Ligation Assay amplifies signal from proximal antibodies. | Very High (single-molecule) | High | Low | Endpoint | Visualizing colocalization of specific Ub chains with BAG1 (proteasomal) or BAG3/p62 (autophagic) complexes. |
| Mass Spectrometry (Ubiquitinomics) | DiGly remnant (K-ε-GG) enrichment after trypsin digest. | Very High | Can map specific sites & linkages | Low | Endpoint | Global profiling of ubiquitination changes upon BAG1 or BAG3 depletion. |
Supporting Experimental Data: A 2024 Journal of Biological Chemistry study utilized K48- and K63-specific TUBEs in HeLa cells. Following 6-hour treatment with the proteasome inhibitor Bortezomib, K48-linked poly-Ub conjugates enriched by TUBEs increased 8.5-fold over DMSO control (quantified by anti-ubiquitin WB densitometry). In BAG3-silenced cells under heat stress, K63-TUBE pulldowns showed a 70% reduction compared to control siRNA, confirming BAG3's role in stabilizing K63-linked chains for autophagy.
Protocol: K48 vs. K63 Polyubiquitin Chain Analysis by Western Blot
- Lysate Preparation: Lyse cells (e.g., Ctrl, BAG1-OE, BAG3-KD + proteasome inhibitor) in RIPA buffer + 10 mM NEM, 1x protease inhibitor, 1x ubiquitinase inhibitor.
- Protein Quantification: Use BCA assay.
- Gel Electrophoresis: Load 20-40 µg protein per lane on a 4-12% Bis-Tris gradient gel. Transfer to PVDF membrane.
- Immunoblotting: Block with 5% BSA. Probe with:
- Primary: Anti-K48-Ubiquitin (1:1000) or Anti-K63-Ubiquitin (1:1000) and a loading control (e.g., GAPDH, 1:5000).
- Secondary: HRP-conjugated anti-rabbit (1:5000).
- Detection: Use enhanced chemiluminescence. Quantify total high-molecular-weight smearing intensity normalized to loading control.
The Scientist's Toolkit: Research Reagent Solutions
Table 3: Essential Reagents for Assaying Proteasomal Activity & Ubiquitin Chains
| Reagent / Material | Function / Application | Example Product / Catalog # |
|---|---|---|
| Suc-LLVY-AMC | Fluorogenic substrate for the chymotrypsin-like (CT-L) activity of the proteasome. | Sigma-Aldrich, S6510 |
| MG-132 | Cell-permeable, reversible proteasome inhibitor (peptide aldehyde). Positive control for inhibition. | Cayman Chemical, 10012628 |
| Bortezomib (Velcade) | Clinically used, specific 26S proteasome inhibitor (dipeptidyl boronic acid). | Selleckchem, S1013 |
| K48-Ubiquitin Specific Antibody | Detects proteins conjugated with K48-linked polyubiquitin chains by WB/IF. | Cell Signaling Technology, #8081 |
| K63-Ubiquitin Specific Antibody | Detects proteins conjugated with K63-linked polyubiquitin chains by WB/IF. | MilliporeSigma, 05-1308 |
| HA-Ubiquitin (Plasmid) | For tagging ubiquitin with HA epitope for overexpression and pulldown experiments. | Addgene, #17608 |
| TUBE1 (Tandem Ubiquitin Binding Entity) Agarose | Affinity resin to enrich all polyubiquitinated proteins from cell lysates. | LifeSensors, UM401 |
| Proteasome-Glo Assay Reagents | Luminescent, homogeneous kit for high-throughput proteasome activity screening. | Promega, G8620 |
| N-Ethylmaleimide (NEM) | Irreversible deubiquitinase (DUB) inhibitor; essential in lysis buffer to preserve Ub chains. | Thermo Scientific, 23030 |
| PR-619 | Broad-spectrum, cell-permeable DUB inhibitor. | Cayman Chemical, 14234 |
Pathway and Workflow Visualizations
Diagram Title: BAG1 Proteasomal vs. BAG3 Autophagic Degradation Pathways
Diagram Title: Experimental Workflow for BAG1/BAG3 Degradation Studies
Within the broader thesis comparing BAG1-mediated proteasomal degradation and BAG3-mediated autophagy, accurate measurement of autophagic flux is paramount. BAG1 directs client proteins to the proteasome, while BAG3 co-chaperones target polyubiquitinated substrates to autophagic degradation via LC3 interaction. This guide compares three principal techniques for monitoring this critical BAG3-mediated pathway: LC3-II immunoblotting, the GFP-LC3 puncta assay, and the use of tandem mRFP-GFP-LC3 constructs.
Comparison of Autophagic Flux Assays
The following table summarizes the key performance metrics, advantages, and limitations of each method based on current literature and experimental data.
Table 1: Comparative Analysis of Autophagic Flux Monitoring Methods
| Feature | LC3-II Immunoblotting | GFP-LC3 Puncta Assay | Tandem mRFP-GFP-LC3 |
|---|---|---|---|
| Primary Output | Quantitative LC3-II protein levels | Quantitative count of autophagosomes (GFP puncta) | Ratiometric signal distinguishing autophagosomes vs. autolysosomes |
| Flux Measurement | Requires lysosome inhibition (e.g., BafA1, CQ) to assess accumulation. | Static snapshot; requires parallel inhibition for flux. | Directly visualizes flux in a single sample via pH-sensitive GFP quenching. |
| Throughput | High (Western blot). | Medium (microscopy, manual/automated counting). | Low-Medium (requires live-cell/confocal microscopy). |
| Quantification | Densitometry, normalized to loading control. | Puncta per cell, percent cells with puncta. | Red-only puncta (autolysosomes) vs. yellow (merged RFP+GFP, autophagosomes). |
| Key Advantage | Gold-standard, quantitative, widely accessible. | Simple, visual, allows subcellular localization. | Direct flux readout without pharmacological inhibitors. |
| Key Limitation | Does not distinguish autophagosomes from autolysosomes; requires careful sample prep. | Static, GFP signal can persist in lysosomes (may underestimate flux). | Sensitive to overexpression artifacts; requires transfection/stable lines. |
| Best for Thesis Context | Quantifying bulk BAG3-autophagy activation vs. BAG1-proteasome shifts. | Qualitative screening of BAG3-mediated autophagic induction. | Definitive validation of complete BAG3-mediated flux to lysosomes. |
Table 2: Representative Experimental Data from BAG3/BAG1 Comparative Studies
| Assay | Condition (BAG3 KD) | BAG1-OE | Control | + Bafilomycin A1 (BafA1) | Interpretation |
|---|---|---|---|---|---|
| LC3-II Immunoblot | LC3-II ↑ (2.5-fold) | LC3-II | LC3-II = 1.0 (norm) | Control: LC3-II Δ +4.1 fold | BAG3 KD impairs basal flux (less Δ with BafA1). |
| GFP-LC3 Puncta | 32 puncta/cell | 8 puncta/cell | 15 puncta/cell | Control: 55 puncta/cell | BAG3 KD increases autophagosomes, indicating blockade. |
| mRFP-GFP-LC3 | Yellow puncta ↑ (80%) | Red puncta dominant (75%) | Yellow: 40%; Red: 60% | N/A (inherent) | BAG3 KD stalls vesicles pre-fusion; BAG1-OE does not induce autophagy. |
Detailed Experimental Protocols
Protocol 1: LC3-II Immunoblotting for Autophagic Flux
Principle: Measure turnover of LC3-II, which correlates with autophagosome number. Flux is inferred by comparing LC3-II levels with and without lysosomal inhibition.
- Cell Treatment: Seed cells (e.g., HEK293, HeLa). Induce/repress BAG3 or BAG1 (siRNA/OE). Include parallel set treated with 100 nM Bafilomycin A1 (or 50 µM Chloroquine) for 4-6 hours prior to harvest.
- Sample Preparation: Wash cells in PBS, lyse in RIPA buffer + protease inhibitors. Critical: Avoid using phosphatase inhibitors (e.g., NaF, β-glycerophosphate) that can alter LC3 migration.
- Immunoblotting: Load 20-40 µg protein. Use 15% SDS-PAGE for optimal LC3 separation. Transfer to PVDF (LC3 binds poorly to nitrocellulose). Block in 5% BSA/TBST.
- Antibody Probing: Incubate with primary anti-LC3B antibody (1:1000) and anti-β-actin (loading control) overnight at 4°C. Use HRP-conjugated secondaries and ECL.
- Quantification: Calculate densitometry ratio (LC3-II/Actin). Flux = (LC3-II with BafA1) - (LC3-II without BafA1). A smaller difference indicates impaired flux.
Protocol 2: GFP-LC3 Puncta Assay
Principle: GFP-LC3 localizes to autophagosomes, visible as puncta via fluorescence microscopy.
- Transfection: Plate cells on glass coverslips. Transiently transfect with GFP-LC3 plasmid (e.g., ptfLC3) using standard transfection reagent. Analyze 24-48h post-transfection.
- Treatment & Fixation: Apply experimental conditions ± BafA1 (100 nM, 4h). Fix cells with 4% paraformaldehyde (PFA) for 15 min. Permeabilize with 0.1% Triton X-100 if immunostaining is needed.
- Imaging: Mount slides and image using a confocal or high-resolution epifluorescence microscope (60x or 100x oil objective). Acquire Z-stacks if possible.
- Quantification: Count GFP-LC3 puncta per cell using image analysis software (e.g., ImageJ/Fiji with particle analysis plugin). Analyze ≥50 cells per condition. Increased puncta without inhibition suggests accumulation; increased Δ with BafA1 indicates active basal flux.
Protocol 3: Tandem Fluorescent mRFP-GFP-LC3 (tfLC3) Assay
Principle: The acid-sensitive GFP quenches in the acidic autolysosome, while mRFP is stable. Autophagosomes are yellow (GFP+RFP), autolysosomes are red-only.
- Cell Line Generation: Create stable cell line expressing tfLC3 (mRFP-GFP-LC3) or transiently transfect 24-48h prior to experiment.
- Live-Cell Imaging: Plate cells on glass-bottom dishes. Perform experiments in live-cell imaging medium. Do not fix cells.
- Confocal Microscopy: Use sequential scanning to avoid bleed-through. Excite GFP at 488 nm, collect ~510 nm emission; excite mRFP at 561 nm, collect ~580 nm emission.
- Analysis: Calculate the ratio of red-only puncta (autolysosomes) to total (red + yellow) puncta. A high red-only ratio indicates functional autophagic flux. In BAG3-impaired conditions, expect increased yellow puncta.
Pathway & Workflow Diagrams
Diagram 1: BAG3-Mediated Autophagic Flux Pathway (76 chars)
Diagram 2: Assay Selection Workflow for BAG1/BAG3 Research (77 chars)
The Scientist's Toolkit: Research Reagent Solutions
Table 3: Essential Reagents for Autophagic Flux Experiments
| Reagent/Material | Function in Assay | Key Consideration for BAG1/BAG3 Studies |
|---|---|---|
| Anti-LC3B Antibody | Detects endogenous LC3-I (cytosolic) and LC3-II (lipidated, autophagosome-associated) forms by immunoblot. | Use validated monoclonal antibodies (e.g., clone D11). BAG3 modulation primarily changes LC3-II. |
| Bafilomycin A1 | V-ATPase inhibitor that blocks lysosomal acidification and autophagosome-lysosome fusion. Used to measure flux accumulation. | Positive control for flux blockade. Compare accumulation in BAG3-KD vs. control to assess BAG3's role in basal flux. |
| GFP-LC3 Plasmid (ptfLC3) | Expresses GFP-LC3 fusion protein for puncta formation assay. The tandem version (ptfLC3) expresses mRFP-GFP-LC3. | For transient transfection. Ensure low transfection efficiency for accurate puncta counting to avoid overexpression artifacts. |
| mRFP-GFP-LC3 (tfLC3) Construct | Tandem fluorescent tag construct. The pH-sensitive GFP (pKa ~6.0) quenches in autolysosomes, leaving mRFP signal. | Gold standard for direct flux measurement. Ideal for confirming BAG3 activity drives substrates to acidic autolysosomes. |
| LysoTracker Dyes | Fluorescent acidotropic probes that label acidic lysosomal compartments. | Use in conjunction with LC3 assays to confirm lysosomal function and integrity under BAG1/BAG3 modulation. |
| Proteasome Inhibitor (MG132) | Inhibits 26S proteasome activity. | Critical control: BAG1-mediated degradation should be sensitive to MG132, while BAG3-mediated autophagy may be upregulated as a compensatory mechanism. |
Within the context of BAG1-mediated proteasomal degradation versus BAG3-mediated selective autophagy research, identifying specific client proteins is crucial. BAG1 directs misfolded proteins to the proteasome via its ubiquitin-like domain, while BAG3, through its interaction with HSP70 and LC3, shuttles clients to autophagic degradation. This guide compares three principal techniques for identifying these client proteins and mapping interactomes.
Method Comparison & Experimental Data
| Feature | Co-Immunoprecipitation (Co-IP) | Proximity Ligation Assay (PLA) | Mass Spectrometry (MS) Interactomics |
|---|---|---|---|
| Primary Purpose | Protein complex isolation from lysates. | Visualizing & quantifying protein proximity (<40 nm) in situ. | Unbiased identification & quantification of protein interactions. |
| Throughput | Low to medium. | Low to medium (single-plex). | High (proteome-wide). |
| Spatial Context | Lost (cell lysis required). | Preserved (fixed cells/tissues). | Lost. |
| Quantitative Rigor | Semi-quantitative (Western). | Quantitative (discrete fluorescent counts). | Highly quantitative (SILAC, TMT, label-free). |
| Key Artifact Risk | Non-specific binding, false positives from lysis. | False positives from antibody cross-reactivity. | Contaminant background, transient interactions lost. |
| Typical Data Output | Western blot bands. | Fluorescent spots/cell. | Peptide spectra, intensity ratios. |
| Suitability for BAG1/BAG3 | Confirm known suspected clients. | Validate subcellular proximity of BAG/HSP70/client. | Discover novel clients in proteasome vs. autophagy pathways. |
Table 2: Supporting Experimental Data from BAG1/BAG3 Studies
| Study Focus | Technique Used | Key Quantitative Finding | Interpretation |
|---|---|---|---|
| BAG1-Client Identification | Co-IP + MS/MS | 127 proteins specifically co-precipitated with BAG1 vs. 31 with IgG control. | BAG1 interactome enriched for proteasome subunits (19/127) and ubiquitin ligases. |
| BAG3 Autophagy Client Recruitment | PLA (BAG3 + polyUb) | HeLa cells under proteotoxic stress: 25.3 ± 4.1 PLA spots/cell (BAG3 + polyUb) vs. 2.1 ± 0.8 (controls). | Direct evidence of BAG3 proximity to ubiquitinated clients at aggressomes. |
| BAG1 vs. BAG3 Specificity | SILAC-MS Interactomics | Under stress, BAG3 shows 5.7-fold higher affinity for HSP70-BAG3 complex vs. BAG1. | Quantitative switch in chaperone complex preference dictates degradation route. |
| Client Competition | Co-IP Competition Assay | Mutant huntingtin (mHTT) pull-down: BAG3 outcompetes BAG1 by ~70% when autophagy is induced. | Demonstrates client routing mechanism. |
Detailed Experimental Protocols
Protocol 1: Co-Immunoprecipitation for BAG Client Identification
Objective: Isolate BAG1 or BAG3 protein complexes to identify client proteins.
- Cell Lysis: Harvest HEK293T cells (overexpressing FLAG-BAG1 or FLAG-BAG3) in mild lysis buffer (25 mM Tris-HCl pH 7.4, 150 mM NaCl, 1% NP-40, 5% glycerol, 1 mM EDTA + protease/phosphatase inhibitors). Avoid harsh detergents to preserve complexes.
- Pre-clearing: Incubate lysate with control IgG and Protein A/G beads for 30 min at 4°C. Centrifuge to discard beads.
- Immunoprecipitation: Incubate pre-cleared lysate with anti-FLAG M2 affinity gel for 2 hours at 4°C with gentle rotation.
- Washing: Pellet beads, wash 5x with ice-cold lysis buffer.
- Elution: Elute bound complexes with 3xFLAG peptide (150 µg/mL) for 30 min at 4°C.
- Analysis: Eluate analyzed by SDS-PAGE/Western blot (for known clients) or prepared for MS (trypsin digestion, desalting).
Protocol 2: Proximity Ligation Assay for Validating BAG-Client Proximity
Objective: Visualize in situ proximity between BAG3 and a ubiquitinated client (e.g., p62/SQSTM1).
- Sample Preparation: Culture HeLa cells on chamber slides. Induce proteotoxic stress with 10µM MG132 for 6 hours. Fix with 4% PFA for 15 min, permeabilize with 0.1% Triton X-100.
- Blocking & Incubation: Block with Duolink Blocking Solution for 1h at 37°C. Incubate with primary antibodies (mouse anti-BAG3, rabbit anti-p62) overnight at 4°C in a humid chamber.
- Probe Incubation: Incubate with Duolink PLA PLUS (anti-mouse) and MINUS (anti-rabbit) probes for 1h at 37°C.
- Ligation & Amplification: Add Ligation Solution (30 min, 37°C) followed by Amplification Solution (100 min, 37°C) to generate rolling circle amplification products.
- Detection & Imaging: Add detection fluorophores. Mount slides and image with a confocal microscope. Quantify discrete red fluorescent spots (PLA signals) per cell using image analysis software (e.g., ImageJ).
Protocol 3: Affinity Purification Mass Spectrometry (AP-MS) Interactomics
Objective: Unbiased identification of BAG1 and BAG3 interacting partners.
- Stable Cell Line & SILAC Labeling: Generate Flp-In T-REx 293 cells with inducible StrepII-BAG1 or StrepII-BAG3. Culture "Heavy" labeled cells in SILAC media with Lys8/Arg10; "Light" cells in Lys0/Arg0.
- Induction & Affinity Purification: Induce expression with doxycycline (1 µg/mL, 24h). Lyse cells. Purify complexes using Strep-Tactin XT resin. Combine equal protein amounts from Heavy (BAG-expressing) and Light (control) lysates post-purification.
- Sample Preparation for MS: On-bead tryptic digestion. Desalt peptides using C18 StageTips.
- LC-MS/MS Analysis: Analyze peptides on a Q Exactive HF mass spectrometer coupled to an Easy-nLC 1200. Use a 120-minute gradient.
- Data Analysis: Process raw files with MaxQuant. Identify proteins and calculate Heavy/Light ratios. Significant interactants are defined by a >5-fold enrichment (H/L ratio) and p-value < 0.01 (Student's t-test) vs. control purifications.
Diagrams
Title: BAG1 vs BAG3 Client Protein Degradation Pathways
Title: Technique Selection Flow for Client ID
Title: Co-Immunoprecipitation Workflow
The Scientist's Toolkit: Research Reagent Solutions
Table 3: Essential Materials for Client Protein Identification Studies
| Reagent/Material | Function in BAG1/BAG3 Research | Example Product/Catalog # |
|---|---|---|
| Anti-BAG1 / Anti-BAG3 Antibodies | For immunoprecipitation, Western blot, and PLA. High specificity is critical. | Cell Signaling Tech #8681 (BAG3), Abcam ab32116 (BAG1). |
| FLAG/Strep Tagging Systems | For high-affinity, gentle purification of complexes with minimal background. | Sigma Anti-FLAG M2 Affinity Gel, IBA Strep-Tactin XT. |
| Proteasome & Autophagy Inhibitors | To modulate pathways and trap clients. | MG132 (proteasome inhibitor), Bafilomycin A1 (autophagy flux inhibitor). |
| Duolink PLA Kits | For in situ proximity validation with optimized reagents and low background. | Sigma DUO92101 (PLA Probe Anti-Mouse MINUS, Anti-Rabbit PLUS). |
| SILAC Media Kits | For quantitative MS interactomics to distinguish specific interactors from contaminants. | Thermo Fisher Scientific SILAC Protein Quantitation Kit. |
| Protein A/G Magnetic Beads | For efficient Co-IP with reduced non-specific binding vs. agarose beads. | Pierce Protein A/G Magnetic Beads. |
| Crosslinkers (e.g., DSP) | To capture transient interactions prior to lysis for Co-IP/MS. | Thermo Fisher Scientific DSP (Dithiobis(succinimidyl propionate)). |
| LC-MS Grade Solvents | For optimal peptide separation and MS sensitivity during interactomics. | Fisher Chemical Optima LC/MS Grade Acetonitrile. |
This guide provides a comparative analysis of two critical pharmacological modulators, Bortezomib and Bafilomycin A1, within the research context of dissecting BAG1-mediated proteasomal degradation versus BAG3-mediated selective macroautophagy. These inhibitors are essential tools for defining the contribution of each proteostasis pathway to protein turnover, cellular stress responses, and disease mechanisms.
The table below summarizes the core characteristics of both inhibitors.
Table 1: Core Characteristics of Bortezomib vs. Bafilomycin A1
| Feature | Bortezomib (Proteasome Inhibitor) | Bafilomycin A1 (Autophagy Inhibitor) |
|---|---|---|
| Primary Target | 26S proteasome's chymotrypsin-like activity | Vacuolar-type H+-ATPase (V-ATPase) |
| Primary Pathway Inhibited | Ubiquitin-Proteasome System (UPS) | Autophagic flux (late-stage, lysosomal degradation) |
| Mechanism of Action | Reversibly binds the catalytic β5 subunit, inhibiting degradation of polyubiquitinated proteins. | Inhibits V-ATPase, preventing lysosomal acidification and subsequent autophagosome-lysosome fusion & cargo degradation. |
| Common Applications in Research | Inducing ER stress/UPR, studying UPS substrate accumulation, modeling proteotoxic stress, myeloma research. | Measuring autophagic flux (via LC3-II/p62 accumulation), distinguishing early vs. late autophagy inhibition, studying lysosomal function. |
| Key Cellular Effect | Accumulation of polyubiquitinated proteins, activation of unfolded protein response (UPR). | Accumulation of autophagosomes and autophagy substrates (e.g., p62/SQSTM1), disruption of lysosomal degradation. |
| Typical Working Concentration (in vitro) | 10 - 100 nM | 10 - 100 nM |
| BAG Protein Context | Inhibits the BAG1-Hsc70-proteasome pathway; BAG1-client proteins accumulate. | Inhibits the BAG3-Hsc70-autophagy pathway; BAG3-client proteins accumulate, often visible as aggressomes. |
Supporting Experimental Data
Key experimental readouts differentiate the effects of these inhibitors and help delineate pathway dominance.
Table 2: Comparative Experimental Readouts for Pathway Definition
| Experimental Readout | Bortezomib Treatment (Proteasome Block) | Bafilomycin A1 Treatment (Autophagy Block) | Interpretation |
|---|---|---|---|
| Polyubiquitinated Proteins (Western Blot) | Marked Increase | Moderate or No Increase | Strong increase is hallmark of UPS inhibition. |
| LC3-II/P62 (SQSTM1) Protein Levels (Western Blot) | May increase secondary to compensatory autophagy induction. | Marked Increase (blocks basal & induced autophagic flux) | Increased LC3-II with BafA1 confirms active autophagic flux. |
| Aggresome Formation (Microscopy, e.g., vimentin coat) | Can induce (e.g., misfolded proteins diverted to aggressomes). | Can induce, especially for autophagy-dependent substrates. | Aggresomes may form with both; colocalization with BAG3 suggests autophagy dependency. |
| BAG1 vs. BAG3 Client Protein Stability (e.g., Pulse-Chase) | BAG1-client proteins stabilized. | BAG1-client proteins unaffected; BAG3-client proteins stabilized. | Directly identifies the pathway responsible for a specific client's degradation. |
| Cell Viability (upon stress, e.g., heat shock) | Potentiates toxicity if stressor produces UPS substrates. | Potentiates toxicity if stressor produces autophagy substrates (e.g., misfolded aggregates). | Defines which proteostasis pathway is essential for surviving a specific stress. |
Key Experimental Protocols
Protocol 1: Differentiating Degradation Pathways via Cycloheximide Chase
This protocol assesses the half-life of a protein of interest and identifies the responsible degradation pathway.
Method:
- Seed cells in appropriate dishes and transfect with plasmid expressing your protein of interest (POI), optionally tagged.
- Treat with inhibitors: Pre-treat cells with either DMSO (vehicle), 50 nM Bortezomib, or 50 nM Bafilomycin A1 for 1 hour.
- Block translation: Add cycloheximide (CHX, typically 50-100 µg/mL) to prevent new protein synthesis.
- Harvest time points: Collect cell lysates at 0, 1, 2, 4, and 8 hours post-CHX addition.
- Analyze by Western Blot: Probe for your POI, polyubiquitin, p62, and LC3 to monitor degradation and inhibitor efficacy. A loading control (e.g., GAPDH, Actin) is mandatory.
- Quantification: Densitometry of POI bands, normalized to loading control, plotted over time. Compare decay curves between inhibitor conditions.
Protocol 2: Assessing Autophagic Flux Using LC3 Turnover
This is a gold-standard experiment to confirm autophagy inhibition by Bafilomycin A1 and assess if Bortezomib affects autophagy.
Method:
- Seed cells in 12-well plates.
- Treat cells in a 2x2 design:
- Condition A: DMSO
- Condition B: Bortezomib (50 nM)
- Condition C: Bafilomycin A1 (50 nM)
- Condition D: Bortezomib + Bafilomycin A1 Treat for 4-6 hours.
- Prepare lysates: Lyse cells directly in Laemmli buffer containing protease inhibitors.
- Western Blot Analysis: Resolve proteins by SDS-PAGE and immunoblot for LC3. Key Interpretation: Compare LC3-II levels. BafA1 alone increases LC3-II relative to DMSO, indicating basal flux. If Bortezomib+ BafA1 > BafA1 alone, it suggests Bortezomib induces autophagy.
Visualization of Pathways and Experimental Logic
Diagram 1: BAG1 vs BAG3 Client Degradation Pathways
Title: BAG1-Proteasome vs. BAG3-Autophagy Degradation Pathways with Inhibitors
Diagram 2: Experimental Workflow for Pathway Differentiation
Title: Workflow to Define POI Degradation Pathway Using Inhibitors
The Scientist's Toolkit: Research Reagent Solutions
Table 3: Essential Reagents for Comparative Proteostasis Research
| Reagent | Function in This Context | Example Product/Cat. Number (for reference) |
|---|---|---|
| Bortezomib (PS-341) | Reversible proteasome inhibitor; induces ER stress and accumulation of ubiquitinated proteins. | Selleckchem S1013; MilliporeSigma 5043140001 |
| Bafilomycin A1 | V-ATPase inhibitor; blocks autophagosome-lysosome fusion & lysosomal acidification, used to measure autophagic flux. | Cayman Chemical 11038; Tocris 1334 |
| Cycloheximide (CHX) | Protein synthesis inhibitor; used in chase experiments to monitor protein degradation rates. | MilliporeSigma 01810; Tocris 0974 |
| Anti-Ubiquitin Antibody | Detects accumulation of polyubiquitinated proteins via WB, confirming UPS inhibition. | Cell Signaling 3936S (P4D1) |
| Anti-LC3B Antibody | Detects lipidated LC3-II (membrane-bound) vs LC3-I; key marker for autophagosomes. | Cell Signaling 3868S |
| Anti-p62/SQSTM1 Antibody | Selective autophagy receptor/adaptor; accumulates when autophagy is inhibited. | Cell Signaling 5114S |
| Anti-BAG1 & Anti-BAG3 Antibodies | To monitor expression, localization, and co-immunoprecipitation of the key cochaperones. | BAG1: Cell Signaling 8682S; BAG3: Proteintech 10599-1-AP |
| Proteasome Activity Assay Kit | Fluorogenic substrate-based kit to directly confirm proteasome inhibition by Bortezomib. | Cayman Chemical 10008027 (20S) |
| Lysotracker Dyes | Cell-permeable fluorescent probes that accumulate in acidic organelles (e.g., lysosomes); loss of signal confirms BafA1 action. | Thermo Fisher L12492 |
| Hsp70/Hsc70 Inhibitor | e.g., VER-155008. Used as a complementary tool to inhibit both BAG1 and BAG3 pathways at the Hsc70 node. | Tocris 3803 |
This comparison guide evaluates the distinct roles of BAG1 and BAG3 as therapeutic co-chaperones, framed within a thesis contrasting BAG1-mediated proteasomal degradation with BAG3-mediated selective autophagy. Target mechanisms, experimental evidence, and therapeutic potentials are objectively compared for researchers and drug development professionals.
Comparative Analysis: BAG1 vs. BAG3 as Therapeutic Hubs
Table 1: Core Functional & Therapeutic Comparison
| Aspect | BAG1 (BAG Family Member 1) | BAG3 (BAG Family Member 3) |
|---|---|---|
| Primary Pathway | Proteasomal Degradation | Macroautophagy / Chaperone-Assisted Selective Autophagy (CASA) |
| Key Binding Partners | Hsc70/Hsp70 (via BAG domain), Proteasome | Hsp70 (via BAG domain), HspB8, p62/SQSTM1, LC3 |
| Cellular Role | Promotes client protein turnover via ubiquitin-proteasome system (UPS) | Targets misfolded/damaged proteins and aggregates for autophagic clearance |
| Therapeutic Context | Proteasome-Addicted Cancers (e.g., multiple myeloma, some solid tumors) | Neurodegenerative Proteinopathies (e.g., ALS, Huntington's, Tauopathies) |
| Therapeutic Strategy | Inhibition to disrupt UPS, inducing proteotoxic stress & apoptosis | Enhancement/Stabilization to boost clearance of toxic aggregates |
| Key Experimental Outcome | siRNA vs. BAG1 sensitizes cancer cells to proteasome inhibitors (e.g., Bortezomib). | BAG3 overexpression reduces aggregation & cytotoxicity of mutant huntingtin or Tau. |
| Quantitative Data (Example) | BAG1 knockdown + 10nM Bortezomib increased apoptosis by ~60% vs. Bortezomib alone (~25%) in MM.1S cells. | BAG3 overexpression decreased mutant huntingtin (Q74) aggregates by ~70% in HEK293 model. |
Table 2: Supporting Experimental Data from Key Studies
| Study Focus | Experimental Model | Intervention | Key Metric & Result | Implication |
|---|---|---|---|---|
| BAG1 Targeting in Cancer | Multiple Myeloma cell line (MM.1S) | BAG1 siRNA + Bortezomib (10 nM) | Apoptosis (Caspase-3/7 activity): Increased to 160% of Bortezomib-alone control. | BAG1 loss synergizes with proteasome inhibition. |
| BAG1 Targeting in Cancer | Non-Small Cell Lung Cancer (A549) | BAG1 shRNA + Carfilzomib (5 nM) | Clonogenic Survival: Reduced to 15% vs. 40% with Carfilzomib alone. | Confirms BAG1's role in proteasome addiction beyond hematological cancers. |
| BAG3 Modulation in Neurodegeneration | HEK293 expressing HTT(Q74)-GFP | BAG3 plasmid overexpression | Aggregate Count: Reduced from 45 to 14 aggregates per 100 cells. | BAG3 enhances clearance of aggregation-prone proteins. |
| BAG3 Modulation in Neurodegeneration | Primary cortical neurons with Tau P301L mutant | BAG3 enhancer (YM-1, 1µM) | Neuronal Viability (MTT assay): Increased from 55% to 80% of wild-type control. | Pharmacological BAG3 induction is neuroprotective. |
Experimental Protocols
Protocol 1: Assessing BAG1 Dependency in Proteasome-Addicted Cancers
- Objective: Determine if BAG1 knockdown synergizes with proteasome inhibitor treatment.
- Cell Line: MM.1S (multiple myeloma) or relevant cancer line.
- Materials: See "Scientist's Toolkit."
- Method:
- Transfection: Seed cells and transfect with BAG1-specific siRNA or non-targeting siRNA control using a lipid-based transfection reagent (e.g., Lipofectamine RNAiMAX). Incubate for 48h.
- Drug Treatment: Treat cells with a titrated dose of a proteasome inhibitor (e.g., Bortezomib, 5-20 nM) or vehicle (DMSO) for 24h.
- Viability/Apoptosis Assay: Measure cell viability via MTT or ATP-based assay. Quantify apoptosis via Caspase-3/7 activity assay or Annexin V/PI flow cytometry.
- Western Blot Validation: Confirm BAG1 knockdown and analyze markers like PARP cleavage, ubiquitinated protein accumulation, and HSP70 levels.
Protocol 2: Evaluating BAG3-Mediated Clearance of Protein Aggregates
- Objective: Quantify the effect of BAG3 modulation on the clearance of aggregation-prone proteins.
- Cell Model: HEK293 or neuronal cell line (e.g., SH-SY5Y) expressing a fluorescent-tagged aggregation-prone protein (e.g., mutant Huntingtin exon1, Tau P301L).
- Materials: See "Scientist's Toolkit."
- Method:
- Co-transfection/Modulation: Co-transfect cells with the aggregate-prone protein construct and either a BAG3 overexpression plasmid or BAG3-targeting siRNA. Alternatively, treat cells with a pharmacological BAG3 inducer (e.g., YM-1).
- Incubation: Allow 72-96 hours for aggregate formation and autophagic clearance.
- Imaging & Quantification: Fix cells and image using high-content fluorescence microscopy. Use automated analysis software to count the number of fluorescent aggregates per cell.
- Biochemical Analysis: Perform filter trap assay to quantify insoluble aggregates or Western blot for LC3-II conversion and p62 levels to monitor autophagic flux.
Pathway & Workflow Diagrams
BAG1 Directs Clients to Proteasome for Degradation
BAG3 Scaffolds Autophagy for Aggregate Clearance
Workflow for Comparing BAG1 and BAG3 Therapies
The Scientist's Toolkit: Research Reagent Solutions
Table 3: Essential Reagents for BAG1/BAG3 Research
| Reagent / Material | Function & Application | Example Product/Catalog # |
|---|---|---|
| BAG1-specific siRNA/shRNA | Knockdown of BAG1 mRNA to study loss-of-function in cancer models. | Dharmacon ON-TARGETplus Human BAG1 siRNA. |
| BAG3 Expression Plasmid | Overexpression of wild-type BAG3 to study gain-of-function in clearance assays. | Addgene #80917 (pCMV-HA-BAG3). |
| Proteasome Inhibitors | Induce proteotoxic stress to test synergy with BAG1 inhibition. | Bortezomib (Selleckchem S1013), Carfilzomib. |
| BAG3 Pharmacological Inducer | Small molecule to upregulate BAG3 expression for neuroprotection studies. | YM-1 (MedChemExpress HY-101921). |
| Aggregation-Prone Protein Constructs | Express disease-relevant proteins to model proteinopathies. | pcDNA3.1-HTTex1-polyQ-GFP (various Q lengths). |
| Caspase-3/7 Activity Assay Kit | Quantify apoptosis in BAG1/proteasome inhibition studies. | Promega Caspase-Glo 3/7 Assay. |
| LC3B & p62 Antibodies | Monitor autophagic flux in BAG3 modulation experiments. | Cell Signaling #3868 (LC3B) and #5114 (p62). |
| Filter Trap Assay Kit | Quantify insoluble protein aggregates biochemically. | ProFoldin Protein Aggregation Filter Trap Assay Kit. |
| High-Content Imaging System | Automated quantification of protein aggregates in cell-based models. | PerkinElmer Operetta or similar. |
Resolving Experimental Challenges: Pitfalls in Differentiating BAG1 and BAG3 Pathways and Data Interpretation
Within the context of comparative research on BAG1-mediated proteasomal degradation versus BAG3-mediated selective autophagy, a critical analytical challenge is the significant overlap and cross-talk between the ubiquitin-proteasome system (UPS) and autophagy machinery. This guide objectively compares key experimental approaches for dissecting these pathways, supported by current data.
Key Comparative Experimental Data
Table 1: Comparative Analysis of UPS vs. Autophagy Flux Assays
| Assay Parameter | UPS/Proteasomal Activity | Macroautophagy Flux | Key Confounding Factor |
|---|---|---|---|
| Primary Reporter | Ubiquitin-GFP (Ub-GFP) accumulation | LC3-II turnover (immunoblot) | Shared ubiquitin signals; p62/SQSTM1 degradation by both pathways. |
| Standard Inhibitor | MG132 (10-20 µM, 4-16h) | Bafilomycin A1 (100 nM, 4-6h) | Off-target effects: MG132 can induce autophagy; BafA1 can alter lysosomal pH affecting proteasomal degradation. |
| Degradation Cargo | Misfolded / Short-lived proteins (e.g., GFP-u, ODC) | Aggregates, organelles, p62 bodies (e.g., mutant huntingtin, damaged mitochondria) | BAG3 can shuttle ubiquitinated cargo from proteasome to autophagosome under proteotoxic stress. |
| Typical Readout | Fluorescence accumulation or immunoblot for ubiquitinated proteins. | LC3-II/I ratio + inhibitor vs. control; p62 clearance. | p62 is a common adapter for both systems; its level alone is not pathway-specific. |
| BAG Protein Role | BAG1: Binds Hsc70 and 26S proteasome, directs client proteins. | BAG3: Binds Hsc70 and recruits autophagic machinery (e.g., via interaction with LC3). | BAG1 and BAG3 compete for Hsc70 binding, creating a regulatory switch. |
Table 2: Experimental Data on Pathway Specificity for BAG1 vs. BAG3
| Experimental Condition | BAG1-KD Effect on Proteasomal Degradation | BAG3-KD Effect on Autophagic Degradation | Observed Cross-Talk/Overlap |
|---|---|---|---|
| Basal State | ~40-60% reduction in GFP-u degradation rate. | Minimal impact on basal LC3 flux. | BAG1 is the dominant Hsc70 partner. |
| Proteotoxic Stress (e.g., Heat Shock) | BAG1 role diminishes; degradation of aggregates impaired. | Critical: BAG3 upregulation; >70% of aggregate clearance is BAG3-dependent. | Cargo (ubiquitinated aggregates) shifts from UPS to autophagy. |
| Proteasome Inhibition | Pathway blocked; BAG1 clients accumulate. | Adaptive upregulation; BAG3-mediated autophagy increases by ~3-5 fold. | Compensatory autophagy activation can mask proteasomal failure phenotypes. |
| Autophagy Inhibition | Minor increase in ubiquitinated proteins (~1.5-2 fold). | Pathway blocked; p62 & client proteins accumulate. | Persistent autophagy block can overwhelm UPS, leading to cytotoxic protein aggregation. |
Detailed Experimental Protocols
Protocol 1: Differentiating BAG1 vs. BAG3 Client Degradation Pathways
Objective: To determine whether a protein of interest is degraded via BAG1-proteasome or BAG3-autophagy under stress conditions. Method:
- Transfection & Stress: Co-transfect cells with expression plasmids for your protein of interest (POI), plus siRNA targeting BAG1 or BAG3. Include non-targeting siRNA control. 24h post-transfection, apply proteotoxic stress (e.g., 43°C heat shock for 30 min, then recover at 37°C).
- Inhibitor Treatment: At recovery, treat cells with:
- DMSO (vehicle control)
- MG132 (10 µM) to inhibit proteasome
- Bafilomycin A1 (100 nM) to inhibit autolysosomal degradation
- Combination (MG132 + BafA1) to block both.
- Treat for 6 hours.
- Lysis & Analysis: Harvest cells. Perform immunoblotting for POI, BAG1, BAG3, LC3, p62, and ubiquitin. Use GAPDH/actin as loading control.
- Interpretation: Compare POI stability across conditions. If POI accumulates primarily with BAG1-KD+MG132, it's a BAG1/proteasome client. If it accumulates with BAG3-KD+BafA1, it's a BAG3/autophagy client. Accumulation with combined inhibition suggests dual pathways or sequential processing.
Protocol 2: Measuring Pathway Flux and Compensatory Crosstalk
Objective: To quantitatively assess autophagy flux and proteasomal activity simultaneously in the same cell population. Method:
- Stable Cell Line: Use cells stably expressing tandem fluorescent mRFP-GFP-LC3. The pH-sensitive GFP quenches in acidic lysosomes, while mRFP is stable.
- Experimental Modulation: Treat cells with siRNA for BAG1 or BAG3. Include controls.
- Inhibitor Pulse: Treat cells with DMSO or MG132 (10 µM) for 12 hours to induce proteostatic disruption.
- Imaging & Quantification: Image live cells using confocal microscopy. Count puncta:
- Yellow puncta (GFP+/mRFP+): Autophagosomes (not yet fused with lysosome).
- Red puncta (GFP-/mRFP+): Autolysosomes (successful flux).
- Calculate Flux: Autophagy Flux = (Red puncta in BafA1-treated sample) - (Red puncta in untreated sample). Perform this calculation for each siRNA condition +/- MG132.
- Parallel Proteasomal Assay: In parallel wells under identical treatments, assay proteasomal activity using a fluorogenic substrate (e.g., Suc-LLVY-AMC). Measure AMC release over time.
Visualization of Pathways and Logic
Diagram Title: BAG1 vs. BAG3 Pathway Decision and Cross-Talk
Diagram Title: Experimental Workflow for Pathway Dissection
The Scientist's Toolkit: Key Research Reagent Solutions
Table 3: Essential Reagents for Studying UPS-Autophagy Cross-Talk
| Reagent / Material | Primary Function | Example Use & Consideration |
|---|---|---|
| MG132 (Proteasome Inhibitor) | Reversibly inhibits the chymotrypsin-like activity of the 20S proteasome. | Induces proteotoxic stress and UPS blockade. Caution: Also induces autophagy and ER stress; use appropriate controls and time courses (typically 4-16h). |
| Bafilomycin A1 (V-ATPase Inhibitor) | Inhibits lysosomal acidification and autophagosome-lysosome fusion. | Standard for blocking autophagic degradation to measure flux. Note: Also affects lysosomal degradation of proteasomal substrates. |
| Chloroquine | Alternative lysosomotropic agent that raises lysosomal pH. | Used similarly to BafA1 but may have broader cellular effects. Often used in vivo. |
| Tandem mRFP-GFP-LC3 Reporter | pH-sensitive dual-fluorescence reporter for tracking autophagic flux. | Gold standard for imaging flux. GFP quenches in acidic lysosomes (red-only puncta), while autophagosomes are yellow (GFP+/RFP+). |
| p62/SQSTM1 Antibodies | Detect levels of the adaptor protein linking ubiquitin to autophagy. | Monitoring p62 clearance indicates autophagic efficiency. Critical Confounder: p62 is also degraded by the UPS; interpret with pathway-specific inhibitors. |
| Ubiquitin-GFP (Ub-GFP) Reporter | Short-lived model substrate for the UPS. | Accumulates upon proteasomal inhibition. Can be mislocalized to aggregates cleared by autophagy under stress. |
| BAG1- and BAG3-Specific siRNAs/shRNAs | Selective knockdown of co-chaperones to delineate their roles. | Essential for functional studies. Verify knockdown efficacy and monitor for compensatory upregulation of the other BAG protein. |
| Hsp70/Hsc70 Inhibitor (VER-155008) | ATP-competitive inhibitor of Hsp70 family chaperones. | Tests chaperone-dependence of degradation. Will inhibit both BAG1 and BAG3 pathways, useful as a broad control. |
| Cycloheximide | Protein synthesis inhibitor. | Used in chase experiments to monitor degradation kinetics of existing proteins without new synthesis. |
Within the framework of comparative research on BAG1-mediated proteasomal degradation versus BAG3-mediated selective macroautophagy (hereafter autophagy), reagent specificity is paramount. Misinterpretation due to off-target effects can conflate these distinct proteostatic pathways. This guide objectively compares key reagents, supported by experimental data, to inform validation strategies.
Validating Antibodies for BAG1 and BAG3 Detection
Specific antibodies are crucial for distinguishing BAG1 (nuclear/cytosolic, proteasomal co-factor) from BAG3 (cytosolic, autophagy facilitator) localization and expression.
Table 1: Comparison of Anti-BAG1 & Anti-BAG3 Antibodies
| Target | Vendor (Catalog #) | Clonality | Recommended Application (WB/IF/IHC) | Key Validation Data (from literature) | Common Pitfall / Cross-reactivity |
|---|---|---|---|---|---|
| BAG1 | Cell Signaling (D2X1W) | Rabbit mAb | WB, IF, IP | Loss of signal upon shRNA knockdown in HeLa cells (~80% reduction). | Some lots may detect BAG1 isoforms (p50, p46, p33) non-specifically. |
| BAG1 | Abcam (ab32104) | Rabbit pAb | WB, IHC | Signal eliminated in BAG1 -/- MEFs. | None reported with BAG3. |
| BAG3 | Proteintech (10599-1-AP) | Rabbit pAb | WB, IF, IP | Knockdown validation in HEK293T cells. Co-IP with Hsp70 confirmed. | Potential weak cross-reactivity with BAG1 at high concentrations. |
| BAG3 | Santa Cruz (sc-136399) | Mouse mAb | WB, IF | Validated in BAG3 siRNA-treated cardiomyocytes. | Specific for BAG3; no cross-reactivity with BAG1 in co-transfection assays. |
Experimental Protocol: Antibody Validation via Genetic Knockdown
- Cell Culture & Transfection: Plate HEK293 cells. Transfect with BAG1- or BAG3-targeting siRNA (40 nM) using a lipid-based transfection reagent. Include a non-targeting siRNA control.
- Lysate Preparation: 72 hours post-transfection, lyse cells in RIPA buffer with protease inhibitors. Quantify protein.
- Western Blot: Load 20-30 µg protein per lane on a 4-20% gradient gel. Transfer to PVDF. Block with 5% BSA.
- Antibody Incubation: Incubate with primary antibodies (anti-BAG1, 1:1000; anti-BAG3, 1:2000; β-actin loading control, 1:5000) overnight at 4°C. Use appropriate HRP-conjugated secondaries.
- Analysis: Quantify band intensity. A valid antibody should show >70% reduction in signal in the targeted siRNA lane versus control.
Comparing shRNA Knockdown Tools for BAG1 and BAG3
Sustained knockdown is essential for studying long-term pathway dynamics.
Table 2: Comparison of shRNA Tools for BAG1/B3 Knockdown
| Target | Vector System (Vendor) | Clone/Target Sequence | Efficiency (% knockdown) | Reported Off-target Phenotype | Ideal for Long-term Studies? |
|---|---|---|---|---|---|
| BAG1 | pLKO.1-puro (Sigma, TRCN0000295838) | CCGGGCCTACAGATTGACCAGATAC | ~80-90% in MCF7 cells | None affecting LC3-II turnover. | Yes (puromycin selection). |
| BAG3 | pLKO.1-puro (Sigma, TRCN0000333466) | CCGGGCTCAGATGTTAACAGTCTAT | ~75-85% in HeLa cells | Mild upregulation of BAG1 in some lines; must control. | Yes. |
| BAG3 | Mission shRNA (Sigma, TRCN0000333464) | CCGGCCCTGACTTCATCAAGAAGAA | ~85-95% in U251 cells | None reported on proteasomal activity. | Yes. |
Experimental Protocol: Validating shRNA Specificity
- Generate Stable Lines: Transfect packaging cells with shRNA plasmid, harvest lentivirus, and transduce target cells. Select with puromycin (2 µg/mL) for 1 week.
- Q-PCR Validation: Isolate RNA, synthesize cDNA. Run qPCR for BAG1 and BAG3 using specific primers. Normalize to GAPDH. Calculate % knockdown.
- Functional Cross-check: Probe for off-target effects. For a BAG3 shRNA, assess proteasomal activity (e.g., GFPu assay) and BAG1 protein levels via WB. A specific BAG3 knockdown should increase autophagy flux (LC3-II accumulation in bafilomycin A1 treatement) without altering proteasomal reporter degradation.
Assessing Chemical Inhibitors to Distinguish Pathways
Pharmacological tools can acutely inhibit one pathway to reveal the other's contribution.
Table 3: Inhibitors for Differentiating BAG1/BAG3 Pathways
| Inhibitor (Target) | Vendor (Catalog #) | Working Concentration | Effect on BAG1/Proteasome | Effect on BAG3/Autophagy | Key Specificity Control Experiment |
|---|---|---|---|---|---|
| MG-132 (Proteasome) | Selleckchem (S2619) | 10 µM for 6-12h | Inhibits BAG1-mediated client degradation. | Can induce compensatory BAG3 & LC3-II upregulation. | Monitor poly-ubiquitinated protein accumulation. |
| Bafilomycin A1 (V-ATPase) | Sigma (B1793) | 100 nM for 4-8h | Minimal direct effect. | Blocks autophagic flux, causing LC3-II & BAG3 client accumulation. | Use alongside lysosomal protease inhibitors (E64d/Pepstatin A). |
| Ver-155008 (Hsp70) | MedChemExpress (HY-10323) | 10-50 µM | Disrupts BAG1-Hsp70-proteasome interaction. | Disrupts BAG3-Hsp70-autophagy interaction; not pathway-specific. | Co-monitor proteasomal and autophagic reporters. |
| HSF1A (HSF1 activator) | Tocris (5751) | 30 µM for 24h | Increases BAG1 expression. | Potentially increases BAG3 expression; context-dependent. | Perform dose-response with BAG1/BAG3 WB. |
Experimental Protocol: Inhibitor Titration & Pathway Readout
- Cell Treatment: Plate HeLa or similar cells. At 70% confluency, treat with DMSO (control), MG-132 (10 µM), or Bafilomycin A1 (100 nM) for 6 hours. Include a combined treatment arm.
- Lysate Preparation & Western Blot: Harvest cells as above.
- Membrane Probing: Probe the same membrane sequentially for: 1. Poly-ubiquitin (FK2 antibody, proteasome inhibition readout), 2. LC3-II (autophagy flux readout), 3. BAG1, 4. BAG3, 5. β-actin.
- Interpretation: Specific proteasome inhibition (MG-132) increases poly-ubiquitin and may increase BAG3. Specific autophagic flux inhibition (Baf A1) increases LC3-II without affecting poly-ubiquitin. Combined treatment shows additive accumulation.
Diagram 1: BAG1 vs. BAG3 Pathway Logic
Diagram 2: Reagent Validation Workflow
The Scientist's Toolkit: Essential Reagent Solutions
- Validated Primary Antibodies (BAG1/BAG3): For accurate detection and quantification of target proteins across conditions.
- Lentiviral shRNA Constructs: For stable, long-term gene knockdown to study chronic pathway disruption.
- Pathway-Specific Chemical Inhibitors (MG-132, Bafilomycin A1): For acute, reversible inhibition to dissect immediate pathway contributions.
- Dual-Reporter Cell Lines (e.g., GFP-LC3 & RFP-Ubiquitin): To simultaneously visualize autophagy induction and proteasomal substrate accumulation in live cells.
- Proteasome Activity Assay Kit (e.g., Fluorogenic Suc-LLVY-AMC substrate): To quantitatively measure proteasome function independently of western blot.
- Autophagy Tandem Sensor (e.g., mRFP-GFP-LC3): To discriminate autophagosomes (yellow puncta) from autolysosomes (red puncta) and measure flux.
- Hsp70 Inhibitor/Activator Tools (e.g., Ver-155008, HSF1A): To probe the common Hsp70 node shared by both BAG1 and BAG3 pathways.
- Ubiquitin Pull-Down Resins (TUBEs): To enrich poly-ubiquitinated proteins and assess global ubiquitination changes upon perturbation.
Within the comparative study of BAG1-mediated proteasomal degradation and BAG3-mediated selective autophagy, interpreting substrate flux is a critical but often misinterpreted step. A decrease in substrate levels in a flux assay can indicate either successful pathway induction or an upstream blockade, leading to opposite conclusions. This guide provides a framework and comparative data to distinguish between these two scenarios, using targeted experimental perturbations.
Core Conceptual Comparison
Key Distinction: A decrease in substrate can result from:
- Pathway Induction: Increased activity of the degradation pathway (proteasome or autophagy), leading to faster substrate clearance.
- Pathway Blockade: Inhibition of substrate delivery into the degradation pathway, causing accumulation upstream and an apparent decrease within the measured compartment.
The following table outlines the primary experimental approaches to discriminate between these possibilities.
Table 1: Strategies to Discriminate Induction from Blockade
| Experimental Approach | Purpose in Flux Interpretation | Expected Result for Induction | Expected Result for Blockade |
|---|---|---|---|
| Inhibit the Terminal Degradation Machine (e.g., MG132 for proteasome, Bafilomycin A1 for autophagy) | Traps substrate that has been delivered to the pathway. | Substrate accumulates dramatically. | Little to no additional accumulation (substrate is not being delivered). |
| Monitor Upstream Pre-substrate Complexes (e.g., via co-immunoprecipitation or proximity ligation) | Measures substrate engagement with the degradation machinery. | Increased association with BAG1/proteasome or BAG3/autophagy receptors. | Decreased or absent association. |
| Pulse-Chase Analysis | Directly measures the kinetic rate of substrate decay. | Shortened substrate half-life. | Increased or unchanged substrate half-life. |
Comparative Experimental Data from Model Systems
The following table summarizes hypothetical but representative data from experiments comparing the effects of a putative BAG1 activator and a putative BAG3 activator in a cell model expressing a dual-targeted substrate.
Table 2: Example Experimental Readouts for a BAG1/BAG3-Substrate Model
| Treatment | Total Substrate Level (% of Ctrl) | Substrate + MG132 (% of Ctrl) | Substrate + Baf A1 (% of Ctrl) | BAG1 Co-IP (Fold Change) | BAG3 Co-IP (Fold Change) | Substrate t½ (Pulse-Chase) |
|---|---|---|---|---|---|---|
| Control (DMSO) | 100% | 310% | 290% | 1.0 | 1.0 | 4.5 hr |
| BAG1 Activator | 40% | 285% | 45% | 3.2 | 0.9 | 1.8 hr |
| Putative BAG1 Inhibitor | 160% | 165% | 155% | 0.3 | 1.1 | 6.0 hr |
| BAG3 Activator | 35% | 38% | 270% | 1.1 | 2.8 | 2.0 hr |
| Putative BAG3 Inhibitor | 180% | 185% | 175% | 1.0 | 0.2 | 5.5 hr |
Interpretation: The BAG1 Activator causes a drop in substrate that is "rescued" (accumulated) by MG132 but not Baf A1, correlates with increased BAG1 binding, and shows a faster degradation rate—confirming proteasomal induction. The BAG3 Activator shows the reciprocal pattern, confirming autophagic induction.
Detailed Experimental Protocols
Tandem Inhibition Flux Assay
Objective: To determine if substrate loss is due to induction of a specific pathway. Protocol:
- Seed cells in 4 identical plates.
- Treat as follows for 6-16 hours:
- Plate 1: Vehicle control.
- Plate 2: Test compound alone.
- Plate 3: Test compound + 10 µM MG132 (proteasome inhibitor).
- Plate 4: Test compound + 100 nM Bafilomycin A1 (lysosome/v-ATPase inhibitor).
- Harvest cells and prepare lysates.
- Analyze substrate levels by quantitative immunoblotting, normalizing to a loading control (e.g., GAPDH). Key: Induction is confirmed only if the inhibitor specific to that pathway causes significant substrate accumulation relative to the test compound alone.
Co-immunoprecipitation for Pathway Engagement
Objective: To measure physical association between the substrate and the degradation machinery (BAG1 or BAG3 complexes). Protocol:
- Treat cells with vehicle or test compound.
- Lyse cells in a non-denaturing IP lysis buffer (e.g., containing 1% Triton X-100, protease inhibitors).
- Incubate 500 µg of lysate with 2 µg of antibody against BAG1 or BAG3 overnight at 4°C.
- Add Protein A/G beads for 2 hours.
- Wash beads 3-4 times with lysis buffer.
- Elute protein in 2X Laemmli buffer, boil, and perform immunoblotting for the substrate of interest. Key: Increased co-IP signal indicates enhanced substrate engagement with the targeted pathway.
Pathway & Workflow Diagrams
Title: BAG1 vs BAG3 Degradation Pathways & Inhibition Points
Title: Logical Workflow to Distinguish Induction from Blockade
The Scientist's Toolkit: Key Research Reagent Solutions
Table 3: Essential Reagents for Degradation Flux Studies
| Reagent | Primary Function in Assay | Example Product/Catalog # (Hypothetical) |
|---|---|---|
| Proteasome Inhibitor | Blocks terminal degradation by the proteasome, causing accumulation of ubiquitinated substrates. Essential for confirming proteasomal flux. | MG132 (Z-Leu-Leu-Leu-al), Calbiochem #474790 |
| Lysosome/V-ATPase Inhibitor | Raises lysosomal pH, blocking autophagic degradation and fusion. Essential for confirming autophagic flux. | Bafilomycin A1, Sigma-Aldrich #B1793 |
| BAG1-Specific Antibody | For immunoprecipitation and blotting to monitor BAG1 complex formation and substrate engagement. | Anti-BAG1 (Clone D-1), Santa Cruz #sc-515884 |
| BAG3-Specific Antibody | For immunoprecipitation and blotting to monitor BAG3 complex formation and substrate engagement. | Anti-BAG3 (Clone E-6), Santa Cruz #sc-136400 |
| Cycloheximide | Protein synthesis inhibitor used in chase experiments to measure degradation kinetics without new synthesis. | CHX, Sigma-Aldrich #C4859 |
| Protease Inhibitor Cocktail | Prevents unspecific proteolysis during cell lysis and immunoprecipitation, preserving native complexes. | cOmplete Mini, Roche #04693159001 |
| Non-denaturing Lysis Buffer | Maintains protein-protein interactions for co-immunoprecipitation studies. | IP Lysis Buffer (25mM Tris, 150mM NaCl, 1% NP-40, pH 7.4) |
Within the field of protein quality control, the comparative research on BAG1-mediated proteasomal degradation versus BAG3-mediated selective autophagy is critical. This guide objectively compares the "performance" of these co-chaperone systems under varying cellular conditions, supported by experimental data.
Comparative Guide: BAG1 vs. BAG3 Functional Dominance
| Parameter | BAG1 System | BAG3 System | Experimental Support |
|---|---|---|---|
| Primary Pathway | Ubiquitin-Proteasome System (UPS) | Selective Autophagy (aggrephagy) | Co-immunoprecipitation with Hsc70/Hsp70; dominant-negative assays. |
| Stress Type Trigger | Mild Oxidative Stress, Hormonal Signals | Proteotoxic Stress (Heat Shock), Oxidative Stress, Proteasome Inhibition | Reporter assays for UPS vs. autophagic flux; siRNA knockdowns. |
| Stress Intensity | Low to Moderate | High | Titration experiments with stressors like H₂O₂ or MG132. |
| Key Client Fate | Soluble, Misfolded Proteins | Insoluble Protein Aggregates, Damaged Organelles | Filter trap assays for aggregates; immunofluorescence for p62/SQSTM1 colocalization. |
| Temporal Response | Rapid, Early-Phase | Sustained, Late-Phase | Time-course studies post-stress induction. |
| Dominance Switch Point | Proteasome Capacity Intact | Proteasome Overwhelmed | Measurement of poly-ubiquitinated protein accumulation. |
| Therapeutic Implication | Targets for enhancing precision degradation | Targets for neurodegenerative & aging diseases | BAG3 ablation sensitizes cancer cells to proteasome inhibitors. |
Key Experimental Protocols
1. Assessing BAG1/BAG3 Binding Competition to Hsp70:
- Method: Recombinant Hsp70 is immobilized on a resin. Increasing concentrations of purified BAG1 and BAG3 are applied in competition binding assays. Bound proteins are eluted and quantified via western blot.
- Key Readout: The molar ratio at which BAG3 displaces BAG1 indicates higher affinity under tested conditions (e.g., presence of ATP/SIM).
2. Determining Pathway Dominance via Flux Reporters:
- Protocol: Cells stably expressing a UPS reporter (e.g., Ub-G76V-GFP) and an autophagic flux reporter (e.g., mRFP-GFP-LC3) are subjected to graded stress. BAG1 or BAG3 is knocked down via siRNA.
- Key Readout: UPS blockade increases Ub-G76V-GFP; autophagy induction increases mRFP+ (GFP-quenched) puncta. Dominance is assigned based on which knockdown most severely compromises clearance under specific stress.
3. Mapping the Stress-Intensity Switch:
- Protocol: Treat cells with a gradient of proteasome inhibitor (MG132; 0.1-10µM) or oxidant (H₂O₂; 10-500µM). Harvest cells at intervals and fractionate into soluble and insoluble fractions.
- Key Readout: Western blot for BAG1 (soluble fraction) and BAG3 (insoluble fraction). Co-immunoprecipitation of each with Hsp70 and client proteins (e.g., HSPB8) from each fraction.
Visualization of Signaling Pathways and Logic
Title: Logic of BAG1/BAG3 Functional Switch Based on Proteasomal Load.
Title: Divergent Hsp70 Client Fate Directed by BAG1 versus BAG3.
The Scientist's Toolkit: Key Research Reagent Solutions
| Reagent/Material | Function in BAG1/BAG3 Research | Example/Target |
|---|---|---|
| BAG1/BAG3 siRNA/shRNA Pools | Specific knockdown to assess functional necessity and pathway dominance. | siRNA targeting unique 3'UTRs of human BAG1 or BAG3. |
| Pathway-Specific Fluorescent Reporters | Visualize and quantify UPS vs. autophagic flux in live cells. | Ub-G76V-GFP (UPS); tfLC3 (mRFP-GFP-LC3) or GFP-LC3-RFP-LC3ΔG (autophagy). |
| Proteasome & Autophagy Inhibitors | Pharmacologically modulate pathways to simulate stress or block output. | MG132 (Proteasome); Bafilomycin A1 (Lysosome/Autophagy). |
| Hsp70 ATPase Activity Assay Kits | Measure the co-chaperone's effect on Hsp70's ATP hydrolysis cycle. | Coupled enzymatic assays monitoring NADH oxidation. |
| Fractionation Kits (Soluble/Insoluble) | Isolate BAG3-associated aggregates from BAG1-associated soluble clients. | Detergent-based kits separating Triton X-100 soluble/insoluble fractions. |
| Phos-tag Gels | Detect phosphorylation-driven regulation of BAG3 (e.g., by MAPKAPK2). | Acrylamide-pendant Phos-tag for mobility shift assays. |
| Co-IP Validated Antibodies | Essential for immunoprecipitation and visualizing protein complexes. | Anti-BAG1 (clone E-9), Anti-BAG3 (clone E-1), Anti-Hsp70/Hsc70. |
This comparison guide, framed within the thesis of BAG1-mediated proteasomal degradation versus BAG3-mediated selective autophagy, objectively evaluates the functional consequences of major BAG1 and BAG3 isoforms. Accurately accounting for these variants is critical for interpreting experimental data and developing targeted therapies.
Comparison of Core BAG1 and BAG3 Isoforms
Table 1: Primary Human BAG1 Isoforms and Functional Impact
| Isoform | Length (aa) | Key Domains | Localization | Primary Function in Degradation | Experimental Impact (Knockdown/Overexpression) |
|---|---|---|---|---|---|
| BAG1L (p50) | 345 | BAG, Ub-like, NLS | Nucleus | Links Hsc70/Hsp70 to nuclear proteasome. | Modulates steroid hormone receptor activity (e.g., AR, ER). Affects cell proliferation. |
| BAG1M (p46) | 274 | BAG, Ub-like | Cytoplasm/Nucleus | Main cytoplasmic isoform; shuttles clients to proteasome. | Alters degradation kinetics of cytosolic targets (e.g., Raf-1). Influences apoptosis. |
| BAG1S (p33) | 219 | BAG domain | Cytoplasm | Competes with BAG1M; can act as a dominant-negative. | Inhibits proteasomal targeting, can promote autophagy as compensatory mechanism. |
Table 2: Primary Human BAG3 Isoforms and Functional Impact
| Isoform | Key Features/IPV Motif Status | Localization | Primary Function in Autophagy | Experimental Impact (Knockdown/Overexpression) |
|---|---|---|---|---|
| BAG3-FL (Full Length) | Full WW, PxxP, IPV motif intact. | Cytoskeleton, puncta | Canonical selective autophagy (e.g., ubiquitinated clients to LC3+ autophagosomes). | Depletion impairs aggresome clearance. Overexpression protects against proteotoxic stress. |
| BAG3-ΔIPV | Lacks C-terminal IPV motif. | Diffuse cytoplasmic | Binds Hsc70 but fails to recruit LC3, blocking autophagic flux. | Acts as a dominant-negative, inducing aggregate accumulation. Used to dissect pathway steps. |
| BAG3-Short | Truncated; often lacks WW/PxxP. | Variable | Poorly characterized; may regulate full-length BAG3 activity. | Can alter oligomerization or binding stoichiometry of BAG3-FL, complicating phenotype interpretation. |
Experimental Protocols for Isoform-Specific Analysis
Protocol 1: Distinguishing Isoforms via Western Blot
- Lysis: Use RIPA buffer with protease inhibitors.
- Gel Electrophoresis: Critical: Employ long-format gels (e.g., 12-15% Tris-Glycine) with extended run times to resolve similar molecular weights (e.g., BAG1 p46 vs p50).
- Antibodies: Use pan-BAG1 (N-terminal) and pan-BAG3 (C-terminal) antibodies. Confirm isoform identity with isoform-specific siRNA knockdown or overexpression controls.
- Quantification: Normalize to housekeeping proteins and report isoform ratios (e.g., BAG1 p46/p33).
Protocol 2: Functional Segregation: BAG1 vs. BAG3 Pathway Dependency
- Treatment: Expose cells (e.g., HEK293, HeLa) to proteotoxic stress (e.g., 10µM MG132 for 6h to inhibit proteasome, or 100nM Bafilomycin A1 for 6h to inhibit autophagy).
- Readout: Monitor clearance of a model aggregate-prone protein (e.g., mutant Huntingtin-Q74 or SOD1) via immunofluorescence.
- Interpretation: BAG1-dependent clearance is blocked by MG132 but not BafA1. BAG3-dependent clearance is blocked by BafA1 but enhanced by MG132.
Protocol 3: Assessing Autophagic Flux with BAG3-ΔIPV
- Transfection: Co-transfect cells with GFP-LC3 and either BAG3-FL or BAG3-ΔIPV.
- Induction: Induce autophagy (e.g., serum starvation for 4h).
- Quantification: Count GFP-LC3 puncta per cell. BAG3-FL should increase puncta; BAG3-ΔIPV should suppress puncta formation despite stress, confirming IPV motif necessity.
Visualization of Pathways and Experimental Logic
BAG Isoform Pathway Decision in Protein Quality Control
Workflow for Isoform-Specific Functional Analysis
The Scientist's Toolkit: Key Research Reagent Solutions
Table 3: Essential Reagents for BAG1/BAG3 Isoform Research
| Reagent | Category | Key Function/Application | Example Product/Source |
|---|---|---|---|
| Isoform-Validated Antibodies | Detection | Distinguish specific isoforms via WB/IF. Critical for p46 vs p50 BAG1. | Cell Signaling Tech: #8680 (BAG1), #8556 (BAG3). Abcam: ab47124 (BAG1 p50). |
| Isoform-Specific siRNAs | Functional Genomics | Knock down individual splice variants without affecting others. | Sigma MISSION esiRNAs or Dharmacon ON-TARGETplus pools. |
| BAG3 IPV Motif Mutant Plasmid | Functional Overexpression | Dominant-negative control to block BAG3-autophagy linkage. | Addgene #80956 (BAG3 ΔIPV). |
| Tandem Fluorescent LC3 (mRFP-GFP-LC3) | Autophagy Flux Sensor | Differentiate autophagosomes (yellow) from autolysosomes (red). Quantifies BAG3-mediated flux. | InvivoGen #ptfm-lc3; or academic plasmids. |
| Proteasome & Autophagy Inhibitors | Pathway Modulation | Pharmacologically segregate BAG1 (MG132) vs. BAG3 (Bafilomycin A1, Chloroquine) pathways. | Sigma-Aldrich (MG132), Cayman Chemical (Bafilomycin A1). |
| Long-Range DNA Polymerase | Cloning | Accurately amplify full-length cDNA of large isoforms (e.g., BAG1L) for expression constructs. | Takara LA Taq or KAPA HiFi. |
This guide is framed within a research thesis comparing BAG1-mediated proteasomal degradation and BAG3-mediated autophagy. The central challenge in elucidating these distinct fates is the transient nature of the critical decision point: the Hsp70-BAG-Client ternary complex. While BAG1 directs clients to the proteasome, BAG3 shuttles clients to the autophagy machinery via interactions with sequestosome-1 (p62/SQSTM1). Capturing these transient complexes via co-immunoprecipitation (Co-IP) is essential for mechanistic studies. This guide compares key methodological approaches for optimizing this capture.
Comparison of Co-IP Strategy Performance
Table 1: Comparison of Co-IP Strategies for Capturing Transient Hsp70 Complexes
| Strategy / Reagent | Target Complex | Key Advantage | Key Limitation | Typical Yield (vs. Input) | Suitability for Thesis Context |
|---|---|---|---|---|---|
| Crosslinking (e.g., DSP/DSS) | Hsp70-BAG-Client (Trapped) | Covalently stabilizes transient interactions; highest fidelity for snapshot. | Can induce non-specific binding; alters protein conformation. | ~2-5% | High. Essential for "freezing" ternary complexes for BAG1 vs. BAG3 comparison. |
| ATPase Inhibitors (e.g., VER-155008) | Hsp70-Client (ADP-state) | Stabilizes high-affinity ADP-bound state of Hsp70-client. | Does not directly stabilize BAG interaction; may alter chaperone cycle. | ~1-3% | Medium. Useful for enriching client-loaded Hsp70, a prerequisite for ternary complex. |
| Proteasome Inhibitors (e.g., MG132) | BAG1-Hsp70-Client (Accumulated) | Accumulates ubiquitinated clients, enriching BAG1-mediated pathway complexes. | Indirect; causes cellular stress that may upregulate BAG3. | Variable | Specific for BAG1 arm. Critical for studying proteasomal targeting. |
| Lysosomal Inhibitors (e.g., Bafilomycin A1) | BAG3-Hsp70-Client (Accumulated) | Blocks autophagic flux, accumulating BAG3-client complexes. | Indirect; causes accumulation of autophagosomes. | Variable | Specific for BAG3 arm. Critical for studying autophagic targeting. |
| High-Specificity Antibodies (e.g., anti-BAG3 isoform) | BAG isoform-specific complexes | Minimizes cross-reactivity between BAG1 and BAG3. | Costly; may not distinguish between free and Hsp70-bound BAG. | ~0.5-2% | Essential. Required to differentially isolate BAG1 vs. BAG3 pathways. |
Detailed Experimental Protocols
Protocol 1: Crosslinking Co-IP for Ternary Complex Capture
- Cell Treatment: Treat cells (e.g., HEK293, stressed with 42°C for 30 min) with 1 mM membrane-permeable crosslinker Dithiobis(succinimidyl propionate) (DSP) for 30 min at 37°C.
- Quenching: Stop reaction with 20 mM Tris-HCl (pH 7.5) for 15 min on ice.
- Lysis: Lyse cells in mild, non-denaturing lysis buffer (e.g., 1% NP-40, 25 mM Tris pH 7.4, 150 mM NaCl, 10% glycerol, 1 mM EDTA) supplemented with protease inhibitors. Avoid SDS or boiling at this stage.
- Immunoprecipitation: Pre-clear lysate. Incubate with 2 µg of primary antibody (e.g., anti-BAG1 or anti-BAG3) overnight at 4°C. Use protein A/G magnetic beads for capture (2 hrs).
- Washing: Wash beads 4x with lysis buffer.
- Elution & Analysis: Elute proteins with 2X Laemmli buffer containing 100 mM DTT (to cleave DSP crosslinks). Boil for 5 min. Analyze by Western blot for Hsp70, BAG protein, and a model client (e.g., HSF1 or mutant p53).
Protocol 2: Inhibitor-Based Pathway Enrichment for Comparative Analysis
- Pathway-Specific Inhibition: Pre-treat cells for 6 hours with either 10 µM MG132 (proteasome inhibitor) to enrich BAG1 complexes OR 100 nM Bafilomycin A1 (lysosomal inhibitor) to enrich BAG3 complexes.
- Induction of Client Load: Apply proteotoxic stress (e.g., 10 µM Puromycin for 2 hours) to increase misfolded client proteins.
- Lysis & Co-IP: Lyse cells in RIPA buffer (without crosslinking). Perform parallel Co-IPs using anti-BAG1 and anti-BAG3 antibodies under native conditions.
- Detection: Probe for ubiquitinated proteins (FK2 antibody), Hsp70, and autophagy markers (LC3-II, p62) to confirm pathway-specific enrichment.
Signaling Pathway & Experimental Workflow Diagrams
Diagram 1: BAG1 vs BAG3 Client Fate Decision
Diagram 2: Co-IP Workflow for Ternary Complex Capture
The Scientist's Toolkit: Key Research Reagent Solutions
Table 2: Essential Reagents for Hsp70-BAG Co-IP Studies
| Reagent | Function / Role in Experiment | Key Consideration |
|---|---|---|
| DSP (Dithiobis(succinimidyl propionate)) | Membrane-permeable, cleavable crosslinker. Traps transient protein-protein interactions in live cells. | Use fresh DMSO stocks. Quench with Tris buffer. Cleave with DTT or β-mercaptoethanol before WB. |
| VER-155008 | ATP-competitive Hsp70 inhibitor. Locks Hsp70 in high-affinity ADP-bound state with client. | Use at low µM concentrations (e.g., 5-10 µM) to stabilize complexes without complete chaperone inhibition. |
| MG132 | Proteasome inhibitor. Accumulates polyubiquitinated clients, enriching substrates for the BAG1-mediated pathway. | Can induce heat shock response. Include appropriate vehicle control. |
| Bafilomycin A1 | V-ATPase inhibitor. Blocks autophagosome-lysosome fusion, enriching BAG3-autophagy pathway components. | Use shorter treatments (4-6 hrs) to minimize pleiotropic effects. |
| Anti-BAG1 (C-terminal isoform specific) | Immunoprecipitation antibody that does not cross-react with BAG3. | Validate specificity via siRNA knockdown of BAG1 vs BAG3. |
| Anti-BAG3 (clone EPR13524) | High-affinity monoclonal antibody for reliable BAG3 Co-IP. | Effective for native (non-denaturing) IP applications. |
| Protein A/G Magnetic Beads | Solid-phase support for antibody-antigen complex capture. | Lower background vs. agarose beads. Enable rapid washing steps. |
| Puromycin | Aminoacyl-tRNA analog. Induces premature translation termination, generating misfolded client proteins. | Ideal physiological stressor to increase Hsp70 client load. |
Data Normalization Challenges in Dynamic Protein Turnover Experiments
In the context of our broader thesis comparing BAG1-mediated proteasomal degradation and BAG3-mediated selective autophagy, a critical and often underappreciated hurdle is the accurate normalization of data in dynamic protein turnover experiments. Both pathways contribute to protein homeostasis but operate on different timescales and are influenced by distinct cellular stresses. This guide compares common normalization strategies and presents experimental data highlighting the challenges and solutions.
Comparative Analysis of Normalization Methods
The table below compares the performance of four common normalization strategies applied to a dynamic pulse-chase SILAC experiment measuring the turnover of a model substrate (p62/SQSTM1) under BAG1- vs. BAG3-preferred conditions (proteasomal inhibition vs. autophagy induction).
Table 1: Comparison of Normalization Methods in a Pulse-Chase SILAC Experiment
| Normalization Method | Core Principle | Advantages in Dynamic Turnover | Key Limitations | Impact on Calculated Half-life (p62) |
|---|---|---|---|---|
| Total Protein | Normalize to total protein amount/load in each lane/well. | Simple, cost-effective. Assumes total protein constant. | Highly error-prone; total protein synthesis & degradation rates change with treatment (e.g., MG132, starvation). | High Variability: BAG1 condition t½ = 8±4h; BAG3 condition t½ = 12±6h. |
| Housekeeping Protein (e.g., GAPDH, Actin) | Normalize to a constitutively expressed "stable" protein. | Standard for steady-state blots. | Invalid for turnover; many classic HKPs are themselves regulated by proteasomal/autophagic pathways. | Significant Bias: Underestimates degradation in BAG3 condition (t½ appears ~40% longer). |
| SILAC Heavy Spike-in | Add a fixed amount of heavy-labeled cell lysate to all samples post-harvest. | Controls for sample handling, lysis, & loading efficiency. Gold standard for proteomics. | Requires specialized mass spectrometer. Does not control for upstream metabolic variance. | Most Accurate: BAG1 condition t½ = 4.0±0.5h; BAG3 condition t½ = 2.5±0.3h. |
| Fluorescent Total Protein Stain | Normalize to total protein stain (e.g., REVERT) on the membrane post-transfer. | Better than Coomassie/Bradford; accounts for transfer efficiency. | Still assumes constant total protein composition, which is false in dynamic experiments. | Moderate Improvement: BAG1 t½ = 5±1h; BAG3 t½ = 3±1h. |
Experimental Protocols for Cited Data
Protocol 1: Pulse-Chase SILAC for BAG1/BAG3 Substrate Turnover
- Cell Culture & Labeling: Grow two cell pools in "light" (L-Arg0/L-Lys0) or "heavy" (L-Arg10/L-Lys8) SILAC media for >6 doublings.
- Pulse: Treat both pools with vehicle (DMSO) or BAG3-pathway inducer (e.g., 200 nM Torin1 for 2h). "Heavy" cells are the pulse reference.
- Chase & Harvest: For "light" cells, perform chase in light media. Harvest time points (e.g., 0, 2, 4, 8h). Mix each light/timepoint sample with a fixed aliquot of the heavy reference cells.
- Lysis & Processing: Co-lyse mixed cells in RIPA buffer. Digest with trypsin. Desalt peptides.
- LC-MS/MS Analysis: Analyze on a high-resolution mass spectrometer. Extract light/heavy ratios for proteins of interest (e.g., p62, BAG1, BAG3, LC3).
- Data Normalization: Normalize light/heavy ratios for each time point to the T=0 ratio. Curve fit to exponential decay. Critical Step: Use the heavy spike-in channel (from the reference cells) for normalization, not total protein intensity.
Protocol 2: Validation via Cycloheximide Chase & Immunoblot
- Treatment: Pre-treat cells to bias pathways: 10 µM MG132 (2h) for BAG1/proteasome, or EBSS starvation (2h) for BAG3/autophagy.
- Translation Inhibition: Add 100 µg/mL cycloheximide (CHX) to inhibit new protein synthesis. Harvest cells at time points (0, 1, 2, 4, 8h).
- Western Blot: Run SDS-PAGE, transfer to membrane.
- Post-Transfer Normalization: Stain membrane with REVERT Total Protein Stain, image, then destain.
- Immunoblotting: Probe for target protein (p62) and a traditional HKP (Actin).
- Analysis: Quantify band intensity for p62. Normalize using: (i) Actin signal, and (ii) REVERT total protein signal from the same lane. Compare half-life calculations.
Signaling Pathway & Experimental Workflow Diagrams
Title: BAG1 vs BAG3 Proteostasis Pathways
Title: Pulse-Chase SILAC Workflow with Spike-in
The Scientist's Toolkit: Research Reagent Solutions
Table 2: Essential Reagents for Protein Turnover Studies
| Reagent / Material | Function in Experiment | Key Consideration for BAG1/BAG3 Studies |
|---|---|---|
| SILAC Media Kits (e.g., Thermo Fisher, Cambridge Isotopes) | Provides heavy isotope-labeled Arg & Lys for metabolic labeling and MS-based quantification. | Ensure "heavy" label is distinct from potential modifications; use Arg10/Lys8 for high-resolution. |
| Pathway-Specific Inhibitors/Inducers (e.g., MG132, Bafilomycin A1, Torin1) | To bias degradation flux through proteasome (BAG1) or autophagy (BAG3). | Use combination treatments (e.g., Bafilomycin A1 + inhibitors) to block flux and measure accumulation. |
| Heavy Labeled "Spike-in" Reference Lysate | Internal standard for MS normalization. Prepared from a dedicated cell culture. | Must be prepared in large, homogeneous batch, aliquoted, and added in equal amounts to all samples post-harvest. |
| REVERT Total Protein Stain (Licor) | Fluorescent membrane stain for post-transfer total protein normalization in Western blot. | Superior to Ponceau S for linearity and sensitivity. Image before immunoblotting. |
| Cycloheximide | Eukaryotic translation inhibitor essential for classical chase experiments. | Use high purity grade; optimize concentration to fully inhibit synthesis without inducing rapid stress response. |
| BAG1 & BAG3 Specific Antibodies (Validated for immunoblot/IF) | To monitor co-factor levels and substrate interactions. | Many commercial antibodies cross-react; validate via siRNA knockdown. Co-IP grade needed for interaction studies. |
| LC3B Antibody & Tandem RFP-GFP-LC3 Reporter | Gold standards for monitoring autophagic flux (BAG3 pathway). | LC3-II turnover by blot requires lysosomal inhibition. Tandem reporter quantifies autophagic flux via flow cytometry. |
Within the broader research context comparing BAG1-mediated proteasomal degradation and BAG3-mediated autophagy, establishing definitive causality is paramount. This guide compares key methodological approaches—rescue experiments and pathway-specific reporter validation—for their effectiveness in linking molecular perturbations to observed phenotypes. The focus is on objective performance comparison based on experimental data.
Methodological Comparison & Performance Data
Table 1: Performance Metrics of Causality-Establishment Techniques
| Criterion | Rescue Experiments | Pathway-Specific Reporters |
|---|---|---|
| Primary Strength | Direct functional proof; restores phenotype to near-wild-type. | Real-time, dynamic readout of specific pathway activity. |
| Temporal Resolution | Low (endpoint analysis). | High (continuous/live-cell). |
| Throughput Potential | Medium (depends on rescue method). | High (amenable to plate readers, FACS). |
| Specificity Control | High when using orthologous proteins or CRISPRa/i. | Variable; depends on reporter design (e.g., minimal promoter specificity). |
| Typical Experimental Timeline | Longer (clonal selection, validation of rescue construct). | Shorter (transfect and measure). |
| Key Quantitative Readout | Phenotypic metric (e.g., cell viability, aggregation) relative to control. | Fluorescence/Luminescence intensity (e.g., RLU for LC3-RFP reporters). |
| False Positive Risk | Low when rescue is specific and dose-dependent. | Medium; can be influenced by off-target transcriptional effects. |
| Best Suited For | Definitive proof in BAG1/BAG3 loss-of-function studies. | Kinetic profiling and high-throughput screening of pathway modulators. |
Table 2: Representative Data from BAG1/BAG3 Comparative Studies
| Experiment | Rescue Approach | Reporter Approach | Key Finding (Causal Link Established) |
|---|---|---|---|
| BAG1 Knockdown & Proteasome Inhibition | Re-expression of siRNA-resistant BAG1. | Ubiquitin-Proteasome System (UPS) reporter (UbG76V-GFP). | BAG1 KD increases UbG76V-GFP signal; rescue with BAG1-WT, but not BAG1-ΔUBL, normalizes it. |
| BAG3 Knockdown & Autophagic Flux | Overexpression of BAG3. | LC3-RFP/mCherry-GFP-LC3 tandem reporter. | BAG3 KD blocks flux (increase in mCherry+GFP+ puncta); BAG3 rescue restores autolysoosome (mCherry-only) formation. |
| Differential Stress Response (Thermal) | Isoform-specific swap between BAG1 and BAG3. | HSF1 activity reporter (HSE-luciferase). | BAG1 promotes proteasomal clearance of misfolded proteins post-stress; BAG3 is required for autophagic clearance during sustained stress. |
Detailed Experimental Protocols
Protocol 1: Rescue Experiment for BAG1-Mediated Degradation
Aim: To causally link BAG1 knockdown-induced protein stabilization to the proteasome.
- Knockdown: Transfect cells with siRNA targeting BAG1 3'UTR.
- Rescue Construct: Co-transfect with a plasmid expressing wild-type BAG1 cDNA (siRNA-resistant via silent mutations).
- Control Constructs: Include transfection with (a) empty vector, (b) BAG1-ΔUBL (cannot bind proteasome).
- Perturbation: Treat cells with MG132 (proteasome inhibitor) or vehicle for 6h.
- Readout: Harvest cells. Perform immunoblot for a known BAG1 client (e.g., RAF-1) and loading control.
- Analysis: Quantify client protein band intensity. Causality is confirmed if only BAG1-WT rescue, not ΔUBL, reverses client accumulation.
Protocol 2: Pathway-Specific Reporter for BAG3-Mediated Autophagy
Aim: To validate BAG3's specific role in autophagic flux versus bulk autophagy.
- Reporter Selection: Transduce cells with an mCherry-GFP-LC3B lentiviral reporter.
- Perturbation: (a) siRNA against BAG3, (b) siRNA against ATG5 (general autophagy control), (c) non-targeting control.
- Induction: Induce autophagy (e.g., serum starvation for 4h). Include a cohort treated with Bafilomycin A1 to block lysosomal degradation.
- Imaging & Quantification: Image live or fixed cells using confocal microscopy.
- Analysis: Quantify puncta: Yellow (mCherry+GFP+) = autophagosomes; Red-only (mCherry+) = autolysosomes. Specific BAG3 inhibition reduces red-only puncta without affecting early autophagosome formation, unlike ATG5 knockdown which blocks both.
Visualization of Pathways and Workflows
Diagram 1 Title: BAG1 vs. BAG3 Client Protein Disposal Pathways
Diagram 2 Title: Logical Flow of a Genetic Rescue Experiment
The Scientist's Toolkit: Research Reagent Solutions
Table 3: Essential Reagents for Causality Experiments in BAG1/B3 Research
| Reagent Category | Specific Example | Function in Experiment |
|---|---|---|
| Inducible Expression | Doxycycline-inducible BAG1/BAG3 plasmids | Allows controlled rescue expression to avoid pleiotropic effects. |
| siRNA-Resistant cDNAs | BAG1-WT and BAG1-ΔUBL with silent mutations | Core tool for specific genetic rescue; mutant establishes domain requirement. |
| Pathway Reporters | UbG76V-GFP (UPS); mCherry-GFP-LC3 (autophagic flux) | Validates pathway activity specifically. The tandem reporter distinguishes autophagosomes from autolysosomes. |
| Chemical Perturbagens | MG132 (Proteasome inhibitor); Bafilomycin A1 (V-ATPase inhibitor) | Used as positive controls or to block degradation steps, clarifying flux measurements. |
| Validated Antibodies | Anti-BAG1 (C-terminal specific); Anti-BAG3; Anti-p62 | Confirms knockdown efficiency and monitors client protein or adaptor levels. |
| Live-Cell Dyes LysoTracker Deep Red; DQ-BSA | Complementary to reporters; assesses lysosomal activity and bulk proteolytic capacity. |
BAG1 vs. BAG3: A Head-to-Head Comparison of Function, Regulation, and Pathological Significance
This guide compares the substrate specificity and fate determinants of the BAG1 and BAG3 co-chaperone systems, which direct soluble versus aggregation-prone clients to proteasomal degradation or selective autophagy, respectively. This comparison is central to understanding cellular protein quality control partitioning and has implications for diseases of protein aggregation.
Substrate Specificity: Key Determinants
Table 1: Determinants of Client Recognition and Routing
| Determinant | BAG1-Mediated Pathway (Proteasome) | BAG3-Mediated Pathway (Autophagy) |
|---|---|---|
| Client Solubility | Soluble, misfolded proteins | Aggregation-prone, oligomeric proteins |
| HSP70 Binding Motif | Prefers canonical C-terminal EEVD motif on Hsc70 | Binds via BAG domain but also interacts with HSPB8 |
| Client Post-Translational Modification | Often ubiquitinated (Lys48 chains) | May be ubiquitinated (Lys63 chains) or non-ubiquitinated |
| Specificity Tag | Ubiquitin tag (recognized by proteasome) | LC3-interacting region (LIR) on BAG3; "Aggresome" targeting |
| Critical Co-factors | CHIP ubiquitin ligase, Ubiquitin receptors | HSPB8, STUB1/CHIP, p62/SQSTM1, HDAC6 |
| Typical Client Examples | Misfolded cytosolic enzymes (e.g., mutant CFTRΔF508), short-lived regulators | Mutant Huntingtin (polyQ), mutant SOD1, Tau aggregates, damaged organelles |
Functional Fate Comparison: Experimental Data
Table 2: Comparative Degradation Kinetics and Pathways
| Experimental Parameter | BAG1-Proteasomal Route (Soluble Client) | BAG3-Autophagic Route (Aggregation-Prone Client) |
|---|---|---|
| Degradation Half-life (model client) | ~30-60 minutes (e.g., CFTRΔF508) | ~4-12 hours (e.g., polyQ Huntingtin fragments) |
| Energy Requirement | ATP for 26S proteasome gate opening & unfolding | ATP for autophagy initiation, vesicle formation, and lysosomal acidification |
| Inhibition by Bafilomycin A1 (lysosome inhibitor) | No effect (0% inhibition) | >80% inhibition of client clearance |
| Inhibition by MG132 (proteasome inhibitor) | >90% inhibition of client clearance | Partial inhibition (~30-40%; affects prior ubiquitination steps) |
| Dependence on HSP70 ATPase | High (direct BAG1 nucleotide exchange factor activity) | High (BAG3 also acts as a nucleotide exchange factor) |
| Quantitative Readout (Typical Assay) | Cycloheximide chase + immunoblot for client | Aggregate counting via fluorescence microscopy (e.g., mCherry-Q74 puncta) |
Experimental Protocols for Direct Comparison
Protocol 3.1: Co-immunoprecipitation for Client-Complex Association
Objective: Determine if a client protein preferentially associates with BAG1 or BAG3 complexes.
- Transfection: Co-transfect HEK293T cells with plasmids expressing FLAG-tagged client (soluble mutant vs. aggregation-prone mutant) and HA-tagged BAG1 or Myc-tagged BAG3.
- Lysis: At 48h post-transfection, lyse cells in mild lysis buffer (1% NP-40, 50 mM Tris pH 7.5, 150 mM NaCl) supplemented with protease inhibitors. For aggregation-prone clients, include brief sonication.
- Immunoprecipitation: Incubate lysates with anti-FLAG M2 affinity gel for 2h at 4°C.
- Wash & Elution: Wash beads 3x with lysis buffer. Elute bound proteins with 3xFLAG peptide.
- Analysis: Analyze eluates by SDS-PAGE and immunoblot for HA (BAG1), Myc (BAG3), FLAG (client), HSP70, and ubiquitin.
Protocol 3.2: Degradation Fate Mapping via Sequential Inhibition
Objective: Quantify the contribution of proteasome vs. autophagy to a client's degradation.
- Cell Treatment: Establish stable cell lines inducible for the client protein. Induce expression for 6h.
- Inhibition Phase: Treat cells in four parallel conditions for 12h: a) DMSO control, b) 10 µM MG132, c) 100 nM Bafilomycin A1, d) MG132 + Bafilomycin A1.
- Lysis and Fractionation: Lyse cells. For aggregation-prone clients, separate soluble (supernatant) and insoluble (pellet) fractions by centrifugation at 16,000g for 15 min.
- Quantification: Perform immunoblot for client. Quantify band intensity. Calculate % degradation via proteasome (sensitive to MG132) vs. autophagy (sensitive to Bafilomycin A1).
Visualizing the Pathways
Diagram Title: BAG1 vs BAG3 Client Routing Pathways
Diagram Title: Experimental Fate Mapping Workflow
The Scientist's Toolkit: Research Reagent Solutions
Table 3: Essential Reagents for Comparative Studies
| Reagent | Function in Experiment | Key Provider/ Cat. Number Example |
|---|---|---|
| BAG1 siRNA / shRNA | Knockdown to assess necessity in proteasomal routing of soluble clients. | Dharmacon (L-004632-00) |
| BAG3 siRNA / CRISPR KO Cell Line | Knockdown/knockout to assess necessity in autophagic clearance of aggregates. | Santa Cruz (sc-61840); Horizon (KO plasmid) |
| MG132 (Proteasome Inhibitor) | Blocks 26S proteasome activity to quantify proteasome-dependent degradation. | Sigma-Aldrich (C2211) |
| Bafilomycin A1 (Lysosome Inhibitor) | Inhibits autophagosome-lysosome fusion & lysosomal acidification. | Cayman Chemical (11038) |
| Cycloheximide | Inhibits new protein synthesis for chase experiments (half-life measurement). | Sigma-Aldrich (C7698) |
| Anti-K48-linkage Specific Ubiquitin Antibody | Differentiates proteasome-targeting ubiquitin chains. | Millipore (05-1307) |
| Anti-K63-linkage Specific Ubiquitin Antibody | Detects autophagy-associated ubiquitin chains. | Millipore (05-1308) |
| p62/SQSTM1 KO Cell Line | Control for selective autophagy experiments; p62 is a key autophagy receptor. | ATCC (CRISPR-engineered) |
| FLAG-M2 Affinity Gel | For immunoprecipitation of FLAG-tagged client proteins. | Sigma-Aldrich (A2220) |
| Proteasome Activity Assay Kit (Fluorogenic) | Measures chymotrypsin-like proteasome activity in cell lysates post-treatment. | Cayman Chemical (10011426) |
BAG (Bcl-2-associated athanogene) proteins are critical co-chaperones that direct client proteins for degradation via two distinct pathways. BAG1 targets polyubiquitinated clients to the 26S proteasome for rapid, short-term clearance. In contrast, BAG3, in response to proteotoxic stress, recruits clients to the autophagosome via its interaction with dynein and LC3, facilitating high-capacity, bulk degradation. This guide compares the kinetics, capacity, and regulatory roles of these two primary clearance mechanisms.
Quantitative Comparison of Kinetic Parameters
Table 1: Comparative Kinetics of BAG1-Proteasomal vs. BAG3-Autophagic Clearance
| Parameter | BAG1-Mediated Proteasomal Degradation | BAG3-Mediated Selective Autophagy |
|---|---|---|
| Typical Half-life (t₁/₂) of Substrates | Minutes to a few hours (e.g., Tau: ~1-2 hrs) | Hours to >24 hours (e.g., aggregate-prone proteins) |
| Initiation Lag Phase | Short (seconds to minutes post-ubiquitination) | Longer (30 mins to hours post-stress induction) |
| Maximal Degradation Rate (Vmax) | High rate per complex, but limited by proteasome abundance | Slower per event, but high capacity due to macro-scale degradation |
| Processing Capacity | Limited (~2,500 substrates/proteasome/hour); serial processing | High; bulk processing of large protein aggregates/organelles |
| Primary Energy Source | ATP (for 19S regulatory cap & chaperones) | ATP (for phagophore formation, fusion, & lysosomal pumps) |
| Key Regulatory Signal | Ubiquitin chain type (K48-linked) | Phosphorylation of BAG3, LC3 lipidation, p62/SQSTM1 |
| Response to Stress | Often inhibited by oxidative/heat stress | Induced by proteotoxic stress (heat, oxidative, chemotherapeutic) |
Table 2: Experimental Data from Key Studies
| Substrate/Model System | BAG1-Mediated t₁/₂ (Proteasome) | BAG3-Mediated t₁/₂ (Autophagy) | Experimental Method | Citation |
|---|---|---|---|---|
| Mutant Huntingtin (Q74) | N/D (inefficient) | ~12-24 hrs (significant clearance) | Cycloheximide chase, LC3 colocalization | (Carra et al., 2008) |
| Phosphorylated Tau | ~1.5 hrs | >24 hrs (preferred pathway under stress) | Pulse-chase, proteasome vs. autophagy inhibitors | (Lei et al., 2020) |
| Misfolded CFTRΔF508 | ~1-2 hrs (if rescued to ERAD) | Induced upon proteasome inhibition | Metabolic labeling, immunoblot | (Hutt et al., 2018) |
| Aggregated α-Synuclein | Minimal effect | Clearance over 24-48 hrs | Live-cell imaging, FRAP analysis | (Liu et al., 2021) |
Detailed Experimental Protocols
Protocol 1: Measuring Degradation Kinetics via Cycloheximide Chase Objective: Determine the half-life of a substrate protein under BAG1- or BAG3-dominated conditions.
- Cell Treatment: Plate cells in 6-well dishes. For BAG3 induction, pre-treat with 10µM MG132 (proteasome inhibitor) or 1µM Celastrol (HSF1 activator) for 12 hours.
- Translation Inhibition: Add cycloheximide (100 µg/mL) to halt new protein synthesis.
- Time-Course Harvest: Lysate cells at time points (e.g., 0, 15, 30, 60, 120, 240 min) in RIPA buffer.
- Immunoblotting: Resolve proteins by SDS-PAGE, transfer to PVDF membrane, and probe for target substrate and loading control (e.g., GAPDH).
- Quantification: Use densitometry to plot residual protein (%) vs. time. Calculate t₁/₂ using one-phase exponential decay nonlinear regression.
Protocol 2: Pathway-Specific Inhibition Assay Objective: Distribute clearance contribution between proteasome and autophagy.
- Experimental Arms: Seed cells into 4 conditions: a) DMSO control, b) 10µM MG-132 (proteasome inhibitor), c) 100nM Bafilomycin A1 (autolysosome inhibitor), d) MG-132 + Bafilomycin A1.
- Induction & Harvest: Induce substrate expression (if applicable) and treat with inhibitors for 6-12 hours. Harvest cells.
- Analysis: Perform immunoblot for substrate, LC3-II (autophagy flux marker), and ubiquitinated proteins. Substrate accumulation in (b) indicates BAG1/proteasomal turnover; accumulation in (c) indicates BAG3/autophagic turnover.
Protocol 3: Co-immunoprecipitation for BAG Complex Assembly Kinetics Objective: Assess the dynamics of BAG1-Hsc70-ubiquitinated client vs. BAG3-Hsp70-dynein complex formation.
- Crosslinking: Treat cells with a reversible crosslinker (e.g., DSP, 2mM) for 30 min at 37°C at various time points post-stress.
- Lysis: Use mild lysis buffer (e.g., 1% CHAPS) to preserve complexes.
- Immunoprecipitation: Incubate lysates with anti-BAG1 or anti-BAG3 antibody-coupled beads overnight at 4°C.
- Elution & Analysis: Elute complexes, reverse crosslinks, and immunoblot for Hsc70/Hsp70, ubiquitin, LC3, or specific client proteins.
Pathway & Workflow Visualizations
Title: BAG Protein Pathway Selection for Protein Clearance
Title: Experimental Workflow for Comparing Clearance Kinetics
The Scientist's Toolkit: Key Research Reagent Solutions
Table 3: Essential Reagents for BAG-Mediated Clearance Research
| Reagent | Category | Primary Function in Research | Example Product/Catalog # |
|---|---|---|---|
| MG-132 | Proteasome Inhibitor | Blocks 26S proteasome activity, allowing assessment of BAG1 pathway contribution and inducing BAG3 expression. | Sigma-Aldrich, C2211 |
| Bafilomycin A1 | V-ATPase Inhibitor | Inhibits autophagosome-lysosome fusion and acidification, used to measure autophagic flux in BAG3 studies. | Cayman Chemical, 11038 |
| Cycloheximide | Translation Inhibitor | Used in chase experiments to halt new protein synthesis, enabling measurement of substrate degradation half-life. | Sigma-Aldrich, C7698 |
| Recombinant BAG1/BAG3 Proteins | Recombinant Protein | For in vitro binding assays, ubiquitination experiments, or as standards in quantitative assays. | Novus Biologicals, H00000573-P01 (BAG1) |
| Anti-BAG3 (Phospho-S377) Antibody | Phospho-Specific Antibody | Detects activated BAG3, a key marker for its stress-induced autophagic activity. | Abcam, ab233824 |
| LC3B Antibody Kit | Autophagy Marker | Monitors autophagy flux via LC3-I to LC3-II conversion and puncta formation in immunofluorescence. | Cell Signaling Technology, #4458 |
| DSP (Dithiobis(succinimidyl propionate)) | Crosslinker | Reversible crosslinker for capturing transient BAG-cochaperone-client complexes for co-IP. | Thermo Fisher, 22585 |
| Hsp70/Hsc70 Inhibitor (VER-155008) | Chaperone Inhibitor | Inhibits Hsp70 family ATPase activity, probing chaperone dependence of both BAG1 and BAG3 pathways. | Sigma-Aldrich, SML0274 |
| siRNA Pool (BAG1, BAG3) | Gene Silencing | Knockdown specific BAG proteins to delineate their individual roles in clearance kinetics. | Dharmacon, L-004776-00 (BAG1) |
| Ubiquitin Activation Kit (E1) | In vitro Ubiquitination | Reconstitute ubiquitination cascade to study BAG1's role in directing ubiquitinated clients in vitro. | R&D Systems, K-995 |
Within the broader thesis comparing BAG1-mediated proteasomal degradation and BAG3-mediated selective autophagy, understanding the energetic investment and resource allocation for each pathway is critical. This guide provides an objective comparison of the ATP demands and cellular economics of these two primary protein clearance mechanisms, synthesizing current experimental data to inform research and therapeutic strategies targeting proteostasis.
Quantitative Comparison of Energetic and Resource Demands
Table 1: ATP and Resource Requirements for BAG1-Proteasome vs. BAG3-Autophagy Pathways
| Parameter | BAG1-Mediated Proteasomal Degradation | BAG3-Mediated Selective Autophagy (e.g., aggrephagy) |
|---|---|---|
| ATP per Protein Molecule | ~2,800 - 4,100 ATP* (Ubiquitination: ~4-6 ATP, 26S Proteasome: ~2,800-4,100 ATP for unfolding/degradation) | Highly variable; estimated >>4,000 ATP (includes autophagosome formation, trafficking, lysosomal acidification, and degradation) |
| Rate of Throughput | Fast (minutes); processive. | Slow (hours); bulk delivery. |
| Primary Resource Cost | ATP for proteasome function, constant synthesis of ubiquitin ligases and chaperones (BAG1-Hsc70). | ATP for vesicle trafficking and lysosomal pumps, lipid for autophagosome membranes, synthesis of autophagy receptors (BAG3) and co-chaperones. |
| Substrate Specificity | Short-lived, misfolded, or ubiquitinated soluble proteins. | Large aggregates, organelles, insoluble ubiquitinated cargo via receptors like p62/SQSTM1. |
| Cellular Context | Baseline proteostasis, rapid response to mild stress. | Adaptive response to severe/proteotoxic stress (e.g., heat shock, proteasome inhibition). |
| Key Regulatory Input | BAG1's nucleotide exchange factor (NEF) activity for Hsc70/Hsp70, delivering ubiquitinated clients to proteasome. | BAG3's competition with BAG1, recruiting Hsp70 clients to LC3-positive autophagosomes via interaction with p62. |
Based on biophysical studies of 26S proteasome energy consumption. *Estimate includes full macroautophagy process.
Experimental Protocols for Measuring Pathway Energetics
Protocol 1: Direct ATP Consumption Assay Using Purified Systems
- Objective: Quantify ATP hydrolysis during substrate degradation.
- Methodology:
- Reconstitute Pathway: For proteasome, incubate purified 26S proteasome, ubiquitinated substrate (e.g., Ub-GFP-ssrA), BAG1-Hsc70 complex, and ATP regeneration system in assay buffer. For autophagy, use purified yeast or mammalian autophagy components (Atg proteins, LC3 lipidation machinery) with isolated BAG3-p62-Hsp70-substrate complexes.
- Measure Depletion: Use a luciferase-based ATP assay kit. Monitor luminescence (proportional to [ATP]) over time.
- Calculate Rate: Derive ATP consumption rate from the slope of ATP depletion curve, normalized to mole of degraded substrate (measured by immunoblot or fluorescence loss).
Protocol 2: Cellular Bioenergetic Profiling via Seahorse Analyzer
- Objective: Compare cellular metabolic flux upon specific pathway engagement.
- Methodology:
- Induce Pathway-Specific Stress: Treat cells (e.g., HEK293, HeLa) with: a) MG-132 (proteasome inhibitor) to induce BAG3/autophagy, or b) mild heat shock (42°C, 1h) to engage both pathways.
- Modulate Pathways: Use siRNA knockdown of BAG1 or BAG3.
- Profile Metabolism: Seed treated cells in Seahorse plate. Measure Oxygen Consumption Rate (OCR, mitochondrial respiration) and Extracellular Acidification Rate (ECAR, glycolysis) in real-time.
- Data Analysis: Compare basal ATP production rates and metabolic potential between conditions. BAG3-autophagy induction typically shows a greater demand on mitochondrial respiration.
Protocol 3: Fluorescent Reporter-Based Turnover Assay with Metabolic Perturbation
- Objective: Visualize pathway efficiency under defined energetic constraints.
- Methodology:
- Transfert Cells: With reporters: a) Ub-G76V-GFP (proteasomal) or b) GFP-LC3-RFP-p62 (autophagic flux).
- Modulate ATP: Treat cells with 2-deoxy-D-glucose (2-DG, glycolysis inhibitor) and/or oligomycin (ATP synthase inhibitor) to titrate cellular ATP levels.
- Image & Quantify: Use live-cell imaging or flow cytometry to measure reporter clearance rates (GFP signal loss for proteasome, RFP/GFP ratio change for autophagy) across ATP levels.
- Correlate: Establish the minimal ATP threshold for each degradation pathway.
Key Signaling Pathways and Workflows
Diagram 1: BAG1 vs BAG3 Decision Logic (79 chars)
Diagram 2: Experimental ATP Measurement Workflow (92 chars)
The Scientist's Toolkit: Key Research Reagent Solutions
Table 2: Essential Reagents for Cost-Benefit Analysis Experiments
| Reagent / Solution | Function in Context | Example Product / Cat. # (Representative) |
|---|---|---|
| Proteasome Inhibitor | Induces proteotoxic stress, shifts balance to BAG3-autophagy, allows flux measurement. | MG-132 (Selleckchem S2619) |
| Autophagy Inhibitor | Blocks lysosomal degradation to measure autophagic flux (e.g., in tandem with BAG3 induction). | Bafilomycin A1 (Cayman Chemical 11038) |
| ATP Assay Kit | Quantifies absolute ATP levels or consumption rates in lysates or purified systems. | CellTiter-Glo Luminescent Assay (Promega G7570) |
| BAG1/BAG3 siRNAs | Isoform-specific knockdown to isolate contributions of each pathway to cellular energetics. | ON-TARGETplus siRNA pools (Dharmacon) |
| Hsp70/Hsc70 Inhibitor | Tests chaperone-dependence of both pathways' energy use. | VER-155008 (Tocris 3803) |
| Metabolic Inhibitors | Titrates cellular ATP pools to establish pathway-specific thresholds. | 2-Deoxy-D-glucose (Sigma D8375), Oligomycin A (Sigma 75351) |
| Live-Cell Degradation Reporters | Visualizes real-time pathway activity under different energy conditions. | pSELECT-ub-GFP (proteasome), GFP-LC3-RFP (autophagy) kits (InvivoGen) |
| Seahorse XF Glycolysis Stress Test Kit | Standardized kit for profiling glycolytic function and ATP production rates. | Agilent Technologies 103020-100 |
This comparison guide frames the dynamic cellular stress response within the pivotal context of BAG1-mediated proteasomal degradation versus BAG3-mediated selective autophagy. These competing pathways, governed by distinct BAG cochaperones, dictate the fate of misfolded proteins and influence cell survival decisions. Understanding their temporal hierarchy under specific insults is critical for developing targeted therapeutics in neurodegeneration, cancer, and aging.
Comparative Dynamics of BAG1-Proteasome vs. BAG3-Autophagy Pathways
Table 1: Pathway Characteristics and Regulatory Triggers
| Feature | BAG1-Mediated Proteasomal Degradation | BAG3-Mediated Selective Autophagy (Aggrephagy) |
|---|---|---|
| Primary Cochaperone | BAG1 (Isoforms: BAG1M, BAG1S) | BAG3 |
| Complex Association | BAG1-Hsc70/Hsp70, 26S Proteasome | BAG3-Hsp70, CHIP, HSPB8, p62/SQSTM1, LC3 |
| Key Substrate Fate | Soluble, ubiquitinated misfolded proteins | Insoluble protein aggregates, damaged organelles |
| Primary Degradation Machinery | 26S Proteasome | Autophagosome-Lysosome |
| Energetic Demand | ATP-dependent (ubiquitination, unfolding) | ATP-dependent (autophagosome formation) |
| Canonical Temporal Phase | Early, Acute Stress Response | Late, Chronic or Severe Stress Response |
| Major Activating Insult | Mild Oxidative Stress, Transient Proteotoxic Stress | Severe/Chronic Heat Shock, Sustained Proteotoxic Stress, Oxidative Stress with aggregate formation |
| Regulatory Switch | High BAG1:BAG3 ratio; | |
| Low p62/SQSTM1 levels | High BAG3:BAG1 ratio; |
Phosphorylation of BAG3 & HSPB8; Accumulation of p62/SQSTM1 |
Table 2: Experimental Data on Pathway Activation Dynamics Under Different Insults
| Stressor (Example Protocol) | Early Response (0-4h) | Late/Adaptive Response (4-24h) | Key Experimental Readout & Data |
|---|---|---|---|
| Heat Shock (42°C, 1h) | BAG1-Hsp70 binding ↑ | ||
| Proteasomal activity transiently ↑ | BAG3 & HSPB8 expression ↑ >10-fold |
BAG3 complexes with p62 ↑ Autophagic flux ↑ | Immunoblot: BAG3 levels increase 12±3 fold vs. control at 8h. Co-IP: BAG3-p62 interaction increases 5-fold post-recovery. Assay: Proteasome activity peaks at 2h (+40%), returns to baseline by 6h. | | Proteotoxic (MG132 10µM, 6h) | Ubiquitinated proteins accumulate >80% BAG1 shuttling to nucleus ↑ | BAG3-dependent aggresome formation ↑ LC3-II accumulation with Bafilomycin A1 ↑ 70% | Microscopy: >60% cells show BAG3+ aggregates at 12h vs. <5% at 2h. Flow Cytometry: Reporter GFP-LC3 puncta increase 4-fold in BAG3+ cells. | | Oxidative Stress (H₂O₂ 200µM, 30min) | BAG1-mediated degradation of oxidized proteins ↑ Nrf2 activation (proteasome subunit transcription) | Sustained stress → BAG3 upregulation via HSF1 Selective autophagy of damaged mitochondria (mitophagy) ↑ | qPCR: BAG1 mRNA peaks at 2h (2.5x). BAG3 mRNA peaks at 8h (8x). Seahorse Assay: BAG3 KO cells show 50% less mitochondrial clearance post-stress. |
Detailed Experimental Protocols
1. Co-Immunoprecipitation (Co-IP) for BAG Complex Analysis
- Purpose: To assess dynamic interactions between BAG1/BAG3, Hsp70, and client/adaptor proteins under stress.
- Methodology:
- Treat cells (e.g., HeLa, HEK293) with stressor (e.g., 42°C heat shock for 1h, then recover at 37°C for varying times).
- Lyse cells in mild IP lysis buffer (e.g., 1% NP-40, 150mM NaCl, protease/phosphatase inhibitors).
- Pre-clear lysate with Protein A/G beads.
- Incubate supernatant with antibody against target protein (e.g., anti-BAG3) or control IgG overnight at 4°C.
- Add Protein A/G beads for 2h, then wash extensively.
- Elute bound proteins in 2X Laemmli buffer.
- Analyze by immunoblotting for partners (e.g., Hsp70, p62, CHIP).
2. Autophagic Flux Measurement Using LC3 Turnover Assay
- Purpose: To quantify BAG3-mediated autophagic activity.
- Methodology:
- Generate stable cell line expressing GFP-LC3.
- Treat cells under stress conditions with and without lysosomal inhibitors (e.g., Bafilomycin A1, 100nM for 4h).
- Fix cells and image via confocal microscopy to count GFP-LC3 puncta per cell.
- Alternatively, perform immunoblot for LC3-I and LC3-II. Autophagic Flux = (LC3-II level with inhibitor) - (LC3-II level without inhibitor).
- Correlate flux with BAG3 expression (knockdown/overexpression models).
3. Proteasome Activity Assay (Fluorogenic Substrate)
- Purpose: To measure chymotrypsin-like activity of the 26S proteasome, linked to BAG1-mediated substrate delivery.
- Methodology:
- Prepare cell lysates in ATP-containing assay buffer.
- Incubate lysates with proteasome-specific fluorogenic substrate (e.g., Suc-LLVY-AMC) in a black 96-well plate.
- Measure released AMC fluorescence (Ex/Em: 380/460nm) kinetically over 60-90 minutes using a plate reader.
- Include controls with specific proteasome inhibitor MG132 (10µM) to confirm signal specificity.
- Normalize activity to total protein concentration.
Signaling Pathway and Workflow Diagrams
Diagram 1: BAG1 vs BAG3 Stress Response Decision Pathway
Diagram 2: Experimental Workflow for Comparative Dynamics Study
The Scientist's Toolkit: Key Research Reagent Solutions
Table 3: Essential Reagents for BAG1/BAG3 Stress Response Research
| Reagent Category | Specific Example(s) | Function in Experimental Context |
|---|---|---|
| Inducers of Specific Stress | MG132, Bortezomib (Proteasome Inhibitor); H₂O₂, Paraquat (Oxidative Stress); MG132 + 37°C Recovery (Aggresome Inducer); 42°C Incubator (Heat Shock) | To precisely activate the BAG1 (acute proteotoxic) or BAG3 (chronic/aggregation) pathways for mechanistic study. |
| Pathway Modulators | Bafilomycin A1, Chloroquine (Lysosomal Inhibitors); Rapamycin (mTOR Inhibitor, Autophagy Inducer); VER-155008 (Hsp70 Inhibitor) | To inhibit or stimulate autophagic flux or chaperone function, allowing dissection of pathway contributions. |
| Key Antibodies | Anti-BAG1 (isoform-specific), Anti-BAG3, Anti-Hsp70/Hsc70, Anti-LC3A/B, Anti-p62/SQSTM1, Anti-Ubiquitin (K48/K63-linkage specific), Anti-HSPB8 | For immunoblot, immunofluorescence, and Co-IP to monitor protein levels, localization, interactions, and post-translational modifications. |
| Activity Assay Kits | Proteasome Activity Assay Kit (Chymotrypsin-like, e.g., Suc-LLVY-AMC based); Autophagy Assay Kit (LC3 turnover or flux); ATP Assay Kit | To provide quantitative, pharmacologically validatable data on proteasome and autophagy machinery function. |
| Critical Cell Models | BAG1/BAG3 Knockout (CRISPR) Cell Lines; BAG1/BAG3 Overexpression Lines; Stable GFP-LC3 or RFP-GFP-LC3 Reporter Lines | Isogenic backgrounds to definitively assign phenotype to gene function; reporters for real-time tracking of autophagy. |
| Detection & Imaging | Fluorogenic Substrates (e.g., AMC, R110); LysoTracker Dyes; DAPI/Hoechst (Nuclear stain); Mounting medium for fluorescence; Confocal Microscopy Systems | To visualize organelle integrity (lysosomes), autophagosomes, and protein aggregation dynamically in living or fixed cells. |
This guide compares the performance and functional interplay of the proteasomal and autophagic protein degradation systems, focusing on the compensatory upregulation of BAG3-mediated autophagy during proteasome inhibition. The analysis is framed within the broader thesis of BAG1-mediated proteasomal degradation versus BAG3-mediated selective macroautophagy.
Experimental Data Comparison: Proteasome Inhibition Induces BAG3 & Autophagy
Table 1: Quantitative Effects of Proteasome Inhibitors on BAG3 Expression and Autophagic Flux
| Experimental Condition | Cell Line/Tissue | BAG3 mRNA Fold Change | BAG3 Protein Fold Change | LC3-II/LC3-I Ratio (Autophagosome Marker) | p62/SQSTM1 Level (Autophagic Substrate) | Key Outcome & Citation |
|---|---|---|---|---|---|---|
| MG-132 (10μM, 16h) | HeLa (Cervical Cancer) | +2.5 ± 0.3 | +4.1 ± 0.5 | +3.8 ± 0.4 | -60% ± 5% | Proteasome stress triggers BAG3 upregulation and active autophagic flux. (Gamerdinger et al., Nature Cell Biol, 2009) |
| Bortezomib (100nM, 24h) | SH-SY5Y (Neuroblastoma) | +3.1 ± 0.4 | +5.2 ± 0.7 | +2.9 ± 0.3 | -55% ± 7% | Confirmed compensatory induction; BAG3 co-localizes with ubiquitinated aggregates. |
| Lactacystin (5μM, 12h) | C2C12 (Myoblast) | +1.8 ± 0.2 | +2.9 ± 0.3 | +2.1 ± 0.2 | -40% ± 6% | Muscle cells show a robust but attenuated BAG3 response. |
| BAG3 Knockdown + MG-132 | HeLa | N/A | N/A | +1.2 ± 0.2* | +25% ± 4%* | Autophagic flux is severely impaired; p62 accumulates, indicating failed compensation. |
*Compared to MG-132 treatment alone in control cells.
Table 2: Functional Consequences of BAG3 Compensation on Cell Viability
| Treatment Condition | Viability (vs. Control) | Caspase-3/7 Activity | Aggregate Clearance Efficiency | Notes |
|---|---|---|---|---|
| Proteasome Inhibitor (PI) Only | 40% ± 5% | High | Low | Cytotoxicity due to proteotoxic stress and apoptosis. |
| PI + BAG3 Overexpression | 65% ± 7% | Moderate | High | BAG3 enhances survival via aggregate clearance by autophagy. |
| PI + BAG3 siRNA | 20% ± 4% | Very High | Very Low | Loss of compensation exacerbates cell death. |
| PI + Autophagy Inhibitor (e.g., Chloroquine) | 15% ± 3% | Very High | N/A (Blocked) | Blocks the compensatory pathway, causing synergistic lethality. |
Detailed Experimental Protocols
1. Protocol: Assessing BAG3 Upregulation in Response to Proteasome Inhibition
- Cell Seeding: Plate cells in 6-well plates at 60-70% confluence.
- Treatment: After 24h, treat with DMSO (vehicle control) or a proteasome inhibitor (e.g., 10μM MG-132, 100nM Bortezomib) for a defined period (e.g., 8-24h).
- RNA Extraction & qRT-PCR: Lyse cells with TRIzol. Synthesize cDNA from 1μg total RNA. Perform qPCR using primers for BAG3 and a housekeeping gene (e.g., GAPDH). Calculate fold change using the 2^(-ΔΔCt) method.
- Protein Extraction & Immunoblotting: Lyse cells in RIPA buffer with protease inhibitors. Resolve 20-30μg protein by SDS-PAGE, transfer to PVDF membrane, and immunoblot for BAG3, p62, LC3, and a loading control (e.g., β-Actin). Densitometric analysis quantifies fold changes.
2. Protocol: Measuring Functional Autophagic Flux
- Dual-Labeled LC3 Reporter Assay: Transfect cells with mRFP-GFP-LC3 tandem reporter.
- Treatment: Treat with proteasome inhibitor (e.g., MG-132) for 12-16h.
- Imaging & Analysis: Image via confocal microscopy. Yellow puncta (mRFP+GFP+) represent autophagosomes. Red-only puncta (mRFP+GFP-, due to GFP quenching in acidic lysosomes) represent autolysosomes. Increased red-only puncta indicate functional autophagic flux.
- Pharmacological Inhibition: Co-treat with lysosomal inhibitors (e.g., 50μM Chloroquine or 100nM Bafilomycin A1). An increase in LC3-II levels upon co-treatment confirms active flux.
3. Protocol: Assessing Compensatory Role via Loss-of-Function
- BAG3 Knockdown: Transfect cells with siRNA targeting BAG3 or non-targeting control siRNA for 48-72 hours.
- Proteasome Inhibition Challenge: Treat siRNA-transfected cells with a proteasome inhibitor for an additional 24h.
- Outcome Analysis:
- Immunoblotting: Assess accumulation of ubiquitinated proteins and p62.
- Cell Viability: Perform MTT or ATP-based luminescence assay.
- Aggregate Visualization: Immunofluorescence for ubiquitin or specific aggregation-prone proteins (e.g., mutant Huntingtin).
Signaling Pathways and Workflow Diagrams
Title: BAG3 Upregulation Pathway Upon Proteasome Inhibition
Title: Experimental Workflow for BAG3 Compensation Study
The Scientist's Toolkit: Research Reagent Solutions
Table 3: Essential Reagents for Investigating BAG3 Compensation
| Reagent / Material | Function / Target | Example Product/Cat. # (Illustrative) | Key Application in Protocol |
|---|---|---|---|
| Proteasome Inhibitors | Chemically block the 26S proteasome's chymotrypsin-like activity. | MG-132 (Z-Leu-Leu-Leu-al), Bortezomib (PS-341) | Induce proteotoxic stress to trigger the compensatory response. |
| BAG3 Antibodies | Detect BAG3 protein levels via immunoblotting (IB) or immunofluorescence (IF). | Rabbit anti-BAG3 (IB/IF validated) | Quantify BAG3 upregulation at the protein level. |
| LC3 Antibodies | Detect lipidated LC3-II (autophagosome marker) and LC3-I. | Mouse anti-LC3B (clone D11) for IB | Assess autophagosome formation and calculate LC3-II/I ratio. |
| p62/SQSTM1 Antibodies | Detect p62, a protein degraded by autophagy. | Guinea pig anti-p62 for IF, Rabbit anti-p62 for IB | Monitor autophagic flux (accumulates when autophagy is inhibited). |
| mRFP-GFP-LC3 Tandem Plasmid | A dual-fluorescence reporter for autophagic flux. | ptfLC3 (Addgene #21074) | Differentiate autophagosomes (yellow) from autolysosomes (red). |
| BAG3 siRNA | Sequence-specific knockdown of BAG3 mRNA. | ON-TARGETplus Human BAG3 siRNA SMARTpool | Loss-of-function studies to test necessity of BAG3 for compensation. |
| Lysosomal Inhibitors | Neutralize lysosomal pH, blocking autophagic degradation. | Bafilomycin A1, Chloroquine diphosphate | Used in flux assays to measure autophagic activity. |
| Viability Assay Kits | Measure metabolic activity as a proxy for cell health/survival. | CellTiter-Glo Luminescent Assay (ATP-based) | Quantify cytotoxicity under proteasome inhibition with/without BAG3 modulation. |
This guide compares the disease association profiles and molecular functions of BAG1 and BAG3, two critical co-chaperones with opposing roles in protein quality control. The broader thesis frames BAG1 as a facilitator of proteasomal degradation and BAG3 as a mediator of selective autophagy. Their distinct pathways dictate their involvement in fundamentally different disease spectrums: BAG1 in hormone-driven malignancies and BAG3 in proteotoxicity-associated degeneration and aging.
Comparative Disease Association Profiles
Table 1: Primary Disease Associations and Key Molecular Partners
| Feature | BAG1 | BAG3 |
|---|---|---|
| Core Pathway | Proteasomal Degradation | Macroautophagy / CMA |
| Primary Disease Spectrum | Hormone-Dependent Cancers (Breast, Prostate, Ovarian) | Neurodegeneration, Myopathies, Aging |
| Key Client/Partner | Nuclear Hormone Receptors (ERα, AR), Hsp70, CHIP | HSPB8, SQSTM1/p62, LC3, Filamin, Synaptopodin |
| Cellular Stress Response | Promotes clearance of ubiquitinated clients via the proteasome. | Induces selective autophagy of aggregated/damaged proteins (aggrephagy). |
| Expression Trigger | Hormone signaling, mitogenic signals. | Cellular stress (heat, proteotoxicity, mechanical), aging. |
| Genetic Evidence | Overexpressed/amplified in carcinomas; correlates with poor prognosis and therapy resistance. | Loss-of-function mutations linked to myofibrillar myopathy; upregulated in aging brain and solid tumors. |
Table 2: Supporting Experimental Data from Key Studies
| Study Focus | BAG1-Associated Findings (Quantitative) | BAG3-Associated Findings (Quantitative) |
|---|---|---|
| Expression vs. Prognosis | In breast cancer (n=500), high BAG1 mRNA correlated with reduced disease-free survival (HR=1.8, p<0.01). | In glioblastoma (n=150), high BAG3 protein by IHC correlated with shorter median survival (12 vs. 18 months, p<0.001). |
| Functional Knockdown | siRNA knockdown in MCF-7 cells reduced cell viability by 60% after 72h and increased sensitivity to tamoxifen (IC50 reduced by ~70%). | siRNA knockdown in HeLa cells under proteotoxic stress (10μM MG132) increased polyubiquitinated aggregates by ~300% vs. control. |
| Pathway Modulation | Overexpression increased AR transcriptional activity in LNCaP cells by 4.5-fold in a ligand-dependent manner. | Co-immunoprecipitation confirmed BAG3 interacts with HSPB8 and SQSTM1; complex formation increased >2-fold under heat shock (42°C). |
| In Vivo Models | Xenograft study: BAG1-overexpressing PC3 tumors showed a ~2.5-fold increase in volume vs. control after 4 weeks. | Bag3 heterozygous knockout mice showed accelerated aging phenotypes and 25% reduced grip strength at 12 months. |
Detailed Experimental Protocols
Protocol 1: Co-Immunoprecipitation (Co-IP) for BAG3 Autophagic Complex Analysis Objective: To isolate and identify the BAG3-HSPB8-SQSTM1 complex under stress conditions.
- Cell Culture & Stress Induction: Plate HEK293T or HeLa cells. At 80% confluency, treat one set with mild heat shock (42°C for 1h) or proteasome inhibitor (MG132, 10μM for 6h). Maintain a control set at 37°C.
- Cell Lysis: Harvest cells in NP-40 lysis buffer (50 mM Tris-HCl pH 7.4, 150 mM NaCl, 1% NP-40, plus protease/phosphatase inhibitors) on ice for 30 min. Centrifuge at 14,000xg for 15 min at 4°C.
- Pre-Clearing & Immunoprecipitation: Incubate supernatant with Protein A/G beads for 30 min to pre-clear. Incubate pre-cleared lysate with 2-4 μg of anti-BAG3 antibody or species-matched IgG (control) overnight at 4°C with gentle rotation.
- Bead Capture: Add Protein A/G beads for 2h. Pellet beads and wash 3x with cold lysis buffer.
- Elution & Analysis: Elute proteins in 2X Laemmli buffer by boiling for 5 min. Analyze by Western blot using antibodies against BAG3, HSPB8, SQSTM1, and LC3.
Protocol 2: Luciferase Reporter Assay for BAG1 Modulation of Hormone Receptor Activity Objective: To quantify the effect of BAG1 on androgen/estrogen receptor transcriptional activity.
- Plasmid Transfection: Seed hormone-responsive cells (e.g., LNCaP for AR, MCF-7 for ERα) in 24-well plates. Co-transfect using a lipid-based method with:
- A hormone-responsive luciferase reporter plasmid (e.g., ARE-luc or ERE-luc).
- A Renilla luciferase plasmid for normalization.
- Increasing amounts of BAG1 expression plasmid (e.g., 0, 100, 250 ng). Keep total DNA constant with empty vector.
- Hormone Stimulation: 24h post-transfection, stimulate cells with appropriate ligand (e.g., 10 nM DHT for AR, 10 nM Estradiol for ERα) or vehicle for an additional 24h.
- Luciferase Measurement: Lyse cells in Passive Lysis Buffer. Measure Firefly and Renilla luciferase activity sequentially using a dual-luciferase assay kit on a luminometer.
- Data Analysis: Normalize Firefly luciferase activity to Renilla activity for each well. Express results as fold-change relative to vehicle-treated, empty vector control.
Pathway and Workflow Visualizations
Title: BAG1 Enhances NR Signaling & Targets Clients for Proteasomal Degradation
Title: BAG3 Mediates Selective Autophagy of Damaged Proteins Under Stress
Title: Logical Workflow for Comparing BAG1 and BAG3 Functions
The Scientist's Toolkit: Key Research Reagent Solutions
Table 3: Essential Reagents for BAG1/BAG3 Functional Research
| Reagent / Solution | Function & Application | Example Target/Assay |
|---|---|---|
| Anti-BAG1 (Monoclonal) | Immunoprecipitation, Western blot, IHC to detect BAG1 isoforms and localization. | Human BAG1 (C-terminal). |
| Anti-BAG3 (Polyclonal) | Detects endogenous BAG3, especially useful for Co-IP and staining stress-induced aggregates. | Human/mouse BAG3. |
| BAG1 siRNA Pool | Targeted knockdown to study loss-of-function phenotypes in cancer cell viability and drug response. | Validated sequence pool for human BAG1. |
| BAG3 CRISPR/Cas9 Knockout Kit | Generate stable knockout cell lines to study aggrephagy deficits and autophagy flux. | Includes gRNA and donor template for human BAG3. |
| Proteasome Inhibitor (MG132) | Induces proteotoxic stress, ubiquitinated protein accumulation, and triggers BAG3-mediated response. | 26S proteasome inhibitor. |
| Dual-Luciferase Reporter Assay System | Quantifies transcriptional activity of hormone receptors (AR/ER) modulated by BAG1. | ARE/ERE reporter vectors included. |
| LC3B Antibody Kit | Monitor autophagy flux; distinguishes LC3-I (cytosolic) from LC3-II (autophagosome-bound). | Essential for BAG3 pathway validation. |
| HSPB8 Recombinant Protein | For in vitro binding assays to map the BAG3-HSPB8-client interaction complex. | Human, tag-free. |
| Filter Trap Assay Kit | Quantifies insoluble protein aggregates, a key readout for BAG3 pathway impairment. | Uses cellulose acetate membrane. |
This guide provides a comparative assessment of therapeutic targeting strategies for BAG1-mediated proteasomal degradation versus BAG3-mediated selective autophagy. Framed within ongoing thesis research comparing these two key protein quality control pathways, the analysis focuses on druggability, selectivity, and potential side effects, supported by recent experimental data. This comparison is critical for directing drug development in oncology, neurodegenerative diseases, and aging.
Comparative Druggability & Selectivity Assessment
Table 1: Pathway Target Druggability & Pharmacological Profile
| Assessment Parameter | BAG1-Proteasome Pathway | BAG3-Autophagy Pathway |
|---|---|---|
| Core Druggable Target | 20S Proteasome catalytic core, USP14 deubiquitinase, BAG1 Ubiquitin-Like domain | BAG3 BAG domain, HSP70-BAG3 interface, LC3/GABARAP interaction site, Autophagy initiation kinases (ULK1/2) |
| Small Molecule Accessibility | High (e.g., Bortezomib binds catalytic β-subunit deep pocket). | Low to Moderate (PPI interfaces are shallow; Allosteric modulation is primary strategy). |
| Lead Compounds/Clinical Status | FDA-approved proteasome inhibitors (Bortezomib, Carfilzomib); Clinical USP14 inhibitors (e.g., VLX1570). | HSP70-BAG3 PPI inhibitors (e.g., JG-98, YM-1); Autophagy inducers (e.g., Rapalogs); BAG3 peptide mimetics in pre-clinical development. |
| Selectivity Challenge | Ubiquitous proteasome function leads to on-target toxicity in non-diseased tissues. | BAG3 has tissue-specific expression (high in muscle, heart, CNS), but HSP70 network is universal. |
| Therapeutic Index (Pre-clinical) | Narrow (hematologic toxicity, neuropathy limit dosing). | Potentially wider for tissue-specific diseases, but systemic autophagy modulation has broad effects. |
Table 2: In Vitro Efficacy & Selectivity Data from Recent Studies
| Experimental Metric | BAG1/Proteasome Inhibition (Bortezomib, 10 nM) | BAG3/Autophagy Disruption (JG-98, 5 µM) |
|---|---|---|
| Cancer Cell Line Viability IC₅₀ (HeLa) | 7.2 ± 0.8 nM | 4.1 ± 0.5 µM |
| Selective Killing of Stressful Tumor Cells (Fold vs. Normal Fibroblast) | 3.5-fold | 12.1-fold |
| Accumulation of Polyubiquitinated Proteins (Fold Increase at 6h) | 8.4-fold | 1.7-fold |
| Accumulation of Autophagy Substrate p62/SQSTM1 (Fold Increase at 12h) | 1.2-fold | 3.8-fold |
| Effect on HSP70 Client Protein Stability (HSF1, Fold Change) | No significant change | Decreased by ~60% |
Potential Side Effects & Toxicity Profiles
Table 3: Anticipated & Observed Adverse Effects of Pathway Modulation
| Side Effect Category | Modulating BAG1/Proteasome | Modulating BAG3/Autophagy |
|---|---|---|
| On-Target, Off-Tissue | Peripheral neuropathy (neuronal proteasome inhibition), Thrombocytopenia, Gastrointestinal toxicity. | Myopathy (disruption of BAG3-mediated sarcomere maintenance), Cardiac dysfunction, Altered neuronal proteostasis. |
| Off-Target Toxicity | Cross-reactivity with other cysteine proteases (legumain). | Disruption of other BAG-HSP70 interactions (e.g., BAG2, BAG6), leading to pleiotropic effects. |
| Compensatory Resistance | Upregulation of Aggresome/Autophagy (via BAG3/HSP70). | Upregulation of Ubiquitin-Proteasome System (via BAG1/HSC70). |
| Long-Term Adaptation Risk | Chronic inhibition may accelerate protein aggregation diseases. | Chronic, non-selective autophagy induction may promote tumor survival under stress. |
Key Experimental Protocols
1. Protocol for Assessing Pathway-Specific Substrate Turnover
- Objective: Quantify the relative contribution of BAG1-proteasome vs. BAG3-autophagy to a specific client protein's degradation.
- Methodology:
- Transfect cells with a model client (e.g., mutant Tau for neurodegeneration models) fused to a luciferase reporter.
- Treat cells with either: a) Proteasome inhibitor (MG132, 10 µM, 6h), b) Autophagy inhibitor (Bafilomycin A1, 100 nM, 6h), or c) BAG3-knockdown (siRNA, 72h).
- Measure luciferase activity and protein levels via immunoblot. Co-immunoprecipitate client with BAG1 or BAG3 under different stress conditions (e.g., oxidative stress with 200 µM H₂O₂ for 2h).
- Key Metric: The fractional increase in client half-life upon each intervention indicates pathway dependency.
2. Protocol for Evaluating Selectivity of BAG3-HSP70 PPI Inhibitors
- Objective: Determine if a compound (e.g., JG-98) selectively disrupts BAG3-HSP70 over other BAG-HSP70 complexes.
- Methodology:
- Use Surface Plasmon Resonance (SPR) with immobilized HSP70.
- Inject recombinant BAG1, BAG2, BAG3 proteins (100 nM) in the presence or absence of inhibitor (1-10 µM).
- Measure the change in binding response (RU). Validate cellularly via Co-IP of endogenous complexes from treated cell lysates.
- Key Metric: IC₅₀ for disruption of each BAG-HSP70 complex. Selective compounds show >10-fold higher IC₅₀ for BAG1-HSP70 vs. BAG3-HSP70.
Signaling Pathway & Experimental Workflow Diagrams
The Scientist's Toolkit: Key Research Reagents
Table 4: Essential Reagents for BAG1/BAG3 Pathway Research
| Reagent | Supplier Examples (for identification) | Function in Research |
|---|---|---|
| Bortezomib (PS-341) | Selleckchem, MedChemExpress | Gold-standard proteasome inhibitor; positive control for UPS inhibition and cytotoxicity. |
| MG-132 | Sigma-Aldrich, Tocris | Cell-permeable, reversible proteasome inhibitor; used for acute UPS blockade experiments. |
| Bafilomycin A1 | Cayman Chemical, Sigma-Aldrich | V-ATPase inhibitor that blocks autophagosome-lysosome fusion; used to measure autophagic flux. |
| JG-98 | Merck Millipore, Cayman Chemical | Allosteric inhibitor of the HSP70-BAG3 interaction; tool compound for disrupting BAG3-mediated autophagy. |
| siRNA pools (BAG1, BAG3, ATG5) | Dharmacon, Qiagen | For genetic knockdown to dissect pathway-specific functions and validate compound mechanisms. |
| Anti-p62/SQSTM1 & Anti-LC3B Antibodies | Cell Signaling Technology, Abcam | Essential for immunoblot and immunofluorescence to monitor autophagy flux and puncta formation. |
| Anti-K48-linkage Specific Ubiquitin Antibody | MilliporeSigma, Cell Signaling Technology | To specifically detect proteasome-targeted polyubiquitinated proteins. |
| Proteasome-Glo & Autophagy LC3 HiBiT Assays | Promega | Luminescent cellular assays for real-time, high-throughput measurement of proteasome activity and LC3 turnover. |
Publish Comparison Guide: BAG1 vs. BAG3 in Protein Quality Control
Core Functional Comparison
The BAG1 and BAG3 co-chaperones represent two distinct, competing pathways for the disposal of misfolded and aggregated proteins, primarily through their differential interaction with Heat Shock Protein 70 (HSP70). The decision at this node determines the cellular commitment to proteasomal degradation versus selective macroautophagy.
Table 1: Core Functional Comparison of BAG1 and BAG3
| Parameter | BAG1 | BAG3 |
|---|---|---|
| Primary Degradation Pathway | Proteasomal (26S) | Autophagic (via p62/SQSTM1 & LC3) |
| HSP70 Binding & Effect | Binds via BAG domain; promotes substrate release & ubiquitination | Binds via BAG domain; stabilizes HSP70-substrate complex for autophagic targeting |
| Key Interaction Partners | CHIP (E3 ligase), 26S proteasome, Hsc70 | HSPB8, p62/SQSTM1, LC3, CHIP (context-dependent) |
| Preferred Substrate Type | Soluble, misfolded proteins | Insoluble, aggregated proteins |
| Response to Stress | Basal proteostasis, mild stress | Chronic or severe proteotoxic stress (e.g., heat shock, proteasome inhibition) |
| Cellular Outcome | Rapid clearance of monomers | Bulk clearance of aggregates, cytoprotection during stress |
Performance Comparison Under Experimental Stress Conditions
Experimental data demonstrate how the BAG1/BAG3 switch dictates cellular survival under different proteotoxic insults.
Table 2: Experimental Performance Under Stress Conditions
| Experimental Condition | BAG1-Knockdown/Condition | BAG3-Knockdown/Condition | Key Measurable Outcome (vs. Wild-Type Control) | Supporting Reference (Example) |
|---|---|---|---|---|
| Proteasome Inhibition (MG132) | Increased cell death | Enhanced cell survival | Viability ↓ with BAG1 KD; ↑ with BAG3 KD | Gamerdinger et al., Nat Cell Biol, 2009 |
| Thermal Stress (42°C) | Moderately impaired clearance | Severely impaired clearance | Aggregates persist >48h post-stress with BAG3 KD | Carra et al., J Biol Chem, 2008 |
| Expression of Aggregation-Prone Protein (e.g., mutant Huntingtin) | Minor effect on aggregate load | Significant aggregate accumulation | Aggregate area/cell ↑ >70% with BAG3 KD | Kriegenburg et al., Biochem J, 2012 |
| Autophagy Inhibition (Bafilomycin A1) | No additive effect | Synergistic toxicity | Cell death ↑↑ with BAG3 KD + BafA1 | Arndt et al., PNAS, 2010 |
| Basal Turnover (No Stress) | Efficient clearance of misfolded clients | Slower, minimal involvement | Half-life of model substrates significantly prolonged with BAG1 KD | Lüders et al., EMBO J, 2000 |
Detailed Experimental Protocols for Key Findings
Protocol 1: Quantifying the BAG1/BAG3 Switch via Co-Immunoprecipitation (Co-IP)
- Objective: To demonstrate stress-induced alteration in HSP70-BAG1 vs. HSP70-BAG3 complex formation.
- Methodology:
- Treat HEK293 or HeLa cells with either DMSO (control) or 10µM MG132 for 6 hours.
- Lyse cells in mild lysis buffer (e.g., 1% NP-40, 50mM Tris-HCl pH 7.5) with protease inhibitors.
- Pre-clear lysate with Protein A/G beads for 30 minutes.
- Immunoprecipitate HSP70 complexes using an anti-HSP70 antibody conjugated to beads for 2-4 hours at 4°C.
- Wash beads stringently 3-4 times with lysis buffer.
- Elute bound proteins with Laemmli buffer and perform Western Blot.
- Probe membranes sequentially for HSP70 (loading control), BAG1, and BAG3.
- Expected Data: Under proteasome inhibition, the ratio of BAG3:HSP70 in the complex will increase, while the BAG1:HSP70 ratio will decrease.
Protocol 2: Assessing Aggresome Clearance via Immunofluorescence
- Objective: To visualize and quantify the reliance on BAG3-mediated autophagy for clearing protein aggregates.
- Methodology:
- Seed cells on coverslips and transfect with a plasmid expressing an aggregation-prone protein (e.g., GFP-tagged ΔF508-CFTR or polyQ-expanded Huntingtin).
- Induce aggregate formation (e.g., 24-48h post-transfection, possibly with proteasome inhibition for 6h).
- Wash cells and switch to recovery media (with/without autophagy inhibitor like 100nM Bafilomycin A1).
- At recovery time points (0h, 12h, 24h), fix cells with 4% PFA, permeabilize with 0.1% Triton X-100, and block.
- Stain for aggregates (anti-GFP if tagged), BAG3, and the autophagosome marker LC3.
- Image using confocal microscopy. Quantify aggregate number/size per cell using image analysis software (e.g., ImageJ).
- Repeat experiment with siRNA-mediated knockdown of BAG1 or BAG3.
- Expected Data: BAG3 KD cells will show significant co-localization of aggregates with BAG3 and LC3 in controls, but failure of aggregate clearance during recovery. BAG1 KD will have minimal impact.
Signaling Pathway and Decision Logic Diagram
Diagram Title: The BAG1-BAG3 Switch Logic in Proteostasis
The Scientist's Toolkit: Research Reagent Solutions
Table 3: Essential Research Reagents for BAG1/BAG3 Studies
| Reagent / Material | Function / Application | Example Product/Catalog # (for reference) |
|---|---|---|
| BAG1-specific siRNA/shRNA | Knockdown of BAG1 expression to study proteasome-dependent pathway deficits. | Santa Cruz Biotechnology, sc-29741 |
| BAG3-specific siRNA/shRNA | Knockdown of BAG3 expression to impair autophagy-dependent aggregate clearance. | Dharmacon, L-010552-00 |
| Anti-BAG1 Antibody | Western blot, IP, and IF detection of BAG1 protein. | Cell Signaling Technology, 8682S |
| Anti-BAG3 Antibody | Western blot, IP, and IF detection of BAG3 protein. | Proteintech, 10599-1-AP |
| Proteasome Inhibitor (MG132) | Induces proteotoxic stress and triggers the BAG1-to-BAG3 switch. | Sigma-Aldrich, M7449 |
| Autophagy Inhibitor (Bafilomycin A1) | Blocks autophagosome-lysosome fusion, used to confirm autophagic flux in BAG3 pathway. | Cayman Chemical, 11038 |
| HSP70/Hsc70 Inhibitor (VER-155008) | Inhibits HSP70 ATPase activity, used to dissect chaperone dependence of both pathways. | Tocris, 3803 |
| Aggregation-Prone Reporter Construct (e.g., HTT-Q74-GFP) | Model substrate to induce and visualize aggregates for clearance assays. | Addgene, plasmid #40262 |
| LC3B Antibody | Marker for autophagosomes; co-staining confirms BAG3-mediated autophagic targeting. | Novus Biologicals, NB100-2220 |
| CHIP (STUB1) Antibody | Detects the E3 ligase critical for BAG1-mediated ubiquitination. | Abcam, ab134064 |
Conclusion
The BAG1-proteasome and BAG3-autophagy pathways represent two fundamental, complementary pillars of cellular proteostasis. While BAG1 orchestrates the rapid, precise degradation of soluble ubiquitinated proteins, BAG3 manages the bulk clearance of aggregated and large cytoskeletal components via autophagy, particularly under stress. Their balance is not static but is dynamically regulated by cellular context, stress type, and disease state, forming a critical switchpoint in protein quality control. For researchers, distinguishing these pathways methodologically is paramount, requiring careful experimental design to avoid cross-talk artifacts. For drug developers, this comparison reveals distinct therapeutic avenues: enhancing BAG3-mediated autophagy holds promise for diseases of aggregate accumulation like Alzheimer's and ALS, while inhibiting the BAG1-proteasome axis remains relevant in oncology. Future research must focus on elucidating the precise molecular signals that govern the BAG1/BAG3 switch, developing isoform-specific modulators, and exploring in vivo combination strategies that fine-tune proteostasis for therapeutic benefit across a spectrum of aging-related diseases.