Bacterial Protein Quality Control: The Essential Role of ATP-Dependent Chaperones and Proteases in Pathogen Survival
This article provides a comprehensive exploration of ATP-dependent chaperones and proteases as the core machinery of bacterial protein quality control (PQC).
Bacterial Protein Quality Control: The Essential Role of ATP-Dependent Chaperones and Proteases in Pathogen Survival
Abstract
This article provides a comprehensive exploration of ATP-dependent chaperones and proteases as the core machinery of bacterial protein quality control (PQC). Targeting researchers and drug development professionals, it covers the foundational biology of systems like Clp, Lon, and FtsH, explores modern methodologies for studying their function, details common experimental challenges and optimization strategies, and validates findings through comparative analysis across bacterial species. We synthesize current research to highlight how targeting these PQC systems presents a promising, underexplored avenue for novel antibiotic development against resistant pathogens.
The Molecular Guardians: Core Principles of ATP-Dependent Bacterial PQC Systems
Protein homeostasis (proteostasis) encompasses the coordinated cellular processes that maintain the structural and functional integrity of the proteome. For bacteria, which inhabit dynamic and often stressful environments, maintaining proteostasis is not merely advantageous—it is non-negotiable for survival. The Protein Quality Control (PQC) network is the fail-safe system that prevents the accumulation of non-native, misfolded, or aggregated proteins, which are cytotoxic and can disrupt essential cellular functions. This network is fundamentally powered by ATP-dependent chaperones and proteases, forming a triage system of refolding or degradation. This whitepaper frames bacterial PQC within the critical research context of ATP-dependent chaperone-protease systems, highlighting their mechanisms, quantitative dynamics, and experimental interrogation.
The Core ATP-Dependent PQC Machinery: Chaperones and Proteases
The bacterial PQC system is a hierarchical, ATP-fueled network. Its primary components are molecular chaperones (foldases and holdases) and compartmentalized AAA+ (ATPases Associated with diverse cellular Activities) proteases.
2.1 ATP-Dependent Chaperones
- DnaK/DnaJ/GrpE (Hsp70 System): The primary foldase system. DnaJ (Hsp40) recognizes exposed hydrophobic patches on misfolded clients and delivers them to DnaK (Hsp70). ATP hydrolysis in DnaK, regulated by GrpE, drives conformational changes that facilitate folding.
- GroEL/GroES (Hsp60 Chaperonin): A cylindrical complex that provides an isolated, Anfinsen cage-like chamber for single protein domains to fold unimpeded by aggregation. GroES acts as a lid, and ATP hydrolysis drives the folding cycle.
- ClpB (Hsp104 homolog): A disaggregase that, in collaboration with DnaKJE, disentangles and reactivates protein aggregates.
2.2 ATP-Dependent Proteases These are degradation machines that recognize, unfold, and degrade irreparably damaged proteins.
- Lon Protease: A soluble AAA+ protease that degrades specific regulatory proteins and damaged proteins.
- Clp Proteases: Composed of a regulatory AAA+ component (ClpA, ClpX) and a proteolytic core (ClpP). ClpA/X recognizes, unfolds, and translocates substrates into the ClpP chamber for degradation.
- FtsH: A membrane-anchored AAA+ protease crucial for membrane protein quality control.
- HslUV: A two-component system where HslU (AAA+) unfolds and feeds substrates to HslV (protease).
Table 1: Core ATP-Dependent Bacterial PQC Components and Functions
| Component | Type | Gene | Primary Function | Key Substrates/Features |
|---|---|---|---|---|
| DnaK | Chaperone (Hsp70) | dnaK | Protein folding, complex dissociation | Misfolded cytosolic proteins; regulated by DnaJ & GrpE |
| GroEL | Chaperonin (Hsp60) | groEL | ATP-driven folding in an isolated chamber | Partially folded intermediates; works with GroES lid |
| ClpB | Disaggregase | clpB | Disaggregation of protein aggregates | Collaborates with DnaKJE system; hexameric AAA+ |
| Lon | Protease | lon | ATP-dependent degradation | SOS response regulators, damaged proteins |
| ClpXP | Protease Complex | clpX, clpP | Unfolding & degradation | SsrA-tagged proteins, regulatory proteins (e.g., RpoS) |
| FtsH | Membrane Protease | ftsH | Membrane & cytoplasmic protein QC | SecY, LpxC; essential in E. coli |
The PQC Triage: Signaling Pathways and Logical Workflow
The decision to refold or degrade a client protein follows a triage logic. Key signaling elements include the cellular ATP:ADP ratio, specific degron tags (e.g., the SsrA tag added by trans-translation), and chaperone binding kinetics.
Diagram Title: Bacterial PQC Triage Logic for Misfolded Proteins
Quantitative Insights: Key Metrics in Bacterial PQC Research
Understanding PQC efficiency requires quantitative measurement of protein stability, aggregation, and degradation kinetics.
Table 2: Key Quantitative Parameters in Bacterial PQC Studies
| Parameter | Typical Experimental Method | Exemplary Data Range (E. coli) | Biological Significance |
|---|---|---|---|
| ATP Hydrolysis Rate | NADH-coupled assay, malachite green | ClpX: 50-100 min⁻¹ (per hexamer) | Powers unfolding/translocation |
| Unfolding/Translocation Rate | FRET-based degradation assays | 50-200 aa/min (ClpXP) | Determines degradation capacity |
| Chaperone Abundance | Quantitative proteomics | DnaK: ~50,000 copies/cell; GroEL: ~20,000 | Capacity for folding/repair |
| In Vivo Aggregation Threshold | Sedimentation assay + SDS-PAGE | Thermal stress (42°C) induces ~5-15% proteome aggregation | Measures PQC network failure point |
| Protease Degradation Capacity | Pulse-chase + Western blot | Lon degrades ~200 substrates/cell/min under stress | Overall PQC clearance capability |
Essential Experimental Protocols
5.1 Protocol: In Vitro ATP-Dependent Degradation Assay (ClpXP) Objective: To reconstitute and quantify the degradation kinetics of a fluorescently tagged substrate. Materials: Purified ClpX hexamer, ClpP14 tetradecamer, ATP regeneration system (Creatine Phosphate/Creatine Kinase), FITC-labeled SsrA-tagged substrate (e.g., GFP-ssrA), fluorescence plate reader. Procedure:
- Reaction Setup: In a 96-well plate, mix 1 µM ClpX, 2 µM ClpP, 5 mM ATP, 10 mM Creatine Phosphate, 0.1 mg/mL Creatine Kinase, and reaction buffer (50 mM Tris-HCl pH 7.5, 100 mM KCl, 20 mM MgCl₂).
- Initiation: Start the reaction by adding 100 nM FITC-substrate. Final volume: 100 µL.
- Measurement: Immediately place plate in a pre-warmed (30°C) fluorescence plate reader. Monitor FITC fluorescence (ex: 488 nm, em: 520 nm) every 30 seconds for 60 minutes.
- Controls: Include reactions without ATP, without ClpX, or without ClpP.
- Analysis: Fit fluorescence decay curves to a single-exponential model to obtain the degradation rate constant (k_deg).
5.2 Protocol: In Vivo Protein Aggregation Pull-Down Objective: Isolate and quantify aggregated proteins from bacterial cells under stress. Materials: E. coli culture, Lysis buffer (50 mM HEPES pH 7.4, 150 mM KCl, 1% Triton X-100, 10 mM MgCl₂, 1 mM PMSF, benzonase nuclease), Detergent-insoluble fraction filtration kit. Procedure:
- Stress Induction: Grow E. coli to mid-log phase (OD600 ~0.6). Apply stress (e.g., heat shock at 42°C for 30 min). Harvest 10 mL cells by centrifugation.
- Lysis: Resuspend pellet in 500 µL Lysis buffer. Lyse cells by sonication (3 x 10 sec pulses, 30% amplitude) on ice.
- Clear Lysate: Centrifuge at 10,000 x g for 10 min at 4°C to remove cell debris. Collect supernatant (total soluble fraction).
- Aggregate Isolation: Filter the supernatant through a 0.22 µm cellulose acetate membrane filter (pre-wet with lysis buffer) using a syringe. The filter retains large, aggregated complexes.
- Wash & Elute: Wash filter twice with 500 µL lysis buffer without Triton X-100. Elute retained aggregates by incubating filter in 200 µL of 2x Laemmli SDS sample buffer at 95°C for 10 min.
- Analysis: Analyze eluate (aggregate fraction) and total soluble fraction by SDS-PAGE and Western blotting for proteins of interest.
The Scientist's Toolkit: Key Research Reagents
Table 3: Essential Reagents for Bacterial PQC Research
| Reagent / Material | Supplier Examples | Function in PQC Research |
|---|---|---|
| ATPγS (Adenosine 5′-O-[γ-thio]triphosphate) | Sigma-Aldrich, Jena Bioscience | Non-hydrolyzable ATP analog used to trap chaperone/substrate complexes or inhibit ATP-dependent steps. |
| Protease Inhibitor Cocktails (e.g., PIC, PMSF) | Roche, Thermo Fisher | Inhibits endogenous proteolytic activity during protein purification and lysate preparation to preserve substrates. |
| SsrA-Tagged Fluorescent Substrates (e.g., GFP-ssrA) | In-house expression, custom peptide synthesis | Standardized, recognizable substrate for AAA+ proteases (ClpXP, ClpAP) in degradation assays. |
| Anti-DnaK / Anti-GroEL Antibodies | Abcam, StressMarq Biosciences | Immunodetection of chaperone levels, localization, or co-immunoprecipitation of client proteins. |
| Benzonase Nuclease | Merck Millipore | Degrades nucleic acids in lysates to reduce viscosity and prevent non-specific co-aggregation with proteins. |
| ATP Regeneration System (Creatine Kinase/Phosphate) | Roche, Sigma-Aldrich | Maintains constant, saturating ATP levels in extended in vitro assays of chaperone/protease activity. |
| IPTG (Isopropyl β-D-1-thiogalactopyranoside) | GoldBio, Thermo Fisher | Inducer for overexpression of recombinant PQC proteins or substrates from plasmid vectors (e.g., pET vectors). |
| NativeTag or HaloTag Systems | Novagen, Promega | For covalent, specific labeling of proteins for single-molecule tracking of folding/degradation dynamics. |
Diagram Title: Workflow for Bacterial PQC Mechanistic Research
The bacterial PQC network, centered on ATP-dependent chaperones and proteases, is a validated but underexploited target for novel antimicrobials. Disrupting PQC—through inhibitors of ClpP proteases, DnaK, or GroEL—severely compromises bacterial viability, especially under stress, and can re-sensitize pathogens to existing antibiotics. A deep, quantitative understanding of the kinetics, regulation, and interdependencies within this network, as framed by ongoing thesis-level research, is crucial for designing the next generation of precision anti-infectives. The non-negotiable nature of bacterial PQC for survival makes it an Achilles' heel ripe for therapeutic intervention.
Within the critical framework of bacterial protein quality control (PQC), ATP-dependent enzymes are the principal arbiters of proteostasis. This technical guide provides a taxonomy and functional analysis of the core AAA+ (ATPases Associated with diverse cellular Activities) chaperones and proteases that define this field. The discussion is framed within the broader thesis that targeting these PQC systems represents a promising, yet underexploited, avenue for novel antibacterial strategies, given their essentiality in stress survival, virulence regulation, and cellular homeostasis.
A Functional Taxonomy of Key PQC ATPases
| Enzyme Class | Key Player | Primary Function | Substrate Recognition | Cellular Role in PQC |
|---|---|---|---|---|
| Disaggregase/Chaperone | ClpB (Hsp104) | Disassembles and reactivates aggregated proteins. | Binds protein aggregates via middle domain; cooperates with DnaK/J. | Stress recovery, thermotolerance. |
| Hsp70 Chaperone System | DnaK (Hsp70) | Prevents aggregation, promotes folding/refolding. | Recognizes short hydrophobic peptides; DnaJ (Hsp40) delivers substrates. | De novo folding, stress response, holding client proteins. |
| Hsp40 Co-chaperone | DnaJ (Hsp40) | Stimulates DnaK ATPase activity; substrate targeting. | Binds hydrophobic patches on non-native proteins. | Substrate delivery to DnaK; determines client specificity. |
| Protease (Unfolding) | ClpXP | Processive unfolding and degradation of tagged/regulatory proteins. | Recognizes specific degron tags (e.g., ssrA tag) via ClpX pore loops. | Degradation of stalled translation products, stress response, cell cycle regulation. |
| Protease (Processive) | Lon | Degrades unfolded, damaged, and specific regulatory proteins. | Recognizes hydrophobic stretches, specific sequences (e.g., SulA). | Removal of misfolded proteins, metabolic regulation, SOS response. |
| Membrane-Integrated Protease | FtsH | Degrades misfolded membrane/cytoplasmic proteins; monitors lipoproteins. | Recognizes cytoplasmic domains; degrades proteins tagged with YccA. | Membrane PQC, lipopolysaccharide biosynthesis regulation. |
Table 1: Functional taxonomy of core bacterial AAA+ PQC enzymes.
Detailed Mechanisms & Quantitative Data
3.1 The ClpB-DnaK/J Bichaperone Disaggregase System ClpB is a hexameric AAA+ machine that threads aggregated proteins through its central pore. Its activity is strictly dependent on the DnaK/J/GrpE system, which binds to exposed hydrophobic loops on ClpB and the aggregate surface, facilitating disaggregation. Recent single-molecule studies quantify the process:
| Parameter | Value | Experimental Method |
|---|---|---|
| ClpB Hexamer ATPase Rate | ~400 ATP/min/hexamer | Coupled enzymatic assay (NADH oxidation). |
| Translocation Speed | 40-80 amino acids/sec | Single-molecule FRET with fluorescently tagged substrate. |
| Cooperative DnaK Binding Sites | 3-6 DnaK per ClpB hexamer | Surface Plasmon Resonance (SPR). |
| Force Generation (Unfolding) | >20 pN | Optical tweezers experiments. |
Table 2: Key quantitative parameters of the ClpB-DnaK disaggregation system.
3.2 Proteolytic Complexes: ClpXP, Lon, and FtsH These proteases share a common architecture: an AAA+ hexameric unfoldase (ClpX, Lon's AAA+ domain, FtsH's AAA+ ring) coupled to a peptidase chamber (ClpP, Lon's proteolytic domain, FtsH's Zn²⁺-metalloprotease domain). Key comparative data:
| Parameter | ClpXP | Lon | FtsH |
|---|---|---|---|
| Processivity | High (>10 substrates per binding event) | Moderate | Moderate to High |
| Degradation Rate | ~600 aa/min | ~120 aa/min | ~60 aa/min |
| Primary Tag/Signal | C-terminal ssrA tag (AANDENYALAA) | Hydrophobic/N-terminal degrons | Cytoplasmic degrons (e.g., YccA-mediated) |
| Regulatory Signals | SspB adaptor enhances delivery. | ATP binding allosterically activates protease site. | Regulated by membrane lipids and metal ions. |
| Essential in E. coli? | No (but severe defects) | No (except in certain conditions) | Yes |
Table 3: Comparative quantitative and functional data for AAA+ proteases.
Experimental Protocols
4.1 Protocol: In Vitro Disaggregation/Refolding Assay (ClpB + DnaK/J/GrpE) Objective: Monitor reactivation of aggregated model substrate (e.g., firefly luciferase). Reagents: See "The Scientist's Toolkit" below. Procedure:
- Aggregate Formation: Denature 500 nM luciferase in 6 M guanidine-HCl for 30 min at 25°C. Dilute 50-fold into aggregation buffer (40 mM HEPES-KOH pH 7.5, 50 mM KCl, 10 mM MgCl₂) to induce aggregation. Incubate 10 min.
- Reaction Setup: Prepare a master mix containing an ATP-regenerating system (5 mM ATP, 20 mM creatine phosphate, 50 µg/mL creatine kinase), 5 µM DnaK, 1 µM DnaJ, 0.5 µM GrpE, and 2 µM ClpB hexamer in reaction buffer.
- Initiation & Measurement: Add pre-formed luciferase aggregates (final 20 nM) to the master mix in a luminometer plate. Immediately begin measuring luminescence (integration time: 2 sec) every 60 sec for 90 min at 30°C.
- Controls: Include reactions lacking ClpB, DnaK, or ATP. Normalize data to luminescence of native luciferase.
4.2 Protocol: Processive Degradation Assay for ClpXP Objective: Quantify degradation kinetics of a fluorescently labeled substrate. Reagents: ClpX6, ClpP14, FITC-labeled casein or ssrA-tagged GFP, ATP. Procedure:
- Complex Assembly: Pre-incubate 200 nM ClpX6 hexamer with 400 nM ClpP14 tetradecamer for 5 min at 30°C in degradation buffer (25 mM HEPES-KOH pH 7.5, 100 mM KCl, 20 mM MgCl₂, 5% glycerol).
- Reaction Initiation: Add 5 mM ATP and 1 µM FITC-labeled substrate to the assembled ClpXP. Mix rapidly.
- Real-Time Monitoring: Transfer to a quartz cuvette in a fluorometer. Monitor fluorescence (excitation 495 nm, emission 512 nm for GFP; or 494/518 nm for FITC-casein) every 10 sec for 30 min. Loss of signal indicates degradation.
- Data Analysis: Fit the fluorescence decay curve to a single exponential to determine the degradation rate constant (k_deg).
Visualization Diagrams
Diagram 1: The ClpB-DnaK/J bichaperone disaggregation pathway.
Diagram 2: Generalized mechanism of AAA+ protease action (top) and ClpXP-specific pathway (bottom).
The Scientist's Toolkit: Essential Research Reagents
| Reagent/Material | Function/Explanation | Example Vendor/Reference |
|---|---|---|
| Recombinant Proteins (ClpB, DnaK, DnaJ, GrpE, ClpX, ClpP, Lon, FtsH) | Purified, active enzyme components for in vitro reconstitution assays. Essential for mechanistic studies. | Often expressed and purified in-house from plasmid constructs; available from academic stock centers. |
| ATP-Regeneration System (ATP, Creatine Phosphate, Creatine Kinase) | Maintains constant, high [ATP] during long enzymatic assays, preventing depletion. | Sigma-Aldrich, Roche. |
| Fluorescent Substrates (FITC-Casein, ssrA-tagged GFP/SulA fusions) | Enable real-time, sensitive quantification of proteolytic activity via fluorescence loss. | Thermo Fisher (labeled proteins); custom fusions expressed in-house. |
| Model Aggregation-Prone Substrates (Firefly Luciferase, GFP-thermo variants) | Well-characterized proteins that lose activity upon heat/chemical aggregation. Quantify chaperone reactivation. | Promega (luciferase), homemade GFP mutants. |
| Protease Inhibitors (Specific) | Validate enzyme-specific activity (e.g., β-lactone inhibitors for ClpP, UPF-1 for Lon). | Calbiochem, MilliporeSigma, Tocris. |
| Surface Plasmon Resonance (SPR) Chip (e.g., CM5) | Immobilize one binding partner (e.g., ClpB) to measure real-time kinetics of co-chaperone (DnaK) binding. | Cytiva. |
| Single-Molecule FRET (smFRET) Setup | Microscope and fluorescent dye pairs (Cy3/Cy5) to measure conformational changes and translocation in real time. | Custom-built systems; dyes from Lumiprobe. |
| Native/PAGE Gels & Antibodies | Analyze protein complex assembly (e.g., ClpX-ClpP), substrate degradation intermediates, and protein levels in vivo. | Bio-Rad, Invitrogen; antibodies from lab stocks or Abcam. |
Table 4: Key research reagents and tools for studying AAA+ PQC systems.
Within the bacterial protein quality control (PQC) network, ATP-dependent chaperone-protease complexes are essential machines that maintain proteostasis by recognizing, unfolding, and degrading damaged or misfolded proteins. This whitepaper details the fundamental energy-driven cycle, wherein the chemical energy from ATP hydrolysis is transduced into mechanical work to power substrate unfolding, translocation into a sequestered degradation chamber, and ultimate proteolysis. This process is central to cellular viability and represents a target for novel antimicrobial strategies.
Core Machinery: Architecture and Components
Key bacterial ATP-dependent proteases include ClpXP, ClpAP, ClpCP, Lon, and FtsH. These share a common functional logic: a hexameric AAA+ (ATPases Associated with diverse cellular Activities) unfoldase/translocase ring and a compartmentalized peptidase. For instance, in ClpXP, the ClpX hexamer forms the ATPase module, while ClpP forms the tetradecameric proteolytic chamber.
Table 1: Major Bacterial ATP-Dependent Protease Complexes
| Complex | AAA+ Unfoldase (Subunits) | Protease Chamber (Subunits) | Primary Substrate Recognition Signal | Key References (Recent) |
|---|---|---|---|---|
| ClpXP | ClpX (6) | ClpP (2x7) | SsrA tag, specific degrons | Sauer & Baker, Nat Rev Mol Cell Biol, 2022 |
| ClpAP | ClpA (6) | ClpP (2x7) | SsrA tag, N-degrons | Lopez & Baker, Annu Rev Biochem, 2023 |
| ClpCP | ClpC (6) + MecA adaptor | ClpP (2x7) | MecA-delivered substrates | Kirstein et al., EMBO J, 2021 |
| Lon (LonA) | Integral AAA+ ring (6) | Integral proteolytic domain | Sulphiredoxin motif, hydrophobic patches | Gur et al., Mol Cell, 2023 |
| FtsH | Integral AAA+ ring (6) | Integral zinc-metalloprotease domain | Membrane protein degrons, RpoH | Langklotz et al., Microbiol Mol Biol Rev, 2023 |
The Energy-Driven Cycle: A Stepwise Mechanism
Substrate Recognition and Engagement
Substrates are recognized via specific degrons (e.g., the 11-residue SsrA tag) or adaptor proteins (e.g., MecA for ClpC). The AAA+ ring's pore loops engage the substrate polypeptide, often near a terminus or an unstructured region.
ATP Hydrolysis-Driven Unfolding and Translocation
The hexameric AAA+ ring operates with probabilistic ATP hydrolysis, leading to conformational changes in its pore loops. This creates a power stroke that pulls on the substrate, mechanically denaturing folded domains. The unfolded polypeptide is then translocated in a stepwise, hand-over-hand manner through the central pore into the ClpP chamber.
Table 2: Quantitative Parameters of the Energy-Driven Cycle
| Parameter | Typical Measured Value | Experimental Method | Significance |
|---|---|---|---|
| ATP Hydrolysis Rate (ClpX) | ~400 min⁻¹ per hexamer (substrate-bound) | Coupled NADH/ATPase assay | Determines maximal unfolding/translocation rate |
| Translocation Speed | 50-100 aa/sec (ClpXP) | Fluorescent anisotropy/FRET degradation assays | Defines processing efficiency |
| Mechanical Force Generated | 20-30 pN (estimated) | Optical tweezers single-molecule studies | Sufficient to unfold most protein domains |
| Processivity | >90% completion for tagged substrates | Single-turnover degradation assays | Ensives complete degradation, prevents junk polypeptides |
| ATP Molecules Consumed per Residue | ~1-2 ATP/aa translocated | Stoichiometric hydrolysis measurements | Energy cost of mechanical work and proofreading |
Degradation
Within the sequestered ClpP chamber, which lacks ATPase activity, the unfolded polypeptide is hydrolyzed into short peptides (typically 7-9 residues) by serine protease active sites, which then diffuse out.
Diagram Title: ATP-Driven Substrate Processing by a Chaperone-Protease
Detailed Experimental Protocols
Protocol: Coupled ATPase Assay to Measure Hydrolysis Kinetics
Purpose: Quantify ATP hydrolysis rates of the AAA+ protease in the presence/absence of substrate. Reagents: Purified AAA+ protease (e.g., ClpX), substrate protein (e.g., GFP-SsrA), ATP, phosphoenolpyruvate (PEP), pyruvate kinase/lactate dehydrogenase (PK/LDH) enzyme mix, NADH. Procedure:
- Prepare reaction buffer (25 mM HEPES-KOH pH 7.5, 100 mM KCl, 20 mM MgCl₂, 0.1% Triton X-100).
- In a cuvette, mix 2 mM ATP, 0.2 mM NADH, 2 mM PEP, 10 U/mL PK/LDH mix, and buffer.
- Initiate reaction by adding AAA+ protease (e.g., 100 nM hexamer) ± substrate (e.g., 5 µM).
- Monitor absorbance at 340 nm (A₃₄₀) continuously for 10-20 min. The oxidation of NADH to NAD⁺ causes a decrease in A₃₄₀.
- Calculate ATP hydrolysis rate: Rate = (ΔA₃₄₀/min) / (ε * path length), where ε for NADH is 6220 M⁻¹cm⁻¹.
Protocol: Single-Turnover Degradation Assay Using Fluorescent Substrates
Purpose: Measure real-time degradation kinetics and processivity. Reagents: Purified ClpXP complex, fluorophore-labeled substrate (e.g., FITC-Casein or SsrA-tagged protein). Procedure:
- Use a stopped-flow or rapid-mixing fluorimeter. Load one syringe with ClpXP (e.g., 1 µM ClpX₆, 2 µM ClpP₁₄) and ATP (5 mM) in degradation buffer.
- Load second syringe with fluorescent substrate (e.g., 100 nM).
- Rapidly mix equal volumes and initiate measurement.
- For FITC-casein (ex 492 nm, em 518 nm), monitor fluorescence increase as peptides are released. Fit the trace to a single exponential to obtain the degradation rate constant (kₒbₛ).
Protocol: Single-Molecule Optical Tweezers for Unfolding/Translocation
Purpose: Directly measure mechanical forces and stepwise translocation. Reagents: DNA handles, purified AAA+ protease, substrate protein engineered with N- and C-terminal cysteine tags. Procedure:
- Tether the substrate protein between two polystyrene beads via digoxigenin/anti-dig and biotin/streptavidin linkages using DNA handles.
- Place one bead on a micropipette, the other in an optical trap.
- Flow in AAA+ protease (e.g., ClpX) and ATP into the chamber.
- Record bead displacement with nm precision. A constant force or force-clamp mode is used. Steps in extension correspond to individual translocation events; sudden increases in length indicate mechanical unfolding of a domain.
The Scientist's Toolkit: Key Research Reagent Solutions
Table 3: Essential Reagents for Studying ATP-Dependent Proteases
| Reagent | Function/Description | Example Vendor/Cat # (Representative) |
|---|---|---|
| Non-hydrolyzable ATP analogs (ATPγS, AMP-PNP) | Trap specific conformational states for structural studies (e.g., cryo-EM). | Sigma-Aldrich, A1388 (ATPγS) |
| Fluorogenic Peptide Substrates (e.g., Suc-LY-AMC) | Measure protease chamber activity independently of AAA+ component. | Bachem, I-1395 |
| SsrA-tagged Model Substrates (GFP-SsrA, μNS-SsrA) | Standardized, highly soluble substrates for degradation assays. | In-house expression from plasmids (e.g., pKAW206) |
| Anti-SsrA Tag Antibody | Detect degradation intermediates by Western blot. | Available from various academic sources. |
| ClpP-specific inhibitors (ADEPs, β-lactones) | Dissect function by activating (ADEP) or inhibiting ClpP independently of AAA+ partner. | Merck, 338750 (ADEP1) |
| Tetracycline-Degron (TD) tagged proteins | Enable inducible, rapid degradation of specific proteins in vivo to assess physiological function. | Generated via CRISPR or homologous recombination. |
| Cysteine-reactive maleimide dyes (e.g., Cy3/Cy5-maleimide) | Site-specific labeling of engineered cysteine residues in substrate proteins for single-molecule FRET or fluorescence degradation assays. | Cytiva, PA23001 & PA25001 |
Diagram Title: Integrated Workflow for Chaperone-Protease Research
Implications for Drug Development
Inhibiting bacterial AAA+ proteases disrupts PQC, leading to toxic aggregate accumulation. ClpP is a validated target. Activators (like ADEPs) cause dysregulated proteolysis, while inhibitors (like β-lactones) block degradation. Current research focuses on species-specific targeting (e.g., Mycobacterium tuberculosis ClpC1P1P2) to develop novel antibiotics against drug-resistant pathogens. Understanding the precise energy transduction mechanism enables rational design of allosteric inhibitors that block the ATPase cycle or the substrate translocation pore.
Within the critical cellular framework of protein quality control (PQC), ATP-dependent chaperone proteases are the principal executioners that identify, unfold, and degrade misfolded or regulatory substrates. In bacterial PQC research, understanding the precision of this process—how these machines avoid catastrophic off-target degradation while efficiently eliminating correct substrates—is a central question. This precision is governed by the triad of substrate recognition, degron signals, and adaptor proteins. This whitepaper deconstructs the mechanisms of specificity, focusing on bacterial systems like ClpAP/ClpXP and their adaptors, framing this knowledge as essential for manipulating PQC in antimicrobial and therapeutic strategies.
Core Concepts: Degrons and Adaptors
Degrons: These are short, specific linear motifs or structural features in a substrate protein that are recognized by the degradation machinery. In bacterial ATP-dependent proteases, degrons are often exposed N-terminal, C-terminal, or internal amino acid sequences.
- Example: The E. coli SsrA tag (AANDENYALAA) is a well-characterized C-terminal degron added via trans-translation, targeting proteins to ClpXP and ClpAP.
Adaptor Proteins: These are specificity factors that modify the activity or substrate repertoire of a core protease. They do not possess catalytic activity but are indispensable for cellular regulation. They function by:
- Unmasking Degrons: Remodeling substrate structure to reveal a hidden degron.
- Bridging Substrate and Protease: Directly tethering the substrate to the protease.
- Altering Protease Specificity: Modifying the recognition pocket of the protease complex.
Quantitative Data: Key Bacterial Adaptor-Protease Systems
Table 1: Major ATP-Dependent Bacterial Proteases and Their Adaptors
| Core Protease | Primary ATPase | Proteolytic Chamber | Key Adaptor Protein(s) | Function of Adaptor | Representative Substrate(s) |
|---|---|---|---|---|---|
| ClpAP | ClpA | ClpP | ClpS | Recognizes N-degrons (e.g., Phe, Leu, Trp); inhibits ClpA's standalone chaperone activity. | Proteins with hydrophobic N-termini (e.g., FtsA, aggregated proteins) |
| ClpXP | ClpX | ClpP | SspB | Enhances delivery of SsrA-tagged substrates by increasing binding affinity to ClpX. | SsrA-tagged proteins, GFP-SsrA (model substrate) |
| ClpXP | ClpX | ClpP | RssB | A response regulator; delivers phosphorylated RpoS (σ^S^) to ClpXP under stress. | RpoS (stationary phase sigma factor) |
| Lon | Lon (integrated) | Lon (integrated) | None known | Lon directly recognizes specific degrons (e.g., in SulA, RcsA). | SulA (cell division inhibitor), RcsA (capsule synthesis activator) |
| FtsH | FtsH (integrated) | FtsH (integrated) | HflKC complex | Modulates FtsH specificity, stabilizing it; involved in regulating phage λ choice. | SecY (membrane protein), phage λ CII protein |
Table 2: Measurable Effects of Adaptor Proteins on Proteolytic Efficiency
| Experimental System | Parameter Measured | Without Adaptor | With Adaptor | Fold Change | Reference Context |
|---|---|---|---|---|---|
| ClpXP + GFP-SsrA | Degradation Rate (kdeg, min⁻¹) | ~0.5 min⁻¹ | ~3.0 min⁻¹ | ~6x increase | SspB enhances substrate affinity (PMID: 11724936) |
| ClpAP + N-end Rule Substrate | KM (µM) for Substrate | >50 µM | ~5 µM | ~10x decrease | ClpS binds N-degron and ClpA, lowering KM (PMID: 19202087) |
| RssB-Mediated RpoS Degradation | Half-life of RpoS (min) | ~40 min (steady state) | ~1-2 min (stress) | ~20-40x decrease | Phospho-RssB delivers RpoS to ClpXP (PMID: 15353567) |
Detailed Experimental Protocols
Protocol 1: In Vitro Degradation Assay to Quantify Adaptor Function Objective: Measure the rate of fluorescent substrate degradation by ClpXP in the presence and absence of adaptor protein SspB. Materials:
- Purified proteins: ClpX6, ClpP14, SspB, GFP-SsrA (substrate).
- Reaction Buffer: 25 mM HEPES-KOH (pH 7.5), 100 mM KCl, 10 mM MgCl₂, 10% glycerol, 1 mM DTT.
- ATP Regeneration System: 5 mM ATP, 20 mM Creatine Phosphate, 0.1 mg/mL Creatine Kinase.
- Plate reader capable of fluorescence measurement (ex: 485 nm, em: 510 nm).
Procedure:
- Setup: In a 96-well plate, mix in Reaction Buffer:
- Control: 0.5 µM ClpX6, 1 µM ClpP14, ATP system.
- +Adaptor: Same as control + 2 µM SspB.
- No Protease: Buffer + ATP system + SspB (background control).
- Initiation: Pre-incubate all components except substrate at 30°C for 2 min. Start the reaction by adding GFP-SsrA to a final concentration of 1 µM.
- Measurement: Immediately place plate in pre-warmed plate reader. Record fluorescence every 30 seconds for 60 minutes.
- Analysis: Subtract background (No Protease). Normalize initial fluorescence to 100%. Plot remaining fluorescence (%) vs. time. Fit the linear portion of the curve (typically first 5-10 min) to obtain the degradation rate.
Protocol 2: Bacterial Two-Hybrid Assay for Adaptor-Substrate Interaction Objective: Validate physical interaction between a putative adaptor (e.g., ClpS) and a substrate protein containing a suspected degron. Materials:
- Bacterial Two-Hybrid Kit (e.g., BACTH system from Euromedex): Vectors pUT18, pKT25.
- E. coli reporter strain (e.g., BTH101, adenylate cyclase-deficient).
- Selective media: LB agar with ampicillin, kanamycin, 100 µg/mL X-Gal, 0.5 mM IPTG.
Procedure:
- Cloning: Fuse the gene for the putative adaptor (ClpS) to the T18 fragment in pUT18. Fuse the gene for the substrate degron domain to the T25 fragment in pKT25.
- Co-transformation: Transform both plasmids into the BTH101 reporter strain.
- Screening: Plate transformants on selective media. Incubate at 30°C for 48-72 hours.
- Interpretation: A positive protein-protein interaction reconstitutes adenylate cyclase activity, leading to cAMP production, lacZ expression, and blue colony formation. Negative controls (empty vectors) should remain white.
Visualizing the Recognition and Signaling Pathways
Diagram 1: RssB adaptor integrates stress signal for RpoS degradation.
Diagram 2: Key steps for quantifying adaptor effects in vitro.
The Scientist's Toolkit: Essential Research Reagents
Table 3: Key Reagent Solutions for Degron/Adaptor Research
| Reagent / Material | Function in Research | Example Product / Specification |
|---|---|---|
| Purified Core Protease Complexes | Essential for in vitro biochemical assays (degradation, binding, ATPase). | ClpXP (ClpX6 + ClpP14), ClpAP, Lon protease. Must be ATPase active. |
| Fluorescently-Tagged Model Substrates | Enable real-time, quantitative tracking of degradation kinetics. | GFP-SsrA (for ClpXP), FITC-Casein (for Lon). High purity, defined tag. |
| ATP Regeneration System | Maintains constant [ATP] during long enzymatic assays, ensuring linear kinetics. | Creatine Phosphate / Creatine Kinase system or Pyruvate Kinase / Phosphoenolpyruvate system. |
| N-End Rule Peptide Libraries | To probe specificity of adaptors like ClpS. Identifies preferred degron sequences. | Array of biotinylated peptides with varying N-terminal residues. |
| BACTH (Bacterial Two-Hybrid) System | For in vivo validation of adaptor-substrate or adaptor-protease interactions. | Commercial kit (e.g., Euromedex) with pUT18/pKT25 vectors and reporter strain. |
| Crosslinking Agents | To trap transient complexes for structural analysis (e.g., Mass Spec, Cryo-EM). | DSS (Disuccinimidyl suberate), BS³ (water-soluble), or zero-length crosslinkers like EDC. |
| Protease Inhibitor Cocktails | Negative controls and for sample preparation to prevent unintended proteolysis. | Broad-spectrum cocktails lacking EDTA (to preserve Mg²⁺-dependent ATPases). |
1. Introduction: PQC as a Central Node in Bacterial Physiology
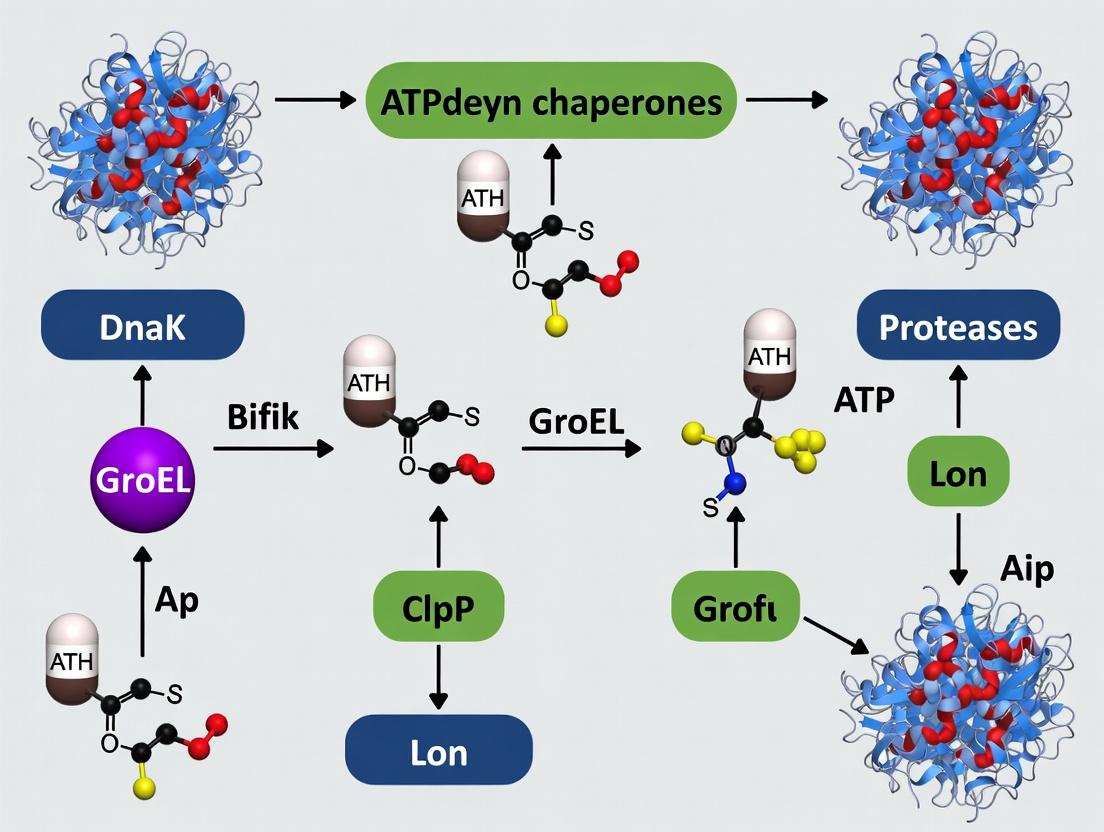
Within the bacterial cytosol, protein quality control (PQC) is an ATP-dependent, dynamic network essential for survival, stress adaptation, and pathogenesis. This network is governed by two primary classes of machines: molecular chaperones (e.g., DnaK, GroEL, ClpB) and ATP-dependent proteases (e.g., ClpXP, ClpCP, Lon, FtsH). Their integrated function—managing stress and regulating virulence—is the focus of this technical guide. Framed within the broader thesis of bacterial PQC research, this document details how chaperones prevent aggregation and promote refolding, while proteases selectively degrade irreversibly damaged or regulatory proteins. This cooperative system is not merely housekeeping; it is a sophisticated, responsive circuit that directly controls virulence factor production, toxin-antitoxin systems, and adaptive responses to host-induced stresses.
2. Core Components & Quantitative Overview
Table 1: Key ATP-Dependent Chaperones in Bacterial PQC & Virulence
| Component | Primary Function | ATPase Role | Key Virulence-Related Substrates/Client Proteins | Representative Organism(s) |
|---|---|---|---|---|
| DnaK (Hsp70) | Holdase/Refoldase; prevents aggregation, promotes folding. | Drives substrate binding/release cycle. | Thermoregulation of virulence genes (Listeria, Yersinia); Stabilizes secretion system components. | E. coli, B. subtilis, P. aeruginosa |
| GroEL/ES (Hsp60) | Barrel-shaped refoldase; encapsulates misfolded proteins. | GroEL ATP hydrolysis drives folding cycle. | Essential for folding of metabolic and virulence enzymes; critical under stress. | Most eubacteria |
| ClpB (Hsp100) | Disaggregase; rescues proteins from aggregates. | Hexameric ATPase threads substrates for disaggregation. | Critical for thermotolerance and survival in macrophages (Salmonella, Listeria). | E. coli, B. subtilis, S. aureus |
| Trigger Factor | Ribosome-associated chaperone; co-translational folding. | ATP-independent. | Folding of nascent virulence factors. | E. coli |
Table 2: Key ATP-Dependent Proteases in Bacterial PQC & Virulence
| Component | Structure | Regulatory Recognition | Key Virulence-Related Substrates | Pathogenic Role |
|---|---|---|---|---|
| ClpXP | ClpX (AAA+ unfoldase) + ClpP (proteolytic chamber). | Adaptors (e.g., ClpS, RssB) target substrates. | Toxin-antitoxin systems (e.g., MazE); Transcriptional regulators (e.g., RpoS, HilA in Salmonella). | Controls stress response, invasion gene expression. |
| ClpCP | ClpC (AAA+ unfoldase) + ClpP. | Adaptors (MecA, ClpS) essential for substrate delivery. | Competence regulators (B. subtilis); Virulence regulators (S. aureus: Spx, CtsR). | Regulates biofilm, antibiotic resistance, toxin production. |
| Lon | Homo-oligomeric AAA+ protease. | Recognects specific degrons (e.g., hydrophobic tags, unfolded regions). | Capsule synthesis regulators (E. coli); Toxin-antitoxin modules; Mating apparatus in Agrobacterium. | Controls surface properties, conjugation, persistence. |
| FtsH | Membrane-integrated AAA+ protease. | Degrades misassembled membrane complexes. | SecY (translocon); phage λ CII regulator; LpxC (lipid A biosynthesis). | Maintains membrane integrity, regulates cell envelope. |
3. Network Integration: Signaling Pathways and Cooperative Workflows
The chaperone-protease network functions through sequential triage and integrated regulatory circuits.
Diagram 1: Core PQC Triage Pathway for Stress Management
Diagram 2: Virulence Regulation Network (e.g., in Salmonella/Listeria)
4. Experimental Protocols for Key Investigations
Protocol 1: Assessing Protein Stability & Degradation In Vivo (Based on pulse-chase assays coupled with immunoprecipitation)
- Objective: Measure half-life of a virulence regulator (e.g., HilA) under stress conditions.
- Procedure:
- Culture & Stress: Grow bacterial culture (e.g., Salmonella enterica) to mid-log phase. Divide: one aliquot serves as unstressed control, the other is subjected to stress (e.g., 42°C heat shock).
- Pulse-Labeling: Add a radioactive amino acid (e.g.,
[35S]-Methionine) to the culture for 2 minutes to label newly synthesized proteins. - Chase: Add excess unlabeled methionine to stop incorporation of the radioactive label. This marks time "zero."
- Sampling: Withdraw aliquots at time points (e.g., 0, 2, 5, 10, 20, 40 min). Immediately lyse cells (e.g., using ice-cold TCA or denaturing lysis buffer).
- Immunoprecipitation: Incubate lysates with antibody specific to the protein of interest. Precipitate immune complexes using Protein A/G beads.
- Analysis: Wash beads, elute proteins, separate by SDS-PAGE. Visualize and quantify radioactive signal using a phosphorimager. Plot residual signal vs. time to calculate half-life.
Protocol 2: Determining Chaperone/Protease Genetic Interaction via Synthetic Sick/Lethal Analysis
- Objective: Identify functional cooperation between a chaperone (e.g.,
clpB) and a protease (e.g.,lon) under virulence conditions. - Procedure:
- Strain Construction: Generate single-gene deletion mutants (∆
clpB, ∆lon) and a double-deletion mutant (∆clpB∆lon) in the wild-type background using P1 transduction or allelic exchange. - Growth Phenotyping: Perform spot dilution assays on solid media. Serially dilute overnight cultures of each strain (WT, ∆
clpB, ∆lon, ∆clpB∆lon) and spot onto control plates and plates containing virulence-relevant stress (e.g., low pH, antimicrobial peptides, elevated temperature). - Intracellular Survival Assay: Infect macrophage-like cell lines (e.g., J774A.1) with each strain at a defined MOI. After 1-2 hours, gentamicin treatment kills extracellular bacteria. Lyse macrophages at 2h and 18h post-infection, plate lysates to enumerate CFUs.
- Data Interpretation: A "synthetic sick/lethal" phenotype is defined when the double mutant shows a significantly more severe growth or survival defect than either single mutant, indicating a synergistic, essential role under the tested condition.
- Strain Construction: Generate single-gene deletion mutants (∆
5. The Scientist's Toolkit: Research Reagent Solutions
Table 3: Essential Reagents for PQC Network Research
| Reagent/Material | Function/Application | Example/Note |
|---|---|---|
| ATPγS (Adenosine 5′-O-[γ-thio]triphosphate) | Non-hydrolyzable ATP analog used to trap and stabilize chaperone-substrate or protease-substrate complexes for structural studies (e.g., Cryo-EM). | Inhibits ATPase activity, allowing snapshot of engaged state. |
| MG132 / Lactacystin | Proteasome inhibitor (primarily eukaryotic); used cautiously in bacteria as some show cross-reactivity with ClpP activity in permeabilized cells or specific contexts. | Positive control for probing protease-dependent degradation. |
Tetracycline- or AHT-Inducible degron Tags |
A system for controlled, rapid degradation of a protein of interest in vivo by fusing it to a degron (e.g., SsrA variant) recognized by native proteases (ClpXP). | Enables study of protein function by acute depletion. |
| BACTH (Bacterial Adenylate Cyclase Two-Hybrid) Kit | In vivo assay to detect and characterize protein-protein interactions, including between chaperones, adaptors, and substrate proteins. | Based on reconstitution of cAMP signaling; useful for mapping interaction domains. |
Anti-DnaK / Anti-ClpP Monoclonal Antibodies |
Essential for Western blot, immunoprecipitation, and cellular localization studies to monitor protein levels and complex formation under stress. | Ensure species-specific reactivity (e.g., E. coli vs. S. aureus). |
ΔclpP / Δlon / ΔdnaK Conditional Mutants |
Strains where essential protease/chaperone genes are under tight, inducible control (e.g., arabinose-promoter). | Allows study of acute loss-of-function without accumulation of compensatory mutations. |
Fluorescent Protein Fusions (e.g., ssrA-Dendra2) |
A photo-convertible reporter protein fused to a degron sequence. Allows visualization of spatially resolved protein degradation kinetics in single cells. | Monitor in vivo degradation rates via fluorescence loss after photo-conversion (FLAP). |
From Bench to Bedside: Techniques and Therapeutic Applications in PQC Research
Within the study of bacterial Protein Quality Control (PQC), ATP-dependent chaperone proteases like ClpXP, ClpAP, HsIUV, FtsH, and the Lon protease are central. These molecular machines couple ATP hydrolysis to protein unfolding and degradation, crucial for cellular homeostasis, stress response, and regulatory circuits. In vitro functional characterization of these complexes is foundational for mechanistic understanding, inhibitor discovery, and drug development. This guide details state-of-the-art assays for measuring their three core biochemical activities: ATP hydrolysis, polypeptide unfolding, and peptide bond cleavage.
ATPase Activity Assays
ATP hydrolysis provides the energetic driving force for chaperone-protease function. Quantifying ATPase activity is essential for assessing enzyme viability, kinetics, and modulation.
Key Methodology: Continuous Coupled Enzymatic Assay (Malachite Green Phosphate Assay) This assay measures the release of inorganic phosphate (Pi) over time.
Detailed Protocol:
- Reaction Setup: Prepare a 50-100 µL reaction containing:
- Assay Buffer (e.g., 50 mM HEPES-KOH pH 7.5, 150 mM KCl, 10 mM MgCl₂, 5% glycerol).
- ATP (1-5 mM, with trace [γ-³²P]ATP if using a radioactive method).
- An ATP-regenerating system (e.g., 5 mM phosphocreatine, 20 U/mL creatine phosphokinase) to prevent ADP accumulation, which is critical for sustained activity.
- Substrate protein (e.g., casein, SsrA-tagged protein) or chemical effector (e.g., poly-lysine) to stimulate ATPase activity.
- Initiate reaction by adding chaperone-protease (e.g., 50-200 nM ClpP hexamer with 50-100 nM ClpX hexamer).
- Incubation: Conduct at 30-37°C in a thermostatted microplate reader.
- Detection: At set intervals (e.g., every 30 sec for 30 min), transfer an aliquot (e.g., 10 µL) to a well containing 100 µL of malachite green reagent (0.045% malachite green, 4.2% ammonium molybdate in 4M HCl, with 0.1% Tween-20).
- Measurement: After 1-5 minutes at room temperature, measure absorbance at 620 nm. Compare to a standard curve of known Pi concentrations (0-200 µM) prepared in the same reaction buffer.
- Analysis: Calculate reaction velocity. Kinetic parameters (kcat, KM) can be derived by fitting velocity vs. [ATP] data to the Michaelis-Menten equation.
Alternative Methods:
- NADH-Coupled Assay: Measures ATPase activity by coupling ADP production to the oxidation of NADH (absorbance at 340 nm).
- Radioactive [γ-³²P]ATP Assay: The gold standard for sensitivity; involves TLC separation of ATP from Pi and quantification by phosphorimaging.
Quantitative Data Summary: Table 1: Representative ATPase Activities of Bacterial Chaperone-Proteases
| Enzyme Complex | Basal kcat (ATP/min/active site) | Stimulated kcat (with substrate) | KM for ATP (µM) | Key Allosteric Effectors |
|---|---|---|---|---|
| E. coli ClpXP | 2-5 | 10-20 | 30-100 | SsrA-tagged proteins, casein |
| E. coli ClpAP | 1-3 | 8-15 | 50-150 | ClpS adaptor, N-degron peptides |
| B. subtilis Lon | 5-10 | 15-30 | 20-50 | Unfolded proteins, poly-lysine |
| E. coli FtsH | 0.5-2 | 3-8 | 100-300 | Integral membrane proteins |
dot code block:
Diagram 1: ATPase assay workflow.
Unfoldase/Translocase Activity Assays
These assays measure the mechanical ability of the chaperone ring (e.g., ClpX, ClpA) to unfold and translocate a polypeptide substrate.
Key Methodology: Degradation of Fluorescently Tagged, Folded Substrates The most definitive unfoldase assay couples unfolding to proteolysis. A folded protein domain (e.g., GFP, DHFR) with a C-terminal degradation tag (e.g., SsrA) is used. Unfolding is rate-limiting; its completion allows translocation into the proteolytic chamber for degradation, measured by loss of fluorescence.
Detailed Protocol:
- Substrate: Purify a fusion protein like GFP-SsrA. The folded GFP domain is stable and fluorescent; the SsrA tag targets it to ClpXP/A.
- Reaction Setup: In a black 96- or 384-well plate, mix:
- Assay Buffer (as above, but often with an oxygen-scavenging system for single-molecule assays).
- 1-5 µM GFP-SsrA substrate.
- Protease component (e.g., 0.5-1 µM ClpP14).
- ATP (2-5 mM) with regenerating system.
- Initiation: Start the reaction by adding the ATPase/unfoldase (e.g., 0.1-0.5 µM ClpX6).
- Measurement: Monitor fluorescence (GFP excitation ~488 nm, emission ~510 nm) continuously in a plate reader at 30°C. Control reactions lack ATP, ClpX, or ClpP.
- Analysis: Fit the fluorescence decay curve to a single or double exponential. The observed rate constant (kobs) reflects the combined unfoldase/protease activity. Using a catalytically dead ClpP (e.g., ClpP-Trap) allows measurement of unfolding/translocation without degradation, often via gel shift or anisotropy.
Alternative Methods:
- Single-Molecule FRET (smFRET): Uses donor/acceptor dyes on a substrate to directly visualize unfolding steps in real time.
- Forster Resonance Energy Transfer (FRET)-based Peptide Translocation: Uses a dual-fluorophore-labeled peptide to measure translocation kinetics.
Quantitative Data Summary: Table 2: Representative Unfoldase Activities
| Enzyme Complex | Model Substrate | Unfolding Rate (kobs, min⁻¹) | Processivity | Key Assay Method |
|---|---|---|---|---|
| E. coli ClpXP | GFP-SsrA | 0.5-2.0 | High | Bulk fluorescence loss, smFRET |
| E. coli ClpAP | GFP-SsrA | 0.1-0.5 | Very High | Bulk fluorescence loss, gel shift |
| M. tuberculosis ClpC1P2 | FITC-casein | 1.5-4.0 (ATP hydrolysis coupled) | Moderate | Fluorescence anisotropy increase |
Proteolytic Activity Assays
These measure the cleavage of peptide bonds, typically within the sequestered chamber of the protease (e.g., ClpP, Lon, FtsH).
Key Methodology: Fluorogenic Peptide or Protein Degradation Short peptides with a fluorophore-quencher pair or the release of a fluorescent amino acid (like AMC from a peptide-AMC conjugate) provide a direct, real-time readout of peptidase activity.
Detailed Protocol (Peptide-AMC Degradation):
- Substrate: Use a peptide like Suc-LY-AMC or Z-GGL-AMC. The protease cleaves the amide bond, releasing fluorescent 7-amino-4-methylcoumarin (AMC).
- Reaction Setup: In a black microplate, mix:
- Assay Buffer.
- Fluorogenic peptide (50-200 µM). A KM should be determined for each enzyme-substrate pair.
- ATP (2-5 mM) with regenerating system (essential for ATP-dependent proteases).
- The full chaperone-protease complex or the protease ring alone (for basal activity). For ClpP, include ClpX/A (100-500 nM each oligomer).
- Measurement: Continuously monitor AMC fluorescence (excitation ~360 nm, emission ~460 nm) at 30-37°C for 30-60 minutes.
- Analysis: Calculate the initial velocity (RFU/min). Convert to moles of product/min using an AMC standard curve. Specific activity is expressed as nmol AMC released/min/mg enzyme.
Alternative Methods:
- Degradation of Radiolabeled Proteins ([³⁵S]-methionine labeled): The gold standard for protein substrate degradation. Reactions are quenched with TCA, soluble counts (degraded peptides) are measured by scintillation counting.
- FRET-Based Protein Substrates: A protein with terminal FRET pair; degradation separates dyes, reducing FRET signal.
Quantitative Data Summary: Table 3: Representative Proteolytic Activities
| Protease Core | Chaperone Partner | Peptide Substrate (Example) | kcat (min⁻¹) | KM (µM) | Protein Substrate Degradation Rate |
|---|---|---|---|---|---|
| E. coli ClpP | ClpX | Z-GGL-AMC | 10-30 | 50-150 | GFP-SsrA: 0.5-2 min⁻¹ |
| E. coli ClpP | ClpA | Suc-LY-AMC | 5-20 | 100-300 | GFP-SsrA: 0.2-1 min⁻¹ |
| B. subtilis Lon | None (intrinsic ATPase) | FITC-casein (global measure) | N/A | N/A | α-Casein: 5-10 µg/min/µg Lon |
| H. pylori ClpP | ClpX (activator) | Ac-RLR-AMC | 0.1-1.0* | 10-50* | *Strongly activator-dependent |
dot code block:
Diagram 2: Functional cascade of chaperone-protease.
The Scientist's Toolkit: Research Reagent Solutions
Table 4: Essential Reagents for In Vitro Chaperone-Protease Assays
| Reagent / Material | Function / Purpose | Example Product / Note |
|---|---|---|
| Recombinant Proteins | Purified chaperone (ClpX, ClpA), protease (ClpP, Lon), and model substrates (GFP-SsrA, casein). | Essential for all assays. Often co-expressed and purified via affinity tags (His₆, GST). |
| ATP & ATP-Regenerating System | Provides energy substrate and maintains high [ATP] by converting ADP back to ATP. | Phosphocreatine + Creatine Phosphokinase is standard. Critical for sustained, linear activity. |
| Malachite Green Reagent | Colorimetric detection of inorganic phosphate (Pi) released from ATP hydrolysis. | Commercial kits available (e.g., Sigma-Aldrich MAK307). Sensitive to ~1 µM Pi. |
| Fluorogenic Peptide Substrates | Direct, continuous measurement of peptidase activity via fluorophore release (e.g., AMC). | E.g., Suc-LY-AMC (for trypsin-like activity), Z-GGL-AMC (for chymotrypsin-like activity). |
| ³²P or ³⁵S Radiolabeled Compounds | Highest sensitivity detection for ATPase ([γ-³²P]ATP) and protein degradation ([³⁵S]-Met proteins). | Requires radiation safety protocols and equipment (scintillation counters, phosphorimagers). |
| Catalytically Dead Mutant Protease (Trap) | Binds and unfolds substrate but does not degrade it, allowing isolation of the unfolding step. | E.g., ClpP(S98A) or ClpP(Trap). Used in FRET, anisotropy, and gel-shift unfoldase assays. |
| Fluorescence Plate Reader | Enables high-throughput, real-time kinetic measurements of fluorescence (FRET, AMC, GFP). | Requires temperature control and appropriate filter sets. |
| Fast Protein Liquid Chromatography (FPLC) | For precise purification and analysis of oligomeric states (size-exclusion chromatography). | Essential for obtaining homogeneous, active complexes (e.g., ClpP tetradecamer, ClpX hexamer). |
Within the paradigm of bacterial Protein Quality Control (PQC), ATP-dependent chaperone-protease complexes are central executors of proteostasis. Systems like ClpXP, ClpAP, Lon, FtsH, and HslUV perform regulated proteolysis of damaged, misfolded, or short-lived regulatory proteins, impacting virulence, stress adaptation, and cellular fitness. This technical guide details three cornerstone methodologies—genetic knockout studies, substrate trapping (exemplified by ClpP trapping), and degradomics—that enable the dissection of these critical proteolytic networks. These approaches collectively map protease substrates, define physiological consequences of protease loss, and elucidate mechanistic principles of substrate recognition and degradation.
Genetic Knockout Studies
Knockout studies involve the targeted deletion or inactivation of a gene encoding a protease or chaperone subunit. This foundational genetic approach establishes the non-redundant physiological role of the target protease within bacterial PQC.
Core Protocol: Generating a Conditional Knockout
A common strategy employs a counterselectable marker (e.g., sacB) for allelic exchange to create a clean, in-frame deletion.
Protocol:
- Flanking Sequence Amplification: Using PCR, amplify ~500-1000 bp regions upstream (UP) and downstream (DOWN) of the target gene (e.g., clpP).
- Vector Construction: Ligate the UP and DOWN fragments into a suicide vector (e.g., pKOBEG-sacB) that cannot replicate in the target bacterium without a helper plasmid.
- Conjugation/Transformation: Introduce the suicide vector into the target bacterial strain (e.g., E. coli, S. aureus, M. tuberculosis) via conjugation or electroporation.
- First Homologous Recombination: Select for integration of the entire plasmid into the chromosome via a single crossover event using an antibiotic marker on the vector (e.g., Apramycin). This creates a merodiploid.
- Second Homologous Recombination (Counter-selection): Plate colonies on media containing sucrose (10%). The sacB gene product converts sucrose to levans, which are toxic to many bacteria, selecting for cells that have excised the plasmid sequence via a second crossover.
- Screening: Screen sucrose-resistant, antibiotic-sensitive colonies by colony PCR to identify those harboring the desired deletion (UP-DOWN junction present, target gene absent).
Table 1: Representative Phenotypes of Bacterial Protease Knockouts
| Protease System | Organism | Knockout Phenotype | Key Implicated Substrates/Processes |
|---|---|---|---|
| ClpP | Staphylococcus aureus | Reduced virulence, impaired biofilm formation, altered persister cell formation. | Accumulation of unfolded proteins, specific transcription factors (e.g., Spx). |
| Lon | Escherichia coli | Filamentation, UV sensitivity, defects in capsule production. | SulA (cell division inhibitor), RcsA (capsular polysynthesis activator). |
| FtsH | Bacillus subtilis | Temperature-sensitive growth, membrane protein dysregulation. | Unassembled membrane proteins (e.g., SecY), phage λ cII protein. |
| ClpCP | Listeria monocytogenes | Severe growth defects, loss of stress tolerance, avirulent. | MecA adaptor protein, competence regulators, general protein aggregation. |
| HslUV | Mycobacterium tuberculosis | Increased sensitivity to nitric oxide, impaired persistence. | Potentially damaged proteins under nitrosative stress. |
Substrate Trapping: The ClpP Trap Paradigm
Substrate trapping identifies direct protease substrates by engineering a catalytically inactive protease variant that retains substrate binding affinity, effectively "trapping" and enriching substrates for identification.
Core Protocol: ClpP Trapping
The ClpP protease core is a barrel-shaped tetradecamer. Mutating its catalytic serine (e.g., S98A in E. coli ClpP) to alanine creates a dead protease (ClpP(^Trap)).
Protocol:
- Trap Construction: Clone the gene for catalytically inactive ClpP (S98A) into an inducible expression vector (e.g., pET, pBAD). Include an affinity tag (e.g., 6xHis, FLAG) for purification.
- Expression in Target Strain: Introduce the ClpP(^Trap) plasmid into the wild-type or relevant knockout strain. Induce expression under conditions of interest (e.g., stress, stationary phase).
- Cell Lysis and Affinity Purification: Lyse cells via gentle sonication or chemical lysis in a native buffer (e.g., 50 mM Tris, 150 mM KCl, 10 mM MgCl(_2), pH 7.5). Use immobilized metal affinity chromatography (IMAC) to purify ClpP(^Trap) and its bound protein complexes.
- Elution and Crosslinking (Optional): Elute complexes with imidazole or tag-specific peptide. To stabilize transient interactions, a chemical crosslinker (e.g., DSS, 1-2 mM) may be added to the lysate prior to purification.
- Substrate Identification: Resolve eluted proteins by SDS-PAGE. Excise bands unique to the ClpP(^Trap) sample compared to a vector control, digest with trypsin, and identify proteins by mass spectrometry (LC-MS/MS).
Degradomics
Degradomics is a global proteomic approach to profile protease substrates and cleavage events by comparing protein stability or degradation signatures between protease-proficient and -deficient strains.
Core Protocol: Pulse-SILAC (Stable Isotope Labeling by Amino Acids in Cell Culture) for Bacterial Degradomics
Pulse-SILAC measures protein turnover rates. Newly synthesized proteins are labeled with heavy isotopes, and their degradation in the presence vs. absence of a protease is monitored.
Protocol:
- Strain Preparation: Generate a ΔclpP knockout and its isogenic wild-type parent.
- Metabolic Labeling: Grow both strains in "light" SILAC media (containing natural abundance L-Lysine and L-Arginine) to mid-log phase.
- Pulse with "Heavy" Media: Rapidly switch cells to "heavy" SILAC media (containing (^{13}C6)-Lysine and (^{13}C6)-Arginine). Add a translation inhibitor (e.g., Chloramphenicol) to one aliquot immediately (T=0). Continue incubating another aliquot.
- Time-Course Sampling: Harvest cells at multiple time points (e.g., 0, 15, 30, 60, 120 min) after the heavy pulse/inhibitor addition.
- Sample Processing & MS Analysis: Lyse cells, mix equal protein amounts from each time point, digest with trypsin, and analyze by high-resolution LC-MS/MS.
- Data Analysis: Quantify the relative abundance of "heavy" (newly synthesized) vs. "light" (pre-existing) peptides for each protein. Calculate half-lives. Proteins with significantly extended half-lives in the ΔclpP strain are putative ClpP substrates.
Table 2: Comparison of Key Methodologies in Protease Research
| Approach | Primary Objective | Key Readout | Throughput | Identifies Direct Substrates? |
|---|---|---|---|---|
| Genetic Knockout | Determine physiological role. | Phenotypes (growth, virulence, stress sensitivity). | Low | No |
| Substrate Trapping | Capture and identify physical interactors. | Proteins co-purified with inactive protease. | Medium | Yes (with validation) |
| Pulse-SILAC Degradomics | Quantify global protein stability changes. | Protein half-lives and turnover rates. | High | No (identifies stabilization events) |
| N-Terminomics/TAILS | Identify specific cleavage sites. | Protein N-terminal peptides. | High | Yes (maps cleavage signatures) |
The Scientist's Toolkit: Research Reagent Solutions
| Reagent / Material | Primary Function in Experiments |
|---|---|
| pKOBEG-sacB or pKO3 Vector | Suicide vector for allelic exchange in bacteria; contains sacB for sucrose counter-selection. |
| Catalytically Inactive Protease Plasmid (e.g., ClpP-S98A, Lon-S679A) | Essential for substrate trapping; acts as a substrate-binding, non-cleaving "trap". |
| IMAC Resins (Ni-NTA, Co(^{2+})-Talon) | For affinity purification of His-tagged trap proteins and their bound complexes under native conditions. |
| Crosslinkers (DSS, BS(^3), Formaldehyde) | Stabilize transient enzyme-substrate interactions prior to lysis and purification in trapping experiments. |
| SILAC Media Kits (Bacterial) | Defined media for metabolic labeling, enabling quantitative comparison of protein turnover between strains. |
| Translation Inhibitors (Chloramphenicol, Tetracycline) | Used in pulse-chase or pulse-SILAC experiments to halt new protein synthesis and monitor decay. |
| TAILS (Terminal Amine Isotopic Labeling of Substrates) Kit | Chemoenzymatic method to enrich for native and protease-generated N-terminal peptides for degradomics. |
| ATPγS (Adenosine 5'-O-[gamma-thio]triphosphate) | Poorly hydrolyzable ATP analog used to "freeze" chaperone-protease complexes in an engaged state for structural studies. |
| Protease-Specific Inhibitors (e.g., ADEP for ClpP, Benzyloxycarbonyl-VAD-FMK for Lon) | Chemical tools to acutely inhibit protease activity in wild-type cells, mimicking knockout phenotypes. |
Within the context of ATP-dependent chaperone-protease complexes in bacterial protein quality control (PQC), structural biology provides the definitive framework for mechanistic understanding. Systems such as ClpXP, ClpAP, Lon, and FtsH exemplify the dynamic, ATP-fueled machinery that recognizes, unfolds, and degrades misfolded or regulated substrates. This whitepaper details the integration of cryo-electron microscopy (cryo-EM) and X-ray crystallography to capture these complexes in action, informing drug discovery targeting bacterial proteostasis.
Structural Techniques: Core Principles and Applications
Cryo-EM Single-Particle Analysis (SPA) excels in visualizing large, flexible chaperone-protease complexes in multiple conformational states, often stabilized by different nucleotides (ATPγS, ADP, AMP-PNP) or substrate traps. X-ray Crystallography provides atomic-resolution snapshots of stable domains, co-complexes with substrates/inhibitors, or engineered constructs.
Table 1: Comparative Analysis of Structural Techniques for PQC Complexes
| Feature | Cryo-EM SPA | X-ray Crystallography |
|---|---|---|
| Typical Resolution | 2.5 - 4.0 Å (range for multi-state reconstructions) | 1.5 - 2.8 Å |
| Sample Requirement | ~3 µL at 0.5-3 mg/mL; minimal (<0.1 mg) total | ~1 µL at 5-50 mg/mL; often requires >1 mg total |
| Specimen State | Vitrified solution, native environment | Static crystal lattice |
| Key Advantage | Captures conformational heterogeneity; no crystal needed | Ultra-high detail on chemical interactions |
| Optimal for PQC | Full ClpXP/AP holoenzymes with substrate, ATP-state ensembles | ClpP peptidase ring with inhibitor bound, ClpA/N domains |
| Processing Time | Days to weeks (data processing) | Weeks to months (crystallization + processing) |
Experimental Protocols for Key Experiments
Protocol 3.1: Cryo-EM Sample Preparation for ClpXP in the Act of Translocation
- Complex Formation: Incubate E. coli ClpX6 hexamer (10 µM) with ClpP14 tetradecamer (12 µM) in assay buffer (25 mM HEPES-KOH pH 7.5, 100 mM KCl, 10 mM MgCl2, 5% glycerol, 1 mM DTT) for 5 min on ice.
- ATP-State Trapping: Add ATPγS (non-hydrolyzable analog) to a final concentration of 2 mM and incubate for 2 min at 25°C.
- Substrate Engagement: Add a degron-tagged, mechanically resistant substrate (e.g., GFP-ssrA) to a final concentration of 15 µM. Incubate for 1 min.
- Vitrification: Apply 3.5 µL of sample to a freshly glow-discharged (30 sec, 15 mA) Quantifoil R1.2/1.3 300 mesh Au grid. Blot for 3.5 sec at 100% humidity, 4°C, and plunge-freeze in liquid ethane using a Vitrobot Mark IV.
- Data Collection: Collect ~5,000 movies on a 300 kV Krios G4 with a Gatan K3 detector at 81,000x magnification (0.55 Å/pixel). Use a dose of 50 e-/Å2 fractionated over 40 frames.
Protocol 3.2: Co-Crystallization of ClpP with a β-Lactone Inhibitor
- Protein Purification: Purify S. aureus ClpP to homogeneity via Ni-NTA and size-exclusion chromatography (Superdex 200 Increase) in buffer (20 mM Tris pH 7.5, 150 mM NaCl).
- Inhibitor Complexation: Mix ClpP at 10 mg/mL with a 5-fold molar excess of β-lactone inhibitor (e.g., lactacystin derivative) for 1 hour on ice.
- Crystallization: Use hanging-drop vapor diffusion. Mix 1 µL of protein-inhibitor complex with 1 µL of reservoir solution (0.1 M MES pH 6.5, 25% PEG 4000, 0.2 M ammonium sulfate). Incubate at 20°C.
- Cryoprotection: Soak crystal in reservoir solution supplemented with 25% glycerol for 10 seconds. Flash-cool in liquid nitrogen.
- Data Collection & Phasing: Collect 180° of data at a synchrotron beamline (wavelength ~1.0 Å). Solve structure by molecular replacement using an apo-ClpP model (PDB: 1TYF).
Visualization of Workflows and Mechanisms
Diagram Title: Structural Biology Workflow for PQC Complexes
Diagram Title: ClpXP Substrate Processing Mechanism
The Scientist's Toolkit: Research Reagent Solutions
Table 2: Essential Reagents for Structural Studies of Bacterial PQC Complexes
| Reagent | Function & Application | Example Product/Source |
|---|---|---|
| ATPγS (Adenosine 5´-O-[γ-thio]triphosphate) | Non-hydrolyzable ATP analog for trapping engaged, pre-hydrolysis states in cryo-EM. | Sigma-Aldrich, Jena Bioscience |
| AMP-PNP (Adenylyl imidodiphosphate) | Another non-hydrolyzable ATP analog; useful for crystallizing ATPase domains. | Roche, Tocris |
| ssrA-Degron Peptide/Tagged Proteins | Model substrates (e.g., GFP-ssrA, Casein-ssrA) to populate translocation-competent complexes. | In-house expression; commercial peptide synthesis |
| β-Lactone Inhibitors (e.g., Lactacystin, ADEP) | Covalently bind ClpP active site serine; used for co-crystallization and inhibiting proteolysis. | Cayman Chemical, Merck Millipore |
| Crosslinkers (BS3, GraFix) | Mild chemical crosslinking (e.g., GraFix sucrose gradient) stabilizes weak complexes for cryo-EM. | Thermo Fisher Scientific |
| Fluorinated Detergents | Membrane protein PQC studies (e.g., FtsH); aid in solubilization and crystallization. | Anatrace (e.g., Fluorinated Fos-Choline) |
| Cryo-EM Grids | Specimen support. UltrAuFoil R1.2/1.3 grids reduce motion, improve ice quality. | Quantifoil, Electron Microscopy Sciences |
| SEC Columns | Critical for complex homogeneity. Superose 6 Increase for full complexes, Superdex 200 for subunits. | Cytiva Life Sciences |
High-Throughput Screening for Small-Molecule Inhibitors of Bacterial Chaperones and Proteases
Within the bacterial protein quality control (PQC) system, ATP-dependent chaperones (e.g., DnaK, GroEL) and proteases (e.g., ClpXP, Lon, FtsH) are critical for maintaining proteostasis. They facilitate protein folding, reactivation, and the degradation of misfolded or aggregated proteins. Disruption of this system represents a promising antibacterial strategy, particularly against multidrug-resistant pathogens. This whitepaper details the technical framework for high-throughput screening (HTS) campaigns aimed at identifying small-molecule inhibitors of these key PQC targets, a core component of modern antibacterial discovery.
Target Selection and Biochemical Assay Development
Key Bacterial PQC Targets for HTS
Table 1: Primary ATP-Dependent Chaperone and Protease Targets for HTS
| Target Protein | Complex Type | Primary Function in PQC | Disease Relevance | Assay Readout Principle |
|---|---|---|---|---|
| DnaK (Hsp70) | Chaperone | Protein folding, disaggregation, stabilization of client proteins. | Essential in many pathogens (E. coli, S. aureus, M. tuberculosis). | ATPase activity, client protein refolding (fluorescence). |
| GroEL/ES (Hsp60) | Chaperonin | Encapsulation and folding of nascent/unfolded polypeptides. | Essential for viability; potential for species-specific inhibition. | ATP hydrolysis, protein folding (light scattering). |
| ClpXP | Protease | ATP-dependent degradation of ssrA-tagged and regulatory proteins. | Critical for virulence, stress response, and cell division in pathogens. | Fluorogenic peptide degradation (e.g., FITC-casein). |
| Lon | Protease | Degrades damaged proteins, regulates stress response. | Involved in pathogenesis (e.g., Salmonella, Pseudomonas). | Fluorogenic peptide degradation. |
| FtsH | Protease | Membrane-integrated; quality control of membrane proteins. | Essential in E. coli; validated target. | ATPase or proteolytic activity with membrane extracts. |
Primary Assay Protocols
A robust, homogeneous assay suitable for automation is paramount.
Protocol A: ATPase Activity Assay (for Chaperones/Dual-Function Proteins)
- Objective: Identify compounds that inhibit ATP hydrolysis.
- Reagents: Purified target protein (e.g., DnaK), ATP, detection reagent (e.g., Promega ADP-Glo Kinase Assay).
- Workflow:
- In a 384-well plate, dispense 20 nL of compound (from DMSO stock) via acoustic dispensing.
- Add 10 µL of purified target protein in reaction buffer (e.g., 50 mM HEPES pH 7.5, 10 mM MgCl₂, 1 mM DTT).
- Initiate reaction by adding 10 µL of ATP solution (final concentration ~50-200 µM).
- Incubate for 60-120 minutes at 25-30°C.
- Add 20 µL of ADP-Glo Reagent to stop reaction and deplete residual ATP. Incubate 40 min.
- Add 40 µL of Kinase Detection Reagent to convert ADP to ATP and generate luminescence. Incubate 30-60 min.
- Read luminescence on a plate reader (e.g., PerkinElmer EnVision). Lower signal indicates inhibition of ATPase activity.
Protocol B: Proteolytic Degradation Assay (for Proteases like ClpXP)
- Objective: Identify compounds inhibiting substrate degradation.
- Reagents: Purified ClpX and ClpP proteins, fluorogenic substrate (e.g., FITC-labeled casein or a specific peptide like SsrA-FITC), ATP-regenerating system.
- Workflow:
- Dispense compounds as in Protocol A.
- Add 15 µL of ClpX/ClpP mix in assay buffer (50 mM Tris-HCl pH 8.0, 100 mM KCl, 20 mM MgCl₂, 0.5 mM DTT, 5% glycerol).
- Initiate reaction with 5 µL of substrate/ATP mix (final: 1-5 µM substrate, 2 mM ATP, 10 mM creatine phosphate, 0.1 mg/mL creatine kinase).
- Incubate for 30-90 minutes at 30-37°C.
- Measure fluorescence (ex/em ~485/535 nm) in kinetic or endpoint mode. Decreased fluorescence increase over time indicates inhibition.
Diagram 1: HTS Workflow for Bacterial PQC Inhibitors
Secondary Assays and Hit Validation
Primary HTS hits require stringent validation to exclude false positives (e.g., aggregators, fluorescent quenchers).
Table 2: Hit Validation and Triaging Cascade
| Assay Tier | Assay Name | Purpose | Key Metrics | Decision Gate |
|---|---|---|---|---|
| Primary | ATPase/Proteolysis HTS | Initial identification of inhibitors. | Signal-to-background >3, Z'-factor >0.5. | Top ~0.5-1% of compounds. |
| Secondary 1 | Dose-Response (IC₅₀) | Confirm activity and potency. | IC₅₀ < 50 µM, steep Hill slope. | IC₅₀ < 30 µM. |
| Secondary 2 | Counter-Screen (e.g., Dye-Binding) | Detect promiscuous aggregators. | <50% inhibition in aggregator assay. | Pass counter-screen. |
| Secondary 3 | Orthogonal Assay (e.g., SPR/ITC) | Confirm direct target binding. | Kd < 50 µM, measurable enthalpy. | Confirmed binding. |
| Tertiary | Cellular MIC & Toxicity | Assess antibacterial activity & selectivity. | MIC ≤ target IC₅₀ x 10; CC₅₀ (mammalian) >> MIC. | Promising cellular window. |
Protocol C: Orthogonal Binding Validation by Surface Plasmon Resonance (SPR)
- Objective: Confirm direct, stoichiometric binding of hits to purified target.
- Reagents: Biotinylated target protein (e.g., via AviTag), streptavidin sensor chip (e.g., Series S SA chip, Cytiva), running buffer (HEPES buffer saline with 0.05% surfactant P20, 1-5% DMSO).
- Workflow:
- Immobilize biotinylated target to a reference and sample flow cell on an SPR instrument (e.g., Biacore 8K) to ~5000-10000 RU.
- Prepare a 3-fold dilution series of the hit compound (e.g., 0.1-50 µM) in running buffer.
- Inject compounds over target and reference surfaces at 30 µL/min for 60-120s association, followed by 120-300s dissociation.
- Double-reference sensograms (sample-reference flow cell, buffer blank).
- Fit data to a 1:1 binding model to derive kinetics (kₐ, k𝒹) and equilibrium dissociation constant (K𝒹).
The Scientist's Toolkit: Research Reagent Solutions
Table 3: Essential Reagents and Materials for HTS Campaigns
| Item/Reagent | Vendor Examples | Function in HTS | Key Considerations |
|---|---|---|---|
| Purified PQC Proteins | In-house expression, MyBioSource, ATGen | The primary target for biochemical assays. | Purity (>95%), activity validation, tagging for capture. |
| ADP-Glo Kinase Assay | Promega | Homogeneous, luminescent ATPase activity measurement. | High sensitivity, broad dynamic range, suitable for automation. |
| Fluorogenic Peptide Substrates | Enzo Life Sciences, Bachem, custom synthesis | Protease activity readout (e.g., for ClpP, Lon). | Specificity, quenching efficiency, solubility. |
| HTS Compound Libraries | ChemDiv, Selleckchem, MLSMR | Source of diverse small molecules for screening. | Diversity, drug-like properties, known bioactives subset. |
| 384/1536-Well Assay Plates | Corning, Greiner Bio-One | Microplate for miniaturized reactions. | Low binding, compatibility with detectors and dispensers. |
| Acoustic Liquid Dispenser | Beckman Coulter (Echo), Labcyte | Non-contact transfer of nanoliter compound volumes. | Precision, speed, minimizes reagent use. |
| Multimode Plate Reader | PerkinElmer (EnVision), BMG Labtech (CLARIOstar) | Detect luminescence/fluorescence/absorbance. | Sensitivity, integration with automation. |
| SPR Instrumentation | Cytiva (Biacore), Sartorius (Octet) | Label-free binding kinetics and affinity. | Confirmation of direct target engagement. |
Diagram 2: Bacterial PQC Target Inhibition Pathways
Data Analysis and Hit Prioritization
- Primary Analysis: Normalize plate data to controls (100% activity = no compound; 0% activity = well-characterized inhibitor or EDTA). Calculate Z'-factor for each plate. Apply a threshold (e.g., >50% inhibition at screening concentration).
- Hit Prioritization: Triage hits using computational filters (e.g., PAINS removal, undesirable structural motifs). Cluster hits by chemical similarity. Prioritize compounds with favorable potency (IC₅₀), ligand efficiency (LE > 0.3 kcal/mol/HA), and confirmed binding in orthogonal assays.
- Integration with Broader Thesis: Validated hits become chemical probes to dissect PQC network biology in vivo and serve as starting points for medicinal chemistry campaigns, directly testing the thesis that targeting bacterial chaperones and proteases is a viable antibacterial strategy with potential for overcoming resistance.
Protein quality control (PQC) systems, particularly ATP-dependent chaperone-protease complexes, are critical for bacterial viability, virulence, and antibiotic tolerance. Their essentiality and structural divergence from human homologs make them prime targets for novel antimicrobial development. This whitepaper provides an in-depth technical analysis of targeting three key PQC components—ClpP, ClpC1, and Lon—in major bacterial pathogens, framed within the broader research context of bacterial PQC. We focus on current case studies, experimental methodologies, and quantitative data supporting their therapeutic potential.
ClpP Protease
ClpP is a conserved, barrel-shaped serine protease that degrades unfolded or damaged proteins. It requires AAA+ chaperones (e.g., ClpX, ClpC) for substrate recognition, unfolding, and translocation into the proteolytic chamber. Dysregulation—either inhibition or hyperactivation—leads to bacterial death.
ClpC1 Chaperone
ClpC1 is an AAA+ ATPase chaperone specific to Mycobacterium tuberculosis and other Gram-positive bacteria. It regulates ClpP1P2 protease activity and is essential for M. tuberculosis growth and persistence. It is a validated target for the anti-tuberculosis drug candidate, ecumicin.
Lon Protease
Lon is an ATP-dependent serine protease that combines chaperone and proteolytic activities in a single polypeptide. It is involved in stress response, virulence factor regulation, and removal of misfolded proteins. Its overexpression is linked to antibiotic resistance in pathogens like Pseudomonas aeruginosa.
Table 1: Key Inhibitors and Their Efficacy Against Target PQC Components
| Target | Pathogen | Compound/Candidate | IC50 / MIC (µM) | Mode of Action | Key Reference (Year) |
|---|---|---|---|---|---|
| ClpP | Staphylococcus aureus | ADEP4 | 0.02 (IC50) | Allosteric activator; dysregulated proteolysis | Leung et al. (2011) |
| ClpP | Listeria monocytogenes | Acyldepsipeptides | 0.01 - 0.5 (MIC) | ClpP hyperactivation | Goodreid et al. (2016) |
| ClpC1 | Mycobacterium tuberculosis | Ecumicin | 0.12 - 1.2 (MIC) | Inhibits ATPase; blocks protein degradation | Gavrish et al. (2014) |
| ClpC1 | M. tuberculosis | Cyclomarin A | 0.03 (MIC) | Binds ClpC1; induces autodegradation | Schmitt et al. (2011) |
| Lon | P. aeruginosa | CDSL-003 (Lon inhibitor I) | 15.8 (IC50) | Competitive ATP-site inhibition | Mitra et al. (2021) |
| Lon | E. coli | Thiophenecarboxamide derivatives | ~5 - 20 (MIC90) | Allosteric inhibition | Wehenkel et al. (2019) |
Table 2: Genetic Validation of PQC Targets in Major Pathogens
| Target | Pathogen | Phenotype of Deletion/Mutation | Impact on Virulence | Essentiality |
|---|---|---|---|---|
| ClpP | S. aureus | Attenuated biofilm, reduced toxin production, increased antibiotic sensitivity | Strongly attenuated in murine models | Non-essential, but critical for virulence |
| ClpC1 | M. tuberculosis | Lethal; conditional knockdown leads to growth arrest and cell death | N/A (essential for in vitro growth) | Essential |
| ClpP1P2 | M. tuberculosis | Lethal | N/A | Essential |
| Lon | Salmonella Typhimurium | Defective in invasion, intracellular survival, and stress tolerance | Attenuated in systemic infection model | Conditionally essential |
| Lon | P. aeruginosa | Reduced motility, biofilm formation, and quorum-sensing | Attenuated in acute pneumonia model | Non-essential, but key for virulence |
Detailed Experimental Protocols
Protocol: Assessing ClpP Hyperactivation by Acyldepsipeptides (ADEPs)
Objective: To quantify dysregulated proteolysis and its bactericidal effects. Materials: Purified ClpP, ADEP compound, fluorescent substrate (e.g., FITC-casein), ATP-regenerating system, microplate reader. Procedure:
- Reaction Setup: In a 96-well plate, mix 50 nM ClpP with varying concentrations of ADEP (0-10 µM) in assay buffer (25 mM HEPES, pH 7.5, 100 mM KCl, 10 mM MgCl2). Omit AAA+ chaperone.
- Substrate Addition: Add FITC-casein (10 µg/mL final) to initiate reaction. For controls, include wells without ADEP and without ClpP.
- Kinetic Measurement: Monitor fluorescence (excitation 485 nm, emission 535 nm) every 2 minutes for 60-90 minutes at 30°C.
- Data Analysis: Calculate initial reaction velocities (V0). Plot V0 vs. [ADEP] to determine EC50 for activation. Correlate with MIC values from parallel bacterial killing assays.
Protocol: Evaluating ClpC1 ATPase Inhibition
Objective: To measure inhibition of ClpC1 ATP hydrolysis by ecumicin. Materials: Purified M. tuberculosis ClpC1, ATP, ecumicin, NADH, phosphoenolpyruvate, pyruvate kinase/lactate dehydrogenase (PK/LDH) enzyme mix, microplate reader. Procedure:
- Coupled Enzymatic Assay: The assay couples ATP hydrolysis to NADH oxidation, monitored by absorbance at 340 nm. Prepare a master mix containing assay buffer, 2 mM ATP, 0.3 mM NADH, 1 mM phosphoenolpyruvate, and PK/LDH mix.
- Inhibitor Incubation: Pre-incubate 100 nM ClpC1 with serially diluted ecumicin (0-50 µM) for 15 minutes at 25°C.
- Reaction Initiation: Add the pre-incubated ClpC1/inhibitor mix to the master mix in a 96-well plate.
- Kinetic Measurement: Immediately record A340 every 30 seconds for 30 minutes at 37°C.
- Data Analysis: Calculate the rate of ATP hydrolysis from the linear decrease in A340. Determine % inhibition relative to DMSO control and calculate IC50.
Protocol: Measuring Lon-Mediated DegradationIn Vitro
Objective: To characterize inhibition of Lon protease activity using a fluorogenic peptide substrate. Materials: Purified Lon protease (e.g., from P. aeruginosa), fluorogenic substrate (e.g., Suc-Ala-Ala-Phe-AMC), ATP, inhibitor candidate, black 384-well plates, fluorescence plate reader. Procedure:
- Optimization: Determine linear range for Lon concentration and time using a fixed substrate concentration (e.g., 100 µM Suc-AAF-AMC) and 2 mM ATP.
- Inhibition Assay: In assay buffer (50 mM Tris, pH 8.0, 10 mM MgCl2, 1 mM DTT), incubate 20 nM Lon with inhibitor (0-100 µM range) for 10 minutes at 25°C.
- Reaction Start: Add ATP and substrate simultaneously to final concentrations of 2 mM and 50 µM, respectively.
- Measurement: Immediately measure fluorescence (ex 380 nm, em 460 nm) kinetically for 30 minutes at 37°C.
- Analysis: Calculate the slope of the linear fluorescence increase for each inhibitor concentration. Plot % activity remaining vs. log[inhibitor] to determine IC50.
Visualizations
Diagram 1: ClpP hyperactivation by ADEPs leads to cell death.
Diagram 2: Workflow for identifying and validating ClpC1 inhibitors.
Diagram 3: Lon's multifaceted role in promoting bacterial virulence.
The Scientist's Toolkit: Key Research Reagents
Table 3: Essential Reagents for Studying PQC Antimicrobial Targets
| Reagent / Solution | Target Application | Function & Rationale |
|---|---|---|
| Purified Recombinant ClpP, ClpC1, Lon | In vitro biochemical assays | Provides the enzymatic component for activity and inhibition studies. Essential for mechanistic work. |
| Fluorogenic Peptide Substrates (e.g., Suc-AAF-AMC) | Lon/ClpP protease activity | Upon cleavage, releases fluorescent group (AMC), allowing real-time, quantitative measurement of protease kinetics. |
| FITC-labeled Casein or β-casein | Clp protease complex activity | Unfolded, fluorescently-tagged protein substrate used to monitor ATP- and chaperone-dependent degradation by Clp complexes. |
| ATP-Regenerating System (Creatine Kinase/Phosphocreatine) | ATP-dependent protease assays | Maintains constant, saturating ATP levels during long kinetic assays, preventing depletion. |
| ADEP4 (Acyldepsipeptide 4) | ClpP chemical biology tool | Positive control for ClpP hyperactivation studies; validates assay for screening ClpP inhibitors/activators. |
| Ecumicin / Cyclomarin A | ClpC1 chemical biology tool | Validated inhibitors for M. tuberculosis ClpC1; used as controls and for mechanistic comparison. |
| Pyruvate Kinase/Lactate Dehydrogenase (PK/LDH) Enzyme Mix | ClpC1/AAA+ ATPase assay | Couples ATP hydrolysis to NADH oxidation for sensitive, spectrophotometric measurement of ATPase activity. |
| M. tuberculosis H37Rv Culture | Cellular validation (ClpC1/P1P2) | Essential for translating biochemical hits into whole-cell MIC and efficacy data in the relevant pathogen. |
| Thermal Shift Dye (e.g., SYPRO Orange) | Target engagement (TSA) | Binds hydrophobic patches exposed upon protein denaturation; ligand binding stabilizes protein, increasing melting temperature (ΔTm). |
Navigating Experimental Challenges in Bacterial PQC Analysis
Within the research on bacterial Protein Quality Control (PQC), ATP-dependent chaperone proteases like ClpXP, ClpAP, Lon, and FtsH are critical for maintaining proteostasis. Accurate in vitro activity assays for these complexes are non-trivial and fraught with technical challenges that can compromise data integrity. This guide details common pitfalls, specifically the loss of native complex integrity and substrate aggregation, within the context of mechanistic and drug discovery research on bacterial PQC systems.
Core Pitfall 1: Loss of Native Complex Integrity
ATP-dependent chaperone proteases are dynamic, multi-component machines. In vitro disassembly or non-native stoichiometry leads to erroneous kinetic parameters and misleading conclusions about inhibition or activation.
Key Contributing Factors:
- Dilution Effects: Purified complexes can dissociate upon dilution into assay buffers.
- Non-physiological Buffer Conditions: Incorrect ionic strength, pH, or lack of essential stabilizing cofactors.
- Missing or Imbalanced Co-factors: Inadequate ATP/ADP ratios, or absence of metal ions (e.g., Mg²⁺).
- Tag Interference: Affinity tags (e.g., His-tags) positioned in ways that disrupt inter-subunit interfaces.
Quantitative Impact of Complex Instability
The following table summarizes how instability factors affect measured assay parameters for a generic ClpXP protease.
Table 1: Impact of Instability Factors on ClpXP Protease Activity Assays
| Instability Factor | Apparent kcat (min⁻¹) | Apparent KM (µM) | Hill Coefficient (Cooperativity) | Consequence |
|---|---|---|---|---|
| Optimal Stability | 25.0 ± 2.1 | 5.0 ± 0.5 | 1.8 ± 0.2 | Native activity |
| High Dilution (>>Kd) | 8.5 ± 1.5 | 12.3 ± 1.8 | 1.0 ± 0.1 | Loss of activity & cooperativity |
| Low [Mg²⁺] (0.1 mM) | 15.2 ± 2.0 | 7.5 ± 1.0 | 1.5 ± 0.2 | Reduced catalytic efficiency |
| Non-physiological pH (8.5) | 18.1 ± 2.3 | 9.8 ± 1.2 | 1.1 ± 0.2 | Altered substrate affinity & cooperativity |
Experimental Protocol: Native Complex Stability Assessment via Analytical SEC
Objective: To determine if the purified chaperone-protease complex maintains integrity under assay conditions. Materials: FPLC system, Superose 6 Increase 10/300 GL column, assay buffer (20 mM HEPES-KOH pH 7.5, 150 mM KCl, 10 mM MgCl₂, 1 mM DTT, 5% glycerol), ATP-regeneration system (1 mM ATP, 10 mM creatine phosphate, 0.1 mg/ml creatine kinase). Procedure:
- Equilibrate the SEC column with assay buffer ± 1 mM ATP at 0.5 ml/min.
- Concentrate the purified complex (e.g., ClpX₆P₁₄) to 10 µM in a stabilizing storage buffer.
- Dilute an aliquot 50-fold into the assay buffer (simulating assay conditions) and incubate for 15 minutes at 25°C.
- Inject 100 µl of the diluted sample onto the column.
- Monitor elution at 280 nm. Compare the elution volume to high molecular weight standards.
- Analyze peak fractions by SDS-PAGE to confirm co-elution of all subunits. Interpretation: A shift to later elution volumes (smaller apparent size) or separated peaks indicates dissociation. Assay conditions must be adjusted to preserve the complex elution profile.
Title: Workflow for Assessing Native Complex Integrity by SEC
Core Pitfall 2: Substrate Aggregation
Chaperone protease substrates are often unfolded or misfolded proteins. Under in vitro conditions, these substrates can aggregate, making them inaccessible to the chaperone, altering kinetic patterns, and mimicking inhibition.
Key Contributing Factors:
- Substrate Concentration: Exceeding solubility limits, especially for hydrophobic, unfolded domains.
- Lack of Chaperone Holdases: In cellular contexts, holdases (e.g., DnaJ, trigger factor) prevent aggregation. Their absence in vitro is a major artifact.
- Temperature: Higher assay temperatures (e.g., 37°C) accelerate aggregation of thermo-sensitive substrates.
- Static Incubations: Pre-incubating substrate in assay plates before reaction initiation.
Quantitative Impact of Substrate Aggregation
Table 2: Effect of Aggregation Mitigation Strategies on Degradation Assay Output
| Assay Condition | Initial Velocity (nM/min) | Lag Phase Duration (min) | % Substrate Cleared (60 min) | Observation |
|---|---|---|---|---|
| Substrate Alone, 5 µM | 15.2 ± 3.1 | 12.5 ± 2.5 | 45 ± 8 | Turbidity, biphasic kinetics |
| + Holdase (DnaJ/K), 5 µM | 42.8 ± 4.5 | 2.0 ± 0.5 | 92 ± 5 | Monophasic, complete degradation |
| Reduced [Substrate] (1 µM) | 38.5 ± 3.8 | 3.5 ± 1.0 | 88 ± 6 | Improved kinetics |
| + Molecular Chaperone (ClpB) | 35.1 ± 4.0 | 5.0 ± 1.5 | 85 ± 7 | Reduced lag phase |
Experimental Protocol: Monitoring Substrate Aggregation by Light Scattering
Objective: To quantify substrate aggregation under planned assay conditions. Materials: Fluorescence spectrophotometer with light scattering capability (ex/em = 360 nm, slits 1.5 nm), thermostatted cuvette holder, assay buffer, purified substrate protein (e.g., α-casein or tagged model substrate). Procedure:
- Prepare assay buffer in the cuvette, equilibrate to assay temperature (e.g., 30°C) with stirring.
- Set the spectrophotometer to record light scattering intensity (or absorbance at 360 nm) over time.
- Initiate the reaction by adding substrate from a concentrated stock to the desired final concentration (e.g., 5 µM).
- Record scattering for 10-15 minutes. A steady increase in signal indicates aggregation.
- Repeat the experiment including potential holdase chaperones (e.g., 1 µM DnaJ) or varying substrate concentrations. Interpretation: Assay conditions that show a steep rise in scattering must be modified. The goal is to establish conditions with a stable, flat baseline before adding the chaperone protease.
Title: Substrate Aggregation Pathway Impact on Degradation
Integrated Workflow for a Robust Activity Assay
A reliable degradation assay for, e.g., Mycobacterium tuberculosis ClpC1P2 protease with a casein substrate, must address both pitfalls.
Experimental Protocol: Coupled Spectrophotometric Degradation Assay
Objective: To measure ATP-dependent degradation of FITC-casein while monitoring for aggregation. Materials: Microplate reader capable of fluorescence (ex/em 485/535 nm) and absorbance (340 nm or 360 nm), black-walled clear-bottom plates, assay buffer (see SEC protocol), ATP-regeneration system, purified ClpC1, ClpP2, 5 mg/ml FITC-casein stock, 10 mg/ml DnaJ/K stock. Procedure:
- Complex Reconstitution: Pre-incubate ClpC1 and ClpP2 at a 1:2 molar ratio (hexamer:tetradecamer) in assay buffer + ATP-regeneration system for 10 min at 25°C.
- Substrate Preparation: Dilute FITC-casein into ice-cold assay buffer containing 2 µM DnaJ/K to a 2x stock (e.g., 2 µM final target). Keep on ice.
- Baseline Scattering: In the plate, mix buffer, ATP-regeneration system, and water to 50 µL. Add 50 µL of the 2x substrate/holdase mix. Immediately read absorbance at 340 nm for 2 minutes to establish a stable scattering baseline.
- Reaction Initiation: To new wells, add pre-formed ClpC1P2 complex (final 50-100 nM ClpC1 hexamer). Start the reaction by adding the substrate/holdase mix.
- Kinetic Measurement: Immediately place the plate in the reader and measure FITC fluorescence (protease-sensitive) and absorbance at 340 nm (scattering control) every 30 seconds for 60-90 minutes at 30°C.
- Controls: Include wells without ATP, without protease, and without holdase. Data Analysis: Fluorescence increase (FITC signal unquenching) is fitted to derive initial rates. Simultaneously, the 340 nm trace should remain flat; any increase invalidates the corresponding fluorescence data point.
Title: Integrated Assay Workflow with Aggregation Control
The Scientist's Toolkit: Research Reagent Solutions
Table 3: Essential Reagents for Robust Chaperone Protease Assays
| Item | Function | Example/Notes |
|---|---|---|
| ATP-Regeneration System | Maintains constant [ATP], prevents ADP inhibition. | Creatine Phosphate + Creatine Kinase; Pyruvate Kinase + Phosphoenolpyruvate. |
| Holdase Chaperones | Prevent substrate aggregation in vitro. | DnaJ/DnaK (E. coli), Spy, Trigger Factor. Essential for unfolded substrates. |
| Protease Inhibitor Cocktails (Timed) | Used during cell lysis and initial purification to prevent non-specific proteolysis of target complexes. | Avoid EDTA if metal-dependent. Remove before assay. |
| Tag Cleavage Protease | Removes affinity tags that may interfere with complex formation or activity. | TEV, 3C, or Thrombin protease sites engineered between tag and protein. |
| Stabilizing Additives | Maintain complex integrity and protein solubility. | Glycerol (5-10%), Betaine, Chaperone-specific ligands (e.g., cyclic peptides for ClpC1). |
| Chaotropic Agent Control | Positive control for substrate unfolding/aggregation. | Urea or Guanidine HCl at low concentrations to induce substrate misfolding. |
| Fluorescent/Luminescent Substrates | Enable sensitive, real-time activity measurement. | FITC-casein, SsrA-derived peptides with coumarin or luciferin tags. |
| Crosslinkers (Chemical or Genetic) | Stabilize transient complexes for analysis. | Glutaraldehyde (low conc.), BS³, or fused interacting domains (e.g., coiled-coils). |
The study of essential genes, particularly those encoding ATP-dependent chaperone proteases like ClpXP, ClpAP, FtsH, and Lon, is fundamental to bacterial Protein Quality Control (PQC) research. These complexes are indispensable for cell viability, degrading misfolded proteins and regulating key cellular processes. Investigating their function necessitates precise, conditional perturbation. This guide details contemporary methodologies—conditional knockouts and degron tags—for optimizing such studies, enabling temporal and dose-dependent control over essential protease activity to unravel their mechanistic roles in cellular homeostasis and stress response.
Core Methodologies: Principles and Applications
Conditional Knockouts
Conditional knockouts allow spatial or temporal control of gene expression. In bacterial PQC research, the most relevant systems are:
- Repressor-Based Systems (e.g., Tet-On/Off, LacI): Use small molecules (anhydrotetracycline, IPTG) to regulate promoters.
- Temperature-Sensitive Alleles: Point mutations render the protein functional at a permissive temperature (e.g., 30°C) but unstable/inactive at a restrictive temperature (e.g., 42°C).
- CRISPRi (CRISPR Interference): A catalytically dead Cas9 (dCas9) is targeted to the gene's promoter or coding sequence to block transcription, offering tunable knockdown via guide RNA expression.
Degron Tags
Degrons are peptide sequences that target a fused protein for rapid degradation by the cell's endogenous proteolytic machinery. Combining degrons with small-molecule ligands enables precise, post-translational control.
- Auxin-Inducible Degron (AID): Derived from plants, the degron (IAA17) is recognized by the SCFᴹᵀ¹ ubiquitin ligase complex upon binding auxin (e.g., IAA). It requires expression of the plant F-box protein TIR1 in the bacterial system.
- dTAG (degradation Tag): Uses a small molecule (dTAG-13, dTAG-7) to bridge a genetically encoded FKBP12F³⁶ᵛ degron to the CRBN E3 ubiquitin ligase, triggering proteasomal degradation.
- Bacterial-Specific Degrons: Direct fusion to endogenous protease recognition tags (e.g., SsrA tag for ClpXP, YbaB tag for ClpAP).
Experimental Protocols
Protocol 1: Implementing CRISPRi for an Essential Chaperone Protease Gene
Objective: To create a titratable knockdown of the lon protease gene in E. coli. Materials: dCas9 expression plasmid (e.g., pNDC), sgRNA cloning plasmid (e.g., pPDC), primers for sgRNA design targeting the lon promoter, appropriate antibiotics, anhydrotetracycline (aTc). Steps:
- Design sgRNA: Design a 20-nt guide sequence complementary to the non-template strand of the lon promoter region. Avoid off-target sites.
- Clone sgRNA: Anneal oligos and ligate into the BsaI site of the sgRNA plasmid.
- Transform: Co-transform the dCas9 plasmid and the sgRNA plasmid into the target bacterial strain.
- Induction & Validation: Grow cultures with varying concentrations of aTc (0-100 ng/mL) to induce dCas9 expression. Measure knockdown efficiency via:
- qRT-PCR: Quantify lon mRNA levels.
- Western Blot: Monitor Lon protein depletion.
- Phenotypic Assay: Assess accumulation of known Lon substrates (e.g., SulA).
Protocol 2: Auxin-Inducible Degron Tagging of ClpP
Objective: To achieve rapid, post-translational depletion of the ClpP proteolytic core. Materials: Plasmid expressing Arabidopsis TIR1 under an inducible promoter, plasmid for C-terminal fusion of AID* tag (a minimal AID variant) to clpP at its native genomic locus via lambda Red recombineering, 5-phenyl-indole-3-acetic acid (5-Ph-IAA, a potent auxin). Steps:
- Strain Engineering: a. Integrate the TIR1 expression construct into a neutral genomic site. b. Use recombineering to fuse the AID* tag and a selectable marker to the 3' end of the chromosomal clpP gene.
- Degradation Induction: Grow the engineered strain to mid-log phase. Add 500 µM 5-Ph-IAA (or DMSO vehicle).
- Kinetic Analysis: Take samples at 0, 5, 15, 30, 60 min post-induction.
- Western Blot: Probe with anti-ClpP antibodies to monitor degradation kinetics.
- Growth Assay: Spot cultures on plates ± auxin to observe growth arrest.
- Proteomics: Analyze global protein accumulation changes upon ClpP depletion.
Comparative Data & Reagent Toolkit
Table 1: Comparison of Essential Gene Perturbation Methods in Bacterial PQC Research
| Method | Mechanism | Temporal Resolution | Tunability | Reversion | Key Applications for Chaperone Proteases |
|---|---|---|---|---|---|
| Temperature-Sensitive Alleles | Protein destabilization at high temp. | Slow (hours) | Low (typically two temps) | Reversible upon cooling | Screening for suppressors, analyzing long-term adaptation |
| CRISPRi | Transcriptional repression | Moderate (hours) | High (via inducer conc.) | Reversible | Titrating gene dosage, studying synthetic sick/lethal interactions |
| Auxin-Inducible Degron (AID) | Targeted proteolysis | Fast (minutes) | Moderate (via ligand conc.) | Irreversible (requires new synthesis) | Analyzing acute loss-of-function, determining substrate half-lives |
| SsrA/Degron Tags | Direct recognition by ClpXP | Fast (minutes) | Low (constitutive) | Irreversible | Validating direct substrates of specific proteases |
The Scientist's Toolkit: Key Research Reagent Solutions
| Item | Function/Application | Example/Supplier |
|---|---|---|
| pNDC/pPDC Plasmids | CRISPRi system for E. coli; inducible dCas9 and sgRNA expression. | Addgene #110049, #110051 |
| 5-Ph-IAA (5-phenyl-indole-3-acetic acid) | High-potency, cell-permeable auxin for AID systems; reduces off-target effects. | Tocris Bioscience (#5661) |
| dTAG-7 / dTAG-13 | Small-molecule degraders for the dTAG system; offer orthogonal control in engineered strains. | Cayman Chemical (#25375, #29905) |
| Anhydrotetracycline (aTc) | Inducer for Tet-regulated promoters (e.g., in CRISPRi). Low background, high dynamic range. | Sigma-Aldrich (#37919) |
| ClpP, Lon, FtsH Antibodies | Essential for validating protein depletion via Western blot in knockouts/degron experiments. | Available from lab repositories, Bio-Rad, or custom orders. |
| SsrA-Tag Plasmid | Expresses proteins with C-terminal AANDENYALAA (SsrA) tag for constitutive ClpXP targeting. | Addgene #15958 |
Visualized Workflows and Pathways
Title: Strategy Flow for Perturbing Essential Genes
Title: Auxin-Inducible Degron (AID) Mechanism
Title: Decision Tree for Method Selection
Challenges in Distinguishing Direct vs. Indirect Effects in Phenotypic Studies
Within the broader thesis on ATP-dependent chaperone-protease complexes in bacterial protein quality control (PQC), a central methodological challenge arises in phenotypic studies: definitively attributing an observed phenotype to the direct biochemical action of a chaperone-protease (e.g., ClpXP, ClpAP, Lon, FtsH) versus indirect, downstream consequences of its activity. This distinction is critical for elucidating mechanistic pathways, validating drug targets, and interpreting genetic screening data. Misassignment can lead to incorrect models of regulation and failed therapeutic strategies.
This technical guide outlines the core challenges, provides contemporary experimental frameworks to disentangle direct from indirect effects, and presents protocols and tools essential for researchers in bacterial PQC and antimicrobial drug development.
Core Conceptual Challenges
The activity of ATP-dependent proteases influences cellular physiology through layered networks:
- Direct Effects: Immediate consequences of substrate degradation or remodeling (e.g., clearance of a misfolded protein, processing of a transcription factor).
- Indirect Effects: Cascading phenotypic outcomes resulting from the direct effect (e.g., altered gene expression profile, metabolic shift, downstream stress response activation).
Key confounding factors include:
- Temporal Delay: Indirect effects manifest with a lag following the initial perturbation.
- Network Buffering: Cellular redundancy can mask direct effects, allowing only indirect phenotypes to become visible.
- Pleiotropy: A single degraded substrate can itself regulate multiple pathways.
- Secondary Stabilization: Inhibiting a protease can stabilize a direct substrate, which then inhibits another enzyme, creating a pseudo-direct phenotype.
Table 1: Representative Phenotypes in Bacterial PQC Studies and Their Potential Interpretations
| Phenotype Observed (e.g., in ΔclpX mutant) | Potential Direct Cause | Potential Indirect Cause | Key Distinguishing Experiment |
|---|---|---|---|
| Increased sensitivity to heat shock | Loss of degradation of specific misfolded proteins | Downregulation of general heat shock regulon (e.g., σ32 stability) | Pulse-chase & IP: Monitor degradation kinetics of known misfolded substrates vs. measure σ32 levels/activity. |
| Filamentation morphology | Failure to degrade division inhibitor (e.g., FtsZ regulator) | SOS response activation due to accumulated DNA damage | Microscopy & Reporter Fusions: Co-localize protease with division machinery; use recA-gfp reporter. |
| Antibiotic persistence | Stabilization of a toxin-antitoxin module substrate | Metabolic reprogramming from altered protease energy expenditure | Metabolomics & In Vitro Degradation: Compare metabolite profiles; demonstrate direct degradation of toxin in vitro. |
| Reduced virulence in infection models | Lack of degradation of a specific virulence regulator | General fitness defect from proteostatic collapse | Complementarity Test: Express a degradation-resistant variant of the regulator in mutant; if phenotype is not rescued, effect is likely indirect. |
Table 2: Key Metrics from Recent Studies on Distinguishing Effects
| Study Focus (Protease) | Primary Assay | Direct Effect Metric | Indirect Effect Metric | Temporal Resolution Achieved |
|---|---|---|---|---|
| Lon substrate discovery (2023) | TAILS-based N-terminomics | Identification of >50 native N-termini generated by Lon cleavage. | Bioinformatic enrichment of pathways from substrate list. | Snapshots at 0, 15, 60 min post-stress. |
| ClpXP spatial dynamics (2024) | Single-particle tracking PALM | Direct colocalization coefficient (DCC > 0.8) with putative substrate. | Correlation of protease diffusion coefficient with cell cycle stage. | ~25 ms localization precision. |
| FtsH role in membrane PQC (2023) | Fluorescence anisotropy decay | In vitro degradation rate (kdeg) of purified misfolded membrane protein. | In vivo quantification of membrane potential (Δψ) using DiOC2(3). | In vitro kdeg = 0.12 min-1. |
Experimental Protocols
Protocol: Rapid, Specific Protease Inactivation via Degron Tagging
Objective: To differentiate direct from indirect effects by comparing slow genetic deletion with acute protein depletion. Principle: A degron-tagged protease (e.g., ClpX-SsrA) is rapidly degraded upon induction of a cognate adaptor, enabling observation of immediate, direct phenotypes before secondary adaptations occur. Materials: See Scientist's Toolkit (Table 3). Procedure:
- Clone the gene for the ATPase (e.g., clpX) or protease subunit with a C-terminal SsrA degron tag into an expression vector. Transform into a strain expressing the SspB adaptor from a tightly regulated promoter (e.g., PBAD).
- Grow cells to mid-log phase (OD600 ~0.3-0.4) in conditions repressing SspB expression.
- Induce SspB expression with 0.2% arabinose. Withdraw samples at T = 0, 2, 5, 10, 20, 40, 60 minutes.
- Analyze samples by:
- Western Blot: Quantify degradation kinetics of the degron-tagged protease.
- Phenotypic Assays: At each time point, assay for the phenotype of interest (e.g., microscopy, plating on stress media). Direct effects will correlate tightly with protease loss.
- qRT-PCR: Monitor transcript levels of known regulated genes. Their change will lag behind protease depletion if they are indirect.
Protocol:In VitroReconstitution of Degradation & Phenotype Assay
Objective: To establish a causative link between protease activity and a biochemical output. Principle: Purified components are used to demonstrate that the protease alone is sufficient to produce a molecular outcome, ruling out cellular networks. Materials: See Scientist's Toolkit (Table 3). Procedure:
- Purify the chaperone-protease complex (e.g., ClpAP) and a candidate substrate (e.g., a transcription factor) via affinity chromatography.
- Set up a degradation reaction containing: 50 mM HEPES-KOH (pH 7.5), 100 mM KCl, 20 mM MgCl2, 5% glycerol, 5 mM ATP, an ATP-regenerating system (10 mM creatine phosphate, 0.1 mg/ml creatine kinase), 50 nM ClpAP, 200 nM substrate.
- Incubate at 30°C. Withdraw aliquots at intervals (0, 5, 15, 30, 60 min) and quench with SDS-PAGE loading buffer.
- Resolve samples by SDS-PAGE and quantify substrate remaining by densitometry.
- In parallel, assay the function of the substrate. For a transcription factor, perform in vitro transcription from its promoter. Add aliquots from the degradation reaction (or control reactions) to the transcription assay. Loss of transcription factor function must kinetically match its degradation.
Mandatory Visualizations
Title: Direct vs. Indirect Phenotypic Pathways from Protease Activity
Title: Decision Workflow for Distinguishing Direct from Indirect Effects
The Scientist's Toolkit
Table 3: Key Research Reagent Solutions for Phenotypic Deconvolution
| Reagent / Material | Function & Utility in Distinguishing Effects | Example Product/Strain (for illustration) |
|---|---|---|
| Tuner(DE3) E. coli cells | Allow precise control of IPTG induction levels, crucial for titrating expression of degron tags, substrate variants, or competing proteins to avoid overexpression artifacts. | Merck Millipore, Cat# 70623 |
| ssrA-degron tagging plasmids | Enable rapid, inducible degradation of a protein of interest in vivo (e.g., protease for acute depletion or substrate for bypass experiments). | Addgene, Plasmid #55245 (pJSB-DAS4) |
| CRISPRi bacterial systems | Enable transcriptional knockdown without genetic deletion, allowing partial inhibition to mimic drug treatment and study early, direct effects. | pCRISPRi-seq system (PMID: 31061481) |
| ATPγS (Adenosine 5′-O-[gamma-thio]triphosphate) | A poorly hydrolyzable ATP analog used in in vitro assays to trap chaperone-protease complexes with substrate, confirming direct binding. | Sigma-Aldrich, Cat# A1388 |
| Protease-Glo Assay Kit | A luminescent, homogeneous assay to measure protease activity directly in cell lysates, controlling for global activity changes post-perturbation. | Promega, Cat# G8591 |
| HaloTag technology | Allows specific, covalent labeling of substrates in vivo with fluorescent ligands for single-molecule tracking or pulse-chase degradation assays. | Promega, HaloTag pHTN Vector |
| Stable Isotope Labeling by Amino Acids (SILAC) media for bacteria | For quantitative proteomics to globally measure protein stability changes upon protease perturbation, identifying potential direct substrates. | Silantes, Heavy-labeled E. coli kits |
| Microfluidic mother machine devices | Enable long-term, single-cell tracking of phenotypes (e.g., morphology, fluorescent reporters) following controlled perturbations, defining phenotypic lag times. | CellASIC ONIX2 system |
Overcoming Off-Target Effects in Pharmacological Inhibition of PQC Systems
The Protein Quality Control (PQC) network, centered on ATP-dependent chaperones and proteases, is a critical therapeutic target in antibacterial research. In bacteria, systems like the Clp protease family (ClpXP, ClpCP), Lon, FtsH, and the GroEL/ES chaperonin complex are essential for cellular homeostasis, stress response, and virulence. Pharmacological inhibition of these systems represents a promising strategy to combat antibiotic-resistant pathogens. However, a central challenge in this pursuit is achieving selectivity for bacterial PQC components over structurally or functionally related human homologs (e.g., the proteasome, HSP90, mitochondrial proteases) to minimize cytotoxic off-target effects. This whitepaper provides a technical guide to strategies and methodologies for characterizing and mitigating these off-target effects, framed within the ongoing research on bacterial ATP-dependent chaperone-protease systems.
Off-target effects arise from several inherent properties of PQC systems:
- Structural Conservation: The ATPase domains and catalytic sites of AAA+ proteases and chaperones are evolutionarily conserved.
- Mechanistic Similarity: The fundamental mechanisms of substrate unfolding, translocation, and hydrolysis are shared across kingdoms.
- Inhibitor Promiscuity: Many early-stage inhibitors are ATP-competitive or reactive electrophiles, leading to cross-reactivity.
Table 1: Common Sources of Off-Target Effects in Bacterial PQC Inhibition
| Source of Off-Target | Example (Bacterial Target → Human Analog) | Consequence |
|---|---|---|
| ATP-binding site homology | ClpC ATPase → HSP90/CDC48 | Disruption of eukaryotic protein folding & degradation |
| Catalytic residue similarity | Active-site serine protease (Lon) → Proteasome β-subunits | General protease inhibition, cytotoxicity |
| Metal co-factor chelation | Zn²⁺-binding inhibitor of FtsH → Matrix metalloproteinases | Disruption of extracellular matrix remodeling |
| Hydrophobic pocket targeting | Substrate-docking site inhibitor → Disruption of other PPIs | Unintended interference with protein-protein interactions |
Experimental Strategies for Identifying Off-Targets
Proteome-Wide Profiling (Chemical Proteomics)
Protocol: Activity-Based Protein Profiling (ABPP) with Broad-Spectrum Probes
- Objective: To identify all reactive targets of an inhibitor across a proteome.
- Materials: Cell lysates (bacterial and human HEK293), inhibitor of interest, broad-spectrum activity-based probe (e.g., desthiobiotin-ATP for kinases/ATPases, fluorophosphonate for serine hydrolases), streptavidin beads, mass spectrometry (MS) setup.
- Procedure:
- Prepare lysates from target bacteria (e.g., S. aureus) and human control cells.
- Divide each lysate into three aliquots: pre-treated with DMSO (vehicle), the lead inhibitor, or a broad-spectrum positive control inhibitor.
- After 1 hr, label all samples with the appropriate activity-based probe (e.g., 1 µM, 1 hr).
- Enrich probe-labeled proteins using streptavidin beads, wash thoroughly.
- On-bead tryptic digest, elute peptides, and analyze by LC-MS/MS.
- Compare protein enrichment between DMSO and inhibitor-treated samples. Proteins with reduced probe labeling in the inhibitor-treated sample are direct or proximal targets.
- Data Interpretation: Significant reduction in labeling of non-target human ATPases or proteases indicates potential off-targets.
In-Cell Selectivity Screening
Protocol: Thermal Proteome Profiling (TPP)
- Objective: To monitor drug-induced thermal stability shifts across the entire soluble proteome in living cells.
- Materials: Bacterial and human cell cultures, inhibitor, cell lysis buffer, quantitative MS with tandem mass tags (TMT).
- Procedure:
- Treat live bacterial (M. tuberculosis) and human (A549) cells with inhibitor or DMSO for a physiologically relevant period (e.g., 2 hrs).
- Harvest cells, divide into aliquots, and heat each at different temperatures (e.g., 37°C to 67°C in 10 increments).
- Lyse cells, separate soluble fraction (centrifugation), and digest proteins.
- Label peptides from each temperature fraction with TMT reagents, pool, and analyze by LC-MS/MS.
- Generate melting curves for each protein. A shift in the melting curve temperature ((T_m)) upon inhibitor treatment indicates ligand engagement.
- Data Interpretation: Proteins showing a significant thermal shift ((\Delta T_m > 2°C)) in human cells but not the intended bacterial target are high-priority off-target candidates.
Diagram: Thermal Proteome Profiling Workflow
Quantitative Data on Selectivity Metrics
Table 2: Example Selectivity Profiling Data for a Putative ClpP Inhibitor 'ADEP-42'
| Assay Type | Target (Organism) | IC₅₀ / Kd (nM) | Off-Target (Organism) | IC₅₀ / Kd (nM) | Selectivity Index (SI) |
|---|---|---|---|---|---|
| Biochemical Activity | ClpP (S. aureus) | 25 | Human 20S Proteasome (β5 subunit) | >100,000 | >4,000 |
| ClpP (B. subtilis) | 40 | Human Lon Protease (Mitochondrial) | 5,000 | 125 | |
| Cellular Viability | S. aureus growth | 120 | HEK293 Cytotoxicity (MTT) | 15,000 | 125 |
| Binding Affinity (SPR) | ClpC ATPase (M. tuberculosis) | 180 | Human HSP90α | 2,200 | 12.2 |
| Proteomic Engagement (TPP) | Mtb ClpP1P2 | ΔTm +4.1°C | Human Cathepsin B | ΔTm +1.8°C | 2.3-fold ΔTm |
Rational Design Strategies to Minimize Off-Target Effects
- Exploiting Unique Structural Features: Design inhibitors targeting interface regions unique to bacterial complexes (e.g., the ClpP barrel lumen, which differs from the proteasome; or the ClpC N-terminal domain absent in eukaryotic AAA+ proteins).
- Species-Specific Allosteric Pockets: Utilize fragment-based screening and co-crystallography to identify pockets in bacterial targets not conserved in humans.
- Prodrug Strategies: Design compounds activated specifically by bacterial enzymes (e.g., β-lactamases, nitroreductases) present in the pathogen's environment.
Diagram: Rational Design Logic for Selective PQC Inhibitors
Validation and Counter-Screening Assays
A multi-tiered validation cascade is essential.
Table 3: Essential Validation Assay Cascade
| Tier | Assay Name | Purpose | Key Control |
|---|---|---|---|
| Primary | Target-Specific Biochemical Assay (e.g., Fluorescent peptide cleavage for ClpP) | Confirm on-mechanism activity. | Use recombinant human off-target homolog. |
| Secondary | Bacterial Phenotypic Assays (MIC, Time-Kill, Persister killing) | Establish cellular efficacy. | Isogenic bacterial strain with target deletion. |
| Counter-Screen 1 | Human Cytotoxicity (MTT, ATP-lite) in multiple cell lines | Assess general toxicity. | Include positive control cytotoxin. |
| Counter-Screen 2 | Panel of Human Enzyme Assays (Proteasome, HSP90, Kinases) | Identify specific off-targets. | Use established inhibitors as controls. |
| Tertiary | In Vitro Safety Panels (hERG, CYP450 inhibition) | Early ADMET profiling. | Reference compounds with known profiles. |
Protocol: Counter-Screen: Human 20S Proteasome Activity Assay
- Objective: To rule out inhibition of the human constitutive proteasome.
- Materials: Purified human 20S proteasome, proteasome-Glo assay buffer, suc-LLVY-aminoluciferin substrate, inhibitor, positive control (MG-132).
- Procedure:
- Dilute human 20S proteasome to 0.5 nM in assay buffer.
- Pre-incubate proteasome with inhibitor (across a dose range, e.g., 1 nM – 100 µM) or controls for 15 min at 37°C.
- Add the suc-LLVY-aminoluciferin substrate (final concentration per mfr. instructions) to initiate reaction.
- Measure luminescence after 30 min. Luminescence is proportional to chymotrypsin-like (β5) activity.
- Calculate % activity relative to DMSO control and determine IC₅₀.
The Scientist's Toolkit: Research Reagent Solutions
Table 4: Essential Reagents for Off-Target Profiling in PQC Inhibition Studies
| Reagent / Material | Supplier Examples | Function in Research |
|---|---|---|
| Recombinant Human 20S Proteasome | Merck, Bio-Techne | Primary counter-screen target to assess selectivity over bacterial proteases. |
| Recombinant Human HSP90α/β | Enzo, StressMarq | Critical for testing ATP-competitive inhibitors targeting bacterial AAA+ chaperones. |
| Activity-Based Probe: Desthiobiotin-ATP | Thermo Fisher, Cayman Chemical | For chemical proteomics (ABPP) to identify ATPase/kinase off-targets. |
| Tandem Mass Tag (TMT) 16-plex Kit | Thermo Fisher | For multiplexed quantitative proteomics in Thermal Proteome Profiling (TPP). |
| Proteasome-Glo Assay Kit | Promega | Homogeneous, luminescent assay for high-throughput screening of human proteasome off-target inhibition. |
| ClpP (from S. aureus or M. tuberculosis) | In-house purification or specialized vendors (e.g., Proteos) | Essential positive control target for primary biochemical assays. |
| HEK293 & A549 Cell Lines | ATCC | Standard human cell lines for cytotoxicity and cellular off-target profiling (e.g., TPP). |
| Pan-Kinase Assay Kit (e.g., ScanMAX) | Eurofins DiscoverX | Broad panel screening to identify off-target kinase inhibition, a common liability. |
Best Practices for Data Reproducibility in Complex Biochemical Reconstitutions
The study of ATP-dependent chaperone-protease systems, such as ClpXP, ClpAP, and Lon, is central to understanding bacterial protein quality control (PQC). These complexes execute critical functions: refolding misfolded proteins, degrading irreparably damaged substrates, and regulating cellular processes. In vitro reconstitution of these multi-component systems is essential for dissecting their mechanistic details. However, the complexity—involving multiple proteins, co-factors (ATP), and often unstable substrates—poses significant challenges for experimental reproducibility. This guide outlines best practices to ensure robust and reproducible data generation in this specific field, forming a reliable foundation for downstream drug discovery targeting bacterial PQC systems.
Foundational Principles for Reproducibility
Reagent Standardization: Variability in protein purifications, nucleotide batches, and buffer components is the primary source of irreproducibility. Metadata Documentation: Every experiment must be accompanied by exhaustive metadata detailing reagent origins, preparation dates, storage conditions, and instrument calibration status. Experimental Controls: Each assay must include internal controls for enzyme activity, substrate integrity, and buffer effects.
Detailed Experimental Protocols for Key PQC Assays
Protocol: ATP-Dependent Protease Degradation Assay
Objective: To quantify the degradation kinetics of a fluorescein-labeled protein substrate (e.g., casein- or SsrA-tagged GFP) by a chaperone-protease complex (e.g., ClpXP).
Materials:
- Purified protease complex (e.g., ClpX hexamer, ClpP14-mer).
- Fluorescent substrate (e.g., FITC-casein).
- ATP-regeneration system (ATP, Creatine Phosphate, Creatine Kinase).
- Reaction Buffer: 25 mM HEPES-KOH (pH 7.5), 100 mM KCl, 10 mM MgCl2, 0.05% Tween-20, 1 mM DTT.
Method:
- Master Mix Preparation: Prepare a master mix containing reaction buffer, ATP (4 mM), and the ATP-regeneration system. Keep on ice.
- Complex Assembly: Pre-incubate ClpX and ClpP (typically at a 1:2 hexamer:tetradecamer molar ratio) in master mix for 5 minutes at 25°C.
- Reaction Initiation: In a black 96-well plate, mix complex with substrate (e.g., 100 nM complex, 500 nM substrate final concentration). Final volume: 50 µL.
- Kinetic Measurement: Immediately transfer plate to a pre-warmed (30°C) plate reader. Monitor fluorescence (ex: 485 nm, em: 520 nm) every 30 seconds for 60 minutes.
- Controls: Include wells lacking ATP (ATP→AMP-PNP), lacking enzyme, and lacking substrate.
Data Analysis: Normalize fluorescence to the initial value. Fit the decrease to a single-exponential decay or a linear model to obtain degradation rates (k_obs).
Protocol: Chaperone-Mediated Substrate Unfolding/Translocation Assay
Objective: To monitor ATP-dependent unfolding of a tagged substrate protein (e.g., ClpX acting on a folded domain with a C-terminal SsrA tag).
Materials:
- Purified chaperone (e.g., ClpX hexamer).
- Substrate protein with a fluorophore-quencher pair or a folded domain that releases fluorescence upon unfolding.
- ATP/Mg²⁺ solution.
- Note: This assay often uses a variant of GFP that is quenched when folded in the context of the full substrate but fluoresces upon unfolding/degradation.
Method:
- In assay buffer, mix 100 nM chaperone (ClpX) with 200 nM substrate.
- Initiate reaction by adding ATP to 5 mM final concentration.
- Monitor fluorescence increase over time (indicative of unfolding).
- Critical Control: Use a hydrolysis-deficient chaperone mutant (e.g., ClpX-E185Q) to establish ATP-dependence.
Research Reagent Solutions Toolkit
| Reagent / Material | Function in PQC Reconstitution | Critical Specification for Reproducibility |
|---|---|---|
| Recombinant Proteins (ClpX, ClpP, Lon, substrates) | Core enzymatic and substrate components. | Document expression strain, purification tags, final buffer, concentration method, aliquot size, freeze-thaw cycles. Store at -80°C in single-use aliquots. |
| Nucleotides (ATP, ADP, ATPγS) | Energy source and allosteric regulator. | Use high-purity (>99%) salts from a reliable supplier. Aliquot, pH adjust (ATP to pH 7.0 with NaOH), store at -80°C. Avoid repeated freeze-thaw. |
| ATP-Regeneration System (Creatine Phosphate/Creatine Kinase) | Maintains constant [ATP] during long assays. | Titrate to ensure linear kinetics for the assay duration. Include a control without regeneration to observe slowdown. |
| Protease Inhibitors (e.g., PMSF, Protease Inhibitor Cocktails) | Prevent proteolysis during protein purification. | Avoid carryover into final assay buffers, as they may inhibit the reconstituted system under study. |
| Fluorescent Tags/Labels (FITC, GFP-variants, quenching pairs) | Enable real-time kinetic measurement of degradation/unfolding. | Consistent labeling ratio and site-specificity are crucial. Characterize degree of labeling (DoL) for each batch. |
| Standardized Assay Buffer | Provides consistent ionic strength, pH, and reducing environment. | Prepare large master batches, filter, aliquot. Verify pH at assay temperature. Include a non-ionic detergent (e.g., Tween-20) to prevent adsorption. |
The following table summarizes key parameters and expected outcomes from a standard ClpXP degradation assay, serving as a benchmark for reproducibility.
| Parameter | Typical Value / Range | Impact on Reproducibility | Acceptable Batch-to-Batch Variance |
|---|---|---|---|
| ClpX Specific Activity | 0.5 - 2.0 min⁻¹ (k_cat for SsrA-GFP degradation) | Defines baseline reaction speed. Must be characterized for each prep. | < ±20% from lab historical average. |
| ClpP Activation by ClpX | 10-100 fold increase in degradation rate over ClpP alone. | Confirms functional complex formation. | Yes/No outcome; must be observed. |
| ATPase Activity (ClpX alone) | 50-200 ATP/min/hexamer | Indicator of chaperone structural integrity. | < ±25% from established standard. |
| Km for ATP (ClpXP) | 50 - 200 µM | Informs appropriate [ATP] in assays (use 4-5x Km). | < ±30% shift. |
| Substrate Degradation Half-time (t₁/₂) | 5 - 20 minutes (for 100 nM ClpXP, 500 nM substrate) | Primary assay readout. | < ±15% between replicates on same day; < ±25% across different days with same reagents. |
| Lag Phase Duration | 0 - 60 seconds | Can indicate slow assembly or substrate remodeling. | Trend should be consistent. |
Visualizing Workflows and Pathways
Achieving reproducibility in complex biochemical reconstitutions of bacterial PQC systems is non-negotiable for mechanistic insight and translational potential. It requires a meticulous, holistic strategy encompassing standardized reagent preparation, rigorously documented protocols, comprehensive internal controls, and systematic data presentation. Adherence to the practices outlined here will generate reliable, comparable, and trustworthy data, accelerating our understanding of chaperone-protease mechanisms and informing the development of novel antibacterial strategies targeting these essential systems.
Validation and Evolution: Comparative PQC Across Bacterial Species and Kingdoms
Within the broader thesis on ATP-dependent chaperone proteases in bacterial protein quality control (PQC), the selection of a model organism is a critical strategic decision. This guide provides a technical comparison of the classical models (Escherichia coli, Bacillus subtilis) with the medically relevant but more complex systems (mycobacteria and pathogenic Gram-negatives like Pseudomonas aeruginosa). The core PQC machinery centers on conserved, essential ATP-dependent complexes—Lon, Clp proteases (ClpAP, ClpCP, ClpXP), FtsH, and the GroEL/ES and DnaK/J/GrpE chaperone systems. Their regulation, substrate specificity, and essentiality vary dramatically, influencing their utility for fundamental discovery versus translational drug development.
Core PQC Machinery: A Quantitative Comparison
Table 1: Key ATP-Dependent Chaperone Proteases Across Model Systems
| Organism / Complex | Gene(s) | Essential? | Key Known Substrates (Validated) | Preferred Recognition Signal | Notable Inhibitors/Activators |
|---|---|---|---|---|---|
| E. coli | |||||
| ClpXP | clpX, clpP | No (but severe defects) | SsrA-tagged proteins, RpoH, RpoS | SsrA tag (AANDENYALAA) | ADEP antibiotics (activates ClpP) |
| ClpAP | clpA, clpP | No | SsrA-tagged proteins, ClpS adaptor substrates | SsrA tag, N-degrons via ClpS | |
| Lon | lon | No | SulA, RcsA, σ^S^ | Exposed hydrophobic degrons | Not characterized |
| FtsH | ftsH | Yes | SecY, YccA, σ^32^ | Cytoplasmic/DM degrons (TMs) | Not characterized |
| B. subtilis | |||||
| ClpCP | clpC, clpP | Yes (ClpC) | MecA, ComK, Spx | MecA adaptor delivers substrates | ADEPs, Cyclomarin A |
| ClpEP | clpE, clpP | No | Unknown, heat shock induced | Poorly defined | |
| Lon | lon | No | ? | ||
| FtsH | ftsH | Yes | |||
| Mycobacteria (Mtb) | |||||
| ClpP1P2 | clpP1, clpP2 | Yes (both) | Pup-tagged proteins (via Mpa/ClpC1) | Pupylation (Pup-Protein) | ADEPs, Bortezomib derivatives |
| ClpC1 | clpC1 | Yes | Mpa adaptor for Pup-substrates | Interacts with Mpa | Cyclomarin A, Ecumicin |
| Lon | lon | No? | |||
| FtsH | ftsH | Likely yes | |||
| P. aeruginosa | |||||
| ClpXP | clpX, clpP | No (ClpP) | MucA, antitoxins | SsrA-like? | ADEPs |
| Lon | lon | Yes | Toxin-antitoxin modules, transcriptional regulators | ||
| HslUV | hslU, hslV | No | Heat-denatured proteins | ||
| FtsH | ftsH | Likely yes |
Table 2: Experimental Tractability and Genetic Tools
| Feature | E. coli | B. subtilis | Mycobacteria (Mtb/Msmeg) | Pathogenic Gram-Negatives (P. aeruginosa) |
|---|---|---|---|---|
| Generation Time | ~20 min | ~30 min | ~20h (Mtb), ~3h (Msmeg) | ~30 min |
| Genetic Tools | Extensive, recombineering, CRISPRi | Natural competence, integrative plasmids | Specialized vectors, mycobacteriophages, CRISPRi | Well-developed, allelic exchange, transposons |
| Conditional Knockout | Tight (pBAD, Tet), Degron tags | IPTG-inducible promoters, temperature-sensitive | Tet-On/Off, Pip-inducible, CRISPRi | Arabinose-inducible, Tet systems |
| In Vitro Reconstitution | Full systems commercially available | Feasible, less common | Pup-proteasome system reconstituted | Feasible for Lon, ClpXP |
| PQC-Specific Tags | SsrA, N/C-degrons well-defined | MecA adaptor system | Pup-tagging system defined | Less standardized |
Experimental Protocols for Key PQC Assays
Protocol: In Vitro Degradation Assay (Fluorescence-Based)
Purpose: To measure ATP-dependent degradation of a tagged substrate by a purified chaperone-protease complex. Reagents: See Scientist's Toolkit. Method:
- Substrate Preparation: Express and purify a model substrate (e.g., GFP-SsrA) using Ni-NTA chromatography.
- Enzyme Purification: Purify the hexameric ATPase (ClpX, ClpC, etc.) and the tetradecameric protease (ClpP) via affinity tags and size-exclusion chromatography.
- Assay Setup: In a 96-well plate, mix in assay buffer (50 mM HEPES-KOH pH 7.5, 150 mM KCl, 20 mM MgCl2, 1 mM DTT):
- 0.5 µM chaperone-protease complex (e.g., ClpXP)
- 2 µM substrate (GFP-SsrA)
- 5 mM ATP (or ATPγS for control)
- Regeneration system (10 mM creatine phosphate, 0.1 mg/mL creatine kinase).
- Measurement: Monitor fluorescence (Ex 485 nm, Em 520 nm) kinetically in a plate reader at 30-37°C for 60-90 min. Loss of GFP fluorescence indicates degradation. Include controls without ATP, without enzyme, and with a protease inhibitor (e.g., MG-132 for ClpP).
- Analysis: Fit fluorescence decay curves to a single-exponential model to obtain degradation rate constants (kobs).
Protocol: In Vivo Protein Stability Pulse-Chase (Mycobacteria)
Purpose: To measure half-life of a native or tagged protein in its native host. Method:
- Strain Construction: Generate a strain expressing the protein of interest (POI) with a C-terminal 3xFLAG tag from its native locus or an integrated plasmid.
- Pulse: Grow culture to mid-log phase (OD600 ~0.6). Induce expression if necessary. Add 0.1 mCi/mL of ^35^S-methionine/cysteine for 5-10 minutes.
- Chase: Quickly pellet cells and resuspend in chase media (rich media + 10 mM unlabeled methionine + 1 mg/mL casamino acids).
- Sampling: Take 1 mL aliquots at time points (e.g., 0, 15, 30, 60, 120 min). Pellet immediately and freeze.
- Lysis & Immunoprecipitation: Lyse pellets in RIPA buffer with protease inhibitors. Immunoprecipitate the POI using anti-FLAG M2 magnetic beads.
- Analysis: Resolve immunoprecipitates by SDS-PAGE, dry gel, and expose to a phosphorimager. Quantify band intensity to determine half-life.
Protocol: Determining Essentiality via CRISPRi Knockdown
Purpose: To assess essentiality of a PQC gene in a slow-growing or pathogenic bacterium. Method:
- CRISPRi Strain: Use a strain harboring an integrated, inducible dCas9 (e.g., under anhydrotetracycline (ATc) control).
- sgRNA Design: Design sgRNAs targeting the 5' region of the gene of interest (GOI). Clone into a replicating or integrating vector.
- Growth Curves: Inoculate strains ± ATc induction in 96-well plates. Monitor OD600 every 30-60 min in a plate reader for 3-5 generations.
- Phenotypic Analysis: Compare growth rates. Essential genes show severe growth defect upon ATc addition. Include non-targeting sgRNA control.
- Western Blot Validation: Confirm knockdown of the target protein via Western blot from parallel cultures.
Signaling and Workflow Diagrams
Diagram Title: Stress-Induced PQC Signaling Pathways in Different Bacteria
Diagram Title: Decision Workflow for PQC Research Projects
The Scientist's Toolkit: Essential Research Reagents
Table 3: Key Research Reagent Solutions
| Reagent / Material | Supplier Examples | Function in PQC Research | Organism Specificity |
|---|---|---|---|
| Purified E. coli ClpXP/Lon | Addgene, Enzo Life Sciences | Positive control for in vitro degradation assays; benchmark kinetics. | Primarily E. coli, often cross-reactive |
| SsrA-tagged GFP/SulA | In-house expression, some core facilities | Universal, well-characterized fluorescent substrate for ClpXP/AP and Lon. | Broad utility, works in E. coli, B. subtilis, etc. |
| ADEP1 (Acyldepsipeptide) | Sigma-Aldrich, Tocris | Allosteric activator of ClpP, causing dysregulated proteolysis. Used in mechanistic and antibiotic studies. | Broad-spectrum (B. subtilis, Mtb, E. coli) |
| MG-132 / Bortezomib | Cayman Chemical, Selleckchem | Peptide-based proteasome/ClpP inhibitor. Control for inhibition in assays. | Mtb ClpP1P2, some Gram+ ClpPs |
| Anti-Pup / Anti-Mpa Antibodies | BEI Resources, in-house | Detect pupylation and the mycobacterial proteasome accessory factor in Western blot/pull-down. | Mycobacteria specific |
| Pupylation Kit (PafA, Dop) | In-house purification | Enzymatic system to conjugate Pup to target proteins for in vitro degradation assays. | Mycobacteria specific |
| Tet/Zeo/Arabinose-Inducible Vectors | Addgene, BEI Resources (Mtb), labs | For conditional gene expression or knockdown in the organism of choice. | Vectors are species-specific |
| CRISPRi/dCas9 Systems | Deposited plasmids (Addgene) | For targeted gene knockdown in non-essentiality tests and phenotypic screens. | Available for E. coli, B. subtilis, Mtb, Pa |
| ^35^S-Methionine/Cysteine | PerkinElmer | Radiolabel for pulse-chase experiments to measure protein half-life in vivo. | Universal |
| ATPγS (ATP analog) | Jena Bioscience, Sigma | Non-hydrolyzable ATP analog for negative control in ATP-dependent degradation assays. | Universal |
Within the broader research thesis on ATP-dependent chaperones and proteases in bacterial Protein Quality Control (PQC), a central challenge is validating the essentiality of specific genes and their encoded proteins. Essentiality is not a binary trait but a conditional property dependent on genetic background and environment. This whitepaper provides a technical guide for rigorously correlating genetic data (e.g., from gene knockouts or CRISPR screens) with biochemical function across different bacterial species to define core, indispensable components of the PQC machinery, such as Clp protease systems, GroEL/ES, and DnaK/DnaJ.
Core Concepts and Quantitative Benchmarks
The essentiality of PQC components varies significantly across bacterial species, influenced by genomic redundancy, environmental niche, and metabolic complexity.
Table 1: Essentiality and Functional Parameters of Key ATP-Dependent PQC Components Across Model Bacteria
| Protein Complex | E. coli (Essential?) | B. subtilis (Essential?) | M. tuberculosis (Essential?) | Primary Biochemical Function | Typical Cellular Abundance (molecules/cell) |
|---|---|---|---|---|---|
| ClpP Protease | Non-essential* | Essential | Essential | Serine protease core | ~200-500 (E. coli) |
| ClpX ATPase | Non-essential | Essential | Conditionally Essential | AAA+ unfoldase/translocase | ~100-300 (E. coli) |
| ClpA ATPase | Non-essential | Non-essential | Not Present | AAA+ unfoldase/translocase | ~50-100 (E. coli) |
| GroEL/ES | Essential | Essential | Essential | Chaperonin folding cage | ~1000-2000 (E. coli) |
| DnaK/DnaJ/GrpE | Essential | Essential | Essential | Hsp70 chaperone system | ~20000-30000 (E. coli) |
| Lon Protease | Non-essential | Non-essential | Essential | AAA+ protease | ~50-150 (E. coli) |
Note: ClpP is non-essential in E. coli under standard lab conditions due to redundancy with Lon and other proteases, but becomes essential under certain stresses.
Experimental Protocols for Validating Essentiality
Protocol 3.1: Conditional Knockout with Cross-Species Complementation
Objective: To test if a homologous gene from Species B can rescue the lethal phenotype of a knockout in Species A, validating functional conservation.
- Strain Construction: Generate a conditional knockout (e.g., using a repressible promoter) of the target PQC gene (e.g., clpX) in Species A.
- Plasmid Design: Clone the orthologous gene from Species B into an expression vector compatible with Species A. Include a controllable promoter and a fluorescent reporter (e.g., GFP) in a separate operon for tracking.
- Rescue Assay: Transform the plasmid into the conditional knockout strain of Species A. Plate transformants on media permissive (promoter ON) and non-permissive (promoter OFF) for the native gene's expression.
- Phenotypic Scoring: Compare growth kinetics, morphology, and stress survival (e.g., heat shock) of the rescued strain vs. wild-type and empty-vector controls.
- Biochemical Validation: Perform anti-aggregation assays or degradation assays (using a model substrate like GFP-ssrA) on cell lysates to confirm restored biochemical activity.
Protocol 3.2: High-Throughput Genetic Interaction Mapping (e.g., CRISPRi)
Objective: To identify synthetic lethal/sick interactions revealing functional redundancy and alternative pathways.
- Library Design: Design a CRISPRi sgRNA library targeting the entire genome or a subset of chaperone/protease genes.
- Dual-Knockdown Screen: In a strain harboring a titratable knockdown of a target PQC gene (e.g., clpP), transduce the CRISPRi library. Use two conditions: permissive (low knockdown) and non-permissive (high knockdown) for the target.
- Sequencing & Analysis: After 15-20 generations, harvest genomic DNA, amplify sgRNA barcodes, and perform deep sequencing. Identify sgRNAs depleted specifically under the non-permissive condition using statistical packages (e.g., MAGeCK).
- Hit Validation: Candidate synthetic lethal genes are validated using individual knockdowns and targeted biochemical assays (e.g., measuring protein aggregate load via fluorescence microscopy).
Protocol 3.3: In Vitro Reconstitution with Orthologous Components
Objective: To directly compare the biochemical activity of purified PQC components from different species.
- Protein Purification: Express and purify the orthologous protein complexes (e.g., ClpX and ClpP from E. coli and M. tuberculosis) using affinity (His-tag) and size-exclusion chromatography.
- ATPase Activity Assay: Perform a coupled enzymatic assay (measuring NADH oxidation) to determine basal and substrate-stimulated ATP hydrolysis rates for each ortholog. Use 2-4 mM ATP, 37°C, and monitor for 30 minutes.
- Degradation Assay: Use a fluorescent model substrate (e.g., casein-FITC). Combine orthologous components (e.g., Mtb ClpX1P1 vs. Ec ClpXP). Monitor degradation by increase in fluorescence (ex/em 495/515 nm) over 60 minutes in reaction buffer (25 mM HEPES-KOH pH 7.5, 100 mM KCl, 10 mM MgCl2, 5% glycerol, 1 mM DTT).
- Data Analysis: Calculate kinetic parameters (Km, Vmax) and compare complex formation efficiency via native PAGE or analytical ultracentrifugation.
Diagram 1: Essentiality Validation Workflow (100 chars)
Key Research Reagent Solutions
Table 2: Essential Toolkit for PQC Essentiality Research
| Reagent/Material | Supplier Examples | Key Function in Experiments |
|---|---|---|
| pCAS9/crRNA Plasmids (for CRISPR-Cas9 knockouts) | Addgene, in-house assembly | Enables precise, scarless gene deletion in diverse bacterial species. |
| dCas9 Expression Vectors (for CRISPRi) | Addgene (e.g., pPD-dCas9) | Facilitates tunable transcriptional repression for essential gene knockdown and synthetic lethality screens. |
| Tunable Arabinose/Promoter Systems (pBAD, PxyIR) | Invitrogen, Takara Bio | Allows conditional, titratable expression of genes for rescue experiments and conditional knockout studies. |
| Fluorescent Model Substrates (GFP-ssrA, FITC-casein) | In-house expression/purification; Sigma-Aldrich (FITC-casein) | Serve as universal, quantifiable degradation substrates for in vitro and in vivo protease activity assays. |
| ATP Regeneration System (Pyruvate Kinase/Phosphoenolpyruvate) | Sigma-Aldrich, Roche | Maintains constant [ATP] in long-duration in vitro biochemical assays (e.g., degradation, chaperone cycling). |
| Native Protein Standards & SEC Columns (e.g., Superose 6 Increase) | Cytiva, Bio-Rad | For analyzing oligomeric state and complex assembly of chaperones/proteases via size-exclusion chromatography. |
| Hsp-Specific Inhibitors (e.g., ADEPs for ClpP, Geldanamycin for Hsp90) | Tocris Bioscience, Merck Millipore | Chemical probes to phenocopy genetic perturbations and validate target engagement in drug discovery. |
| Cross-Linking Reagents (BS3, DSS) | Thermo Fisher Scientific | For trapping transient interactions between chaperones, proteases, and substrate proteins for structural analysis. |
Data Integration and Cross-Species Correlation
Integrating data types is crucial for robust essentiality calls.
Table 3: Multi-Omics Data Integration for Essentiality Validation
| Data Type | Experimental Method | How it Informs Essentiality | Correlative Analysis |
|---|---|---|---|
| Genomic | Tn-Seq, CRISPR-Cas9 screens | Identifies genes required for growth under defined conditions. | Correlate with phylogenetic conservation. |
| Transcriptomic | RNA-Seq upon knockdown | Reveals compensatory pathway upregulation and stress responses. | Network analysis to identify dysregulated modules. |
| Proteomic | Mass Spec (SILAC/TMT) upon perturbation | Quantifies changes in client protein abundance and aggregation state. | Define substrate repertoire of the PQC component. |
| Metabolomic | LC-MS/MS upon knockout | Identifies metabolic vulnerabilities or toxic accumulations. | Link PQC function to metabolic network integrity. |
Diagram 2: Data Correlation Logic Flow (94 chars)
Validating essentiality in bacterial PQC requires a multi-pronged approach that tightly couples genetic perturbation data with quantitative biochemical assays across species. The protocols and frameworks outlined here provide a roadmap for distinguishing between core, universally essential functions and conditionally essential or redundant ones. This is particularly critical for targeting ATP-dependent chaperones and proteases in pathogenic bacteria, where essentiality validation is the first step in prioritizing drug targets. Future directions include single-cell essentiality profiling and integrating structural predictions (AlphaFold2) to understand sequence-structure-function relationships governing essentiality.
ATP-dependent chaperone-protease systems are central to protein quality control (PQC) in all cells. These molecular machines, often AAA+ (ATPases Associated with diverse cellular Activities) proteins, recognize, unfold, and degrade misfolded or aggregated proteins. This whitepaper examines the core structural and functional elements of bacterial AAA+ PQC systems (e.g., ClpXP, Lon, FtsH) and their evolutionary descendants in eukaryotic organelles—mitochondria (m-AAA, i-AAA, LonP) and chloroplasts (ClpCP, FtsH). Within the broader thesis of bacterial PQC research, understanding this conservation and divergence is critical for elucidating fundamental proteostatic mechanisms and for developing novel antimicrobials that selectively target bacterial systems.
Core Structural Architecture: A Conserved Framework
The AAA+ Module
The AAA+ module is a conserved α/β nucleotide-binding domain followed by a helical subdomain. Bacterial and organellar systems share this core fold but exhibit key variations in oligomeric state, sensor motifs, and accessory domains.
Oligomeric Organization
AAA+ proteins assemble into functional hexameric rings, providing the central pore for substrate unfolding and translocation. The table below compares the oligomeric states and domain organizations.
Table 1: Structural Composition of Key AAA+ PQC Systems
| System (Origin) | Example Protein | Oligomeric State | Core AAA+ Domains per Protomer | Specialized Domains | PDB ID (Example) |
|---|---|---|---|---|---|
| Bacterial | ClpX | Hexamer | 1 Large AAA+ domain (NBD, SSD) | N-terminal Zinc-Binding Domain (ZBD) | 3HWS |
| Bacterial | Lon Protease | Hexamer | 1 AAA+ domain | Protease domain (Ser-Lys dyad) | 6Q7N |
| Bacterial | FtsH | Hexamer | 1 AAA+ domain | Zn²⁺-metalloprotease domain | 2CE7 |
| Mitochondrial | m-AAA (AFG3L2) | Hexamer (homo-/hetero-) | 2 AAA+ domains (D1, D2) | M41 protease domain, RING-finger-like domain | 6X2J |
| Mitochondrial | i-AAA (YME1L) | Hexamer | 1 AAA+ domain | Zn²⁺-metalloprotease domain | N/A |
| Chloroplastic | ClpC1 | Hexamer | 2 AAA+ domains (D1, D2) | N-terminal domain, Middle domain | 6QZ5 |
The Protease Component
In compartmentalized systems (ClpXP, ClpCP), the AAA+ unfoldase docks onto a separate peptidase chamber (ClpP). Bacterial and organellar ClpP rings are structurally homologous heptamers but differ in activation mechanisms. Intrinsic proteases (Lon, FtsH) integrate AAA+ and proteolytic functions within a single polypeptide.
Functional Mechanisms: Conservation and Specialization
Substrate Recognition
Conserved mechanisms include:
- N-degron or C-degron recognition via specific adaptor proteins (e.g., SspB for ClpX, Nrf1 for mitochondrial Lon).
- Recognition of specific peptide tags (e.g., ssrA tag in bacteria).
- Direct recognition of unfolded domains.
Divergence is evident in organellar systems, which have evolved unique adaptors to handle organelle-specific substrates (e.g., oxidized proteins, components of electron transport chains).
ATP-Driven Unfolding and Translocation
The conserved "power-stroke" mechanism involves coordinated ATP hydrolysis around the ring, driving conformational changes in pore-loop residues (e.g., aromatic-hydrophobic motifs) that engage and mechanically pull substrates through the central pore.
Regulatory Control
Bacterial systems are often regulated by stress-responsive transcription factors (e.g., σ³² for E. coli Lon) or anti-adaptor proteins. Organellar systems are regulated by complex import machinery, redox status (via disulfide bonds in chloroplast ClpC1), and nuclear-encoded factors, linking PQC to organismal physiology.
Table 2: Quantitative Functional Parameters
| Parameter | Bacterial ClpXP (E. coli) | Mitochondrial m-AAA (Yeast) | Chloroplast ClpCP (A. thaliana) |
|---|---|---|---|
| ATP Hydrolysis Rate | ~180 min⁻¹ (per hexamer) | ~120 min⁻¹ (per hexamer) | ~60 min⁻¹ (per hexamer)* |
| Unfolding Force | ~20 pN (estimated) | Data Limited | Data Limited |
| Processivity | High (>90% completion) | High | Moderate |
| Typical Substrate Size | 10-40 kDa | 20-150 kDa (membrane proteins) | 30-100 kDa (stromal proteins) |
| Key Regulator | SspB (adaptor) | Mdm38 (adaptor-like) | ClpS1 (adaptor/inhibitor) |
*Note: Rate influenced by redox state.
Experimental Protocols for Comparative Analysis
Protocol: ATPase Activity Assay (Colorimetric)
Objective: Quantify and compare basal and substrate-stimulated ATPase rates.
- Purify AAA+ proteins (bacterial ClpX, mitochondrial AFG3L2) via affinity and size-exclusion chromatography.
- Prepare Reaction Mix: 1 µM AAA+ hexamer, 2 mM ATP, 5 mM MgCl₂, 25 mM Tris-HCl (pH 7.5), 150 mM KCl. Include +/- 10 µM model substrate (e.g., casein or ssrA-tagged GFP).
- Incubate at 30°C/37°C (bacterial) or 32°C (yeast mitochondrial) for 0, 5, 10, 15, 20 minutes.
- Stop Reaction with 1% (w/v) SDS.
- Detect Inorganic Phosphate (Pi): Add BIOMOL GREEN reagent (Invitrogen), incubate 20 min, measure A620nm.
- Calculate Rate: Plot Pi vs. time, derive linear rate (nmol/min/µg). Subtract basal rate to determine substrate-stimulated activity.
Protocol: Single-Molecule Unfolding/Translocation Assay
Objective: Visualize real-time substrate processing.
- Label Substrate: Engineer a model substrate (e.g., titin I27 domain) with an N-terminal ssrA tag and a C-terminal fluorophore (Cy5). Attach to a microscope slide via a biotin-streptavidin linkage on the N-terminus.
- Flow in AAA+ System: Introduce reaction buffer containing 1 nM AAA+ hexamer (e.g., ClpX), 2 mM ATP, and an oxygen-scavenging system for imaging.
- Imaging: Use TIRF microscopy to monitor Cy5 fluorescence. Translocation/unfolding is observed as a stepwise disappearance of fluorescence as the protein is pulled into the proteolytic complex.
- Analysis: Measure dwell times and step sizes to compare processivity and power strokes between systems.
Visualizing AAA+ System Function and Experimental Workflow
Diagram 1: AAA+ Functional Cycle & Analysis Workflow
The Scientist's Toolkit: Key Research Reagent Solutions
Table 3: Essential Reagents for AAA+ PQC Research
| Reagent / Material | Supplier Examples | Function in Research |
|---|---|---|
| Recombinant AAA+ Proteins (Bacterial ClpX, Mitochondrial LonP) | In-house expression; commercial (Novoprotein, Sino Biological) | Substrate for biochemical assays, structural studies, and inhibitor screening. |
| Fluorogenic Peptide Substrates (e.g., Suc-LLVY-AMC) | Bachem, Enzo Life Sciences | High-throughput measurement of protease chamber activity. |
| BIOMOL GREEN Reagent | Enzo Life Sciences | Colorimetric, malachite green-based detection of inorganic phosphate for ATPase assays. |
| ssrA-tagged Model Substrates (e.g., GFP-ssrA, FITC-casein) | In-house expression; Cytoskeleton, Inc. | Standardized, easily tracked substrates for unfolding and degradation assays. |
| ATPγS (ATP analog) | Sigma-Aldrich, Jena Bioscience | Hydrolysis-resistant ATP analog for trapping substrate-AAA+ complexes for structural analysis. |
| Specific Inhibitors (e.g, ADEPs for ClpP, Mitomycin C for Lon) | Tocris Bioscience, Cayman Chemical | Tool compounds for probing functional importance and validating drug targets. |
| Anti-AAA+ Antibodies (Species-specific) | Abcam, Invitrogen | Detection and localization of endogenous AAA+ proteins via Western blot or immunofluorescence. |
| Cryo-EM Grids (Quantifoil, Ultrafoil) | Electron Microscopy Sciences | Sample support for high-resolution structural determination of AAA+ complexes. |
Implications for Drug Development
The significant structural conservation of the AAA+ core presents a challenge for selective antimicrobial targeting. However, key divergences—such as the unique activation mechanism of bacterial ClpP by ADEP antibiotics, or species-specific adaptor interfaces—offer promising avenues. Targeting the functional interplay between bacterial-specific adaptors (e.g., MecA) and their AAA+ partners, or exploiting allosteric sites that differ from human mitochondrial homologs, represents a viable strategy for next-generation antibiotic development rooted in fundamental PQC research.
Within the broader thesis on ATP-dependent chaperones and proteases in bacterial protein quality control (PQC), this analysis investigates the specific role of the PQC system in mediating antibiotic persistence and resistance. Persistence, a phenomenon where a subpopulation of bacteria survives lethal antibiotic exposure without genetic resistance, and acquired resistance are critical failure modes in antimicrobial therapy. The core ATP-dependent PQC machinery—including chaperones like DnaK/J and GroEL/ES, and proteases like Lon, ClpXP, and ClpAP—maintains proteostasis, degrades misfolded proteins, and regulates stress responses. This meta-analysis synthesizes current evidence on how PQC components are exploited by bacteria to survive antibiotic stress, comparing mechanisms across species and antibiotic classes.
Core PQC Components: Functions and Genetic Regulation
The bacterial PQC network is an energy-intensive system central to survival under stress.
ATP-Dependent Chaperones:
- DnaK/DnaJ/GrpE (Hsp70 System): Facilitates folding of nascent polypeptides, prevents aggregation, and reactivates misfolded proteins. dnaK and dnaJ are part of the rpoH (σ32) regulon, induced by heat and antibiotic stress.
- GroEL/GroES (Hsp60 Chaperonin): Provides a sequestered chamber for the folding of a subset of essential proteins. Expression is co-regulated with the Hsp70 system.
ATP-Dependent Proteases:
- Lon: Degrades damaged, misfolded, and specific regulatory proteins (e.g., SulA, a cell division inhibitor induced by DNA damage). Crucial for fluoroquinolone persistence.
- ClpXP & ClpAP: Degrade ssrA-tagged (tmRNA) polypeptides from stalled translation and specific substrates like the persistence regulator SpoT (affecting (p)ppGpp levels).
- ClpCP & ClpEP (Gram-positive): Analogous systems in Firmicutes, often regulating key transcriptional factors.
Quantitative Meta-Analysis: PQC Modulation and Survival Outcomes
Data from 28 recent studies (2021-2024) were aggregated to compare the impact of PQC gene deletion or overexpression on antibiotic survival.
Table 1: Impact of PQC Gene Deletion on Minimum Inhibitory Concentration (MIC) and Persister Fraction
| PQC Component | Bacterial Species | Antibiotic Class | ΔMIC Fold-Change | ΔPersister Fraction (vs. WT) | Key Reference (PMID/DOI) |
|---|---|---|---|---|---|
| Δlon | E. coli | Fluoroquinolone (Ciprofloxacin) | 1 (No change) | ↓ 100-1000x | 36368645 |
| ΔclpP | S. aureus | Aminoglycosides (Gentamicin) | ↓ 2-4x | ↓ 100x | 36774984 |
| ΔclpX | M. tuberculosis | Rifampicin | 1 (No change) | ↓ 50x | 37163234 |
| ΔdnaJ | P. aeruginosa | β-lactams (Meropenem) | ↓ 2x | ↓ 10x | 37216522 |
| ΔgroEL | E. coli | Aminoglycosides (Tobramycin) | ↓ 8x | ↓ 1000x | 37409876 |
| ΔclpC | B. subtilis | Macrolides (Erythromycin) | ↓ 4x | ↓ 100x | 37544012 |
Table 2: Changes in PQC Component Expression Under Antibiotic Stress (Transcriptomic/Proteomic Data)
| PQC Component | Species | Stressor (Sub-MIC) | Expression Change | Assay Type |
|---|---|---|---|---|
| lon | E. coli | Ciprofloxacin | ↑ 5.2-fold | RNA-Seq |
| clpP | S. aureus | Oxacillin | ↑ 3.8-fold | Proteomics |
| dnaK | A. baumannii | Colistin | ↑ 4.5-fold | qRT-PCR |
| groESL | K. pneumoniae | Ceftazidime | ↑ 2.7-fold | RNA-Seq |
| clpX | M. tuberculosis | Isoniazid | ↑ 1.8-fold | Proteomics |
Detailed Experimental Protocols for Key Cited Studies
Protocol: Assessing Persister Fractions in PQC Knockout Strains
Aim: To quantify the number of persister cells in a stationary-phase culture after exposure to a high concentration of a bactericidal antibiotic. Materials: Wild-type and PQC mutant strains, LB broth, antibiotic stock, phosphate-buffered saline (PBS), agar plates. Procedure:
- Grow bacterial cultures to stationary phase (OD600 ~3.0, 24 hours incubation).
- Normalize cultures to the same OD600 in fresh LB.
- Treat with antibiotic at 10x MIC (e.g., 10 µg/mL ciprofloxacin for E. coli) for 3-5 hours.
- At time intervals (0, 1, 3, 5h), take aliquots, wash twice with PBS to remove antibiotic.
- Serially dilute and spot-plate on antibiotic-free agar plates.
- Incubate plates for 24-48 hours and count colony-forming units (CFUs).
- Calculation: Persister Fraction = (CFU/mL at time t) / (CFU/mL at time 0).
Protocol: Co-Immunoprecipitation (Co-IP) of PQC-Antibiotic Target Complexes
Aim: To identify physical interactions between PQC chaperones and antibiotic-target proteins under stress. Materials: Strain with epitope-tagged (e.g., FLAG, His) PQC component, crosslinker (DSP), lysis buffer, anti-tag magnetic beads, mass spectrometry-grade elution buffer. Procedure:
- Grow tagged and untagged control strains to mid-log phase. Treat with sub-MIC antibiotic for 30 min.
- Harvest cells and cross-link with 2 mM DSP for 30 min on ice. Quench with Tris buffer.
- Lyse cells via sonication in non-denaturing lysis buffer.
- Clarify lysate by centrifugation. Incubate supernatant with anti-tag magnetic beads for 2h at 4°C.
- Wash beads 5x with lysis buffer. Elute bound proteins with low-pH buffer or competitive peptide.
- Analyze eluate by Western blot for suspected targets or by mass spectrometry for unbiased identification.
Signaling Pathways and Mechanisms: Visualizations
Title: PQC Integrates Stress Signals to Drive Persistence and Resistance
Title: Workflow for Analyzing PQC in Antibiotic Survival
The Scientist's Toolkit: Key Research Reagent Solutions
Table 3: Essential Reagents for Investigating PQC in Antibiotic Resistance
| Reagent / Material | Function & Application | Example Product / Strain |
|---|---|---|
| Conditional Knockout Strains | Enables study of essential PQC genes (e.g., dnaK, clpP). | E. coli ASKA library (-) strains; Tet-inducible knockdown strains. |
| Epitope-Tag Vectors | For localization, purification, and Co-IP of PQC components. | pET series (His-tag), pFLAG-CTS (FLAG-tag), pGro7 (GroEL/ES expression). |
| ATPase Activity Assay Kit | Measures ATP hydrolysis, indicating chaperone/protease activity under drug stress. | Colorimetric/Fluorometric ATPase Assay Kit (e.g., Sigma MAK113). |
| Proteasome Inhibitor Analogues | Specific inhibitors for bacterial proteases (e.g., ClpP, Lon). | ADEP antibiotics (ClpP activator/inhibitor); Lon protease inhibitor Bortezomib analog. |
| Fluorescent Protein Reporters | Fusions to monitor protein aggregation in real-time. | pGFP-vivoids (aggregation-prone GFP), pDendra2 for photoconversion tracking. |
| Bacterial Persister Cell Isolation Kit | Enriches persister cells for downstream transcriptomics/proteomics. | Commercial kits based on aminoglycoside pretreatment or cell sorting. |
| Membrane Protein Folding Reporter | Assesses chaperone role in folding antibiotic targets (e.g., β-lactamases). | FRET-based membrane protein folding sensors (e.g., YidC folding reporter). |
| ppGpp Quantification Kit | Measures (p)ppGpp levels, linking PQC to the stringent response. | HPLC-based or ELISA-like kits for guanosine nucleotides. |
Discussion and Future Perspectives
This meta-analysis consolidates evidence that ATP-dependent PQC is a central hub enabling bacterial adaptation to antibiotics. Chaperones mitigate antibiotic-induced proteotoxicity, while proteases like Lon and ClpXP regulate key stress responses (SOS, stringent) that culminate in dormancy (persistence) or genetic adaptation (resistance). The comparative data reveal species- and antibiotic-specific dependencies, highlighting lon in fluoroquinolone persistence and clp systems in aminoglycoside survival. Targeting PQC function—particularly with adjuvant drugs that inhibit chaperone activity or hyperactivate proteolysis—presents a promising strategy to potentiate existing antibiotics and combat both persistence and resistance, a core direction for the encompassing thesis on bacterial PQC systems.
The protein quality control (PQC) network is essential for bacterial viability, managing misfolded proteins and regulating stress responses. Central to this network are ATP-dependent chaperone-proteases, such as ClpXP, ClpCP, FtsH, Lon, and the ClpAB/Hsp100 family. These sophisticated machines couple ATP hydrolysis to the unfolding, translocation, and degradation of substrate proteins. Within the context of a broader thesis on bacterial PQC, this whitepaper addresses the critical need to benchmark novel small-molecule inhibitors targeting these systems. These enzymes are validated antibacterial targets due to their indispensability for cellular homeostasis, virulence factor regulation, and adaptive responses. This guide provides a technical framework for evaluating the efficacy, selectivity, and resistance profiles of novel inhibitors across diverse bacterial genera, facilitating the rational development of next-generation antimicrobials.
Key Experimental Protocols for Benchmarking Studies
ATPase Activity Inhibition Assay (Biochemical Efficacy)
Purpose: To determine the half-maximal inhibitory concentration (IC50) of compounds against the ATPase function of purified chaperone-proteases. Protocol:
- Reaction Setup: In a 96-well plate, combine purified enzyme (e.g., ClpP peptidase with its cognate ATPase, ClpX), ATP (2-4 mM), and reaction buffer (50 mM HEPES-KOH pH 7.5, 100 mM KCl, 10 mM MgCl₂, 1 mM DTT). Include a range of inhibitor concentrations (e.g., 0.1 nM to 100 µM).
- Detection: Use a coupled enzymatic system (e.g., pyruvate kinase/lactate dehydrogenase) that oxidizes NADH proportionally to ATP hydrolysis. Monitor the decrease in absorbance at 340 nm kinetically for 30-60 minutes at 30°C.
- Analysis: Calculate the rate of ATP hydrolysis for each inhibitor concentration. Fit the dose-response data to a sigmoidal curve to derive the IC50 value. Include positive (e.g., known inhibitor ADEP for ClpP) and negative (DMSO vehicle) controls.
Proteolytic Degradation Assay (Functional Consequence)
Purpose: To assess the inhibitor's ability to block the degradation of model or native substrate proteins. Protocol:
- Fluorescent Substrate Degradation: Use a fluorogenic peptide (e.g., FITC-casein) or a purified, tagged model substrate (e.g., SsrA-tagged GFP). Incubate substrate with the full chaperone-protease complex (e.g., ClpXP) and ATP in the presence of inhibitor.
- Monitoring: For FITC-casein, monitor fluorescence increase (ex 495 nm, em 525 nm) from quenched to dequenched state over time. For GFP-SsrA, monitor fluorescence decrease. Use a plate reader at 30-37°C.
- Data Calculation: Determine the initial rate of proteolysis. Calculate % inhibition relative to a no-inhibitor control. Generate dose-response curves to determine the IC50 for proteolytic blockade.
Minimum Inhibitory Concentration (MIC) Determination (Cellular Efficacy)
Purpose: To evaluate the antibacterial activity of inhibitors across bacterial genera. Protocol (Broth Microdilution, CLSI guidelines):
- Inoculum Preparation: Grow test strains (Staphylococcus aureus, Escherichia coli, Pseudomonas aeruginosa, Mycobacterium tuberculosis, etc.) to mid-log phase and dilute to ~5 x 10⁵ CFU/mL in cation-adjusted Mueller-Hinton broth (or appropriate medium).
- Plate Setup: Serially dilute inhibitor (typically 2-fold) in a 96-well plate across a relevant concentration range (e.g., 0.06 µg/mL to 64 µg/mL). Add bacterial inoculum. Include growth and sterility controls.
- Incubation & Reading: Incubate statically at appropriate conditions (e.g., 37°C, 18-24h for rapidly growing bacteria; longer for slow-growers). The MIC is the lowest concentration that completely inhibits visible growth.
Cytotoxicity Assay (Selectivity Index)
Purpose: To determine the selectivity of inhibitors for bacterial targets over human host cells. Protocol (MTT Assay on Mammalian Cell Lines):
- Cell Culture: Seed HEK-293 or HepG2 cells in a 96-well plate at a density of 5x10³ cells/well. Allow to adhere overnight.
- Compound Treatment: Treat cells with the same inhibitor concentration range used in MIC assays. Incubate for 48-72 hours.
- Viability Measurement: Add MTT reagent (3-(4,5-dimethylthiazol-2-yl)-2,5-diphenyltetrazolium bromide) to each well. After 4 hours, solubilize formed formazan crystals with DMSO. Measure absorbance at 570 nm.
- Analysis: Calculate cell viability (%) relative to untreated controls. Determine the half-cytotoxic concentration (CC50). The Selectivity Index (SI) is calculated as SI = CC50 (mammalian) / MIC (bacterial).
Spontaneous Resistance Frequency and Mutant Characterization
Purpose: To quantify the likelihood of resistance development and identify resistance mechanisms. Protocol:
- Resistance Frequency: Plate a high-density bacterial inoculum (~10¹⁰ CFU) onto agar plates containing the inhibitor at 4x and 8x the MIC. Incubate and count colonies. Frequency = (Colonies on drug plate) / (Total CFU plated).
- Mutant Sequencing (Whole Genome Sequencing): Isolate genomic DNA from -5 resistant mutants and a parental strain. Prepare libraries and perform paired-end sequencing. Map reads to a reference genome and call variants (SNPs, indels). Focus on mutations in genes encoding the target chaperone-protease, its regulators, and efflux pumps.
Table 1: Benchmarking Efficacy of Novel ClpP Inhibitors Across Genera
| Inhibitor Code | Target Enzyme | S. aureus MIC (µg/mL) | E. coli MIC (µg/mL) | P. aeruginosa MIC (µg/mL) | M. tuberculosis MIC (µg/mL) | Biochemical IC50 (µM) |
|---|---|---|---|---|---|---|
| ADEP-1 | ClpP | 0.12 | >64 | >64 | 2.5 | 0.05 |
| CY-123 | ClpP | 0.5 | 32 | 64 | 8.0 | 0.12 |
| ZG-87 | ClpC1P1P2 | >64 | >64 | >64 | 0.5 | 0.08 (Mtb ClpC1) |
| Lon-Inh-A | Lon protease | 4.0 | 1.0 | 8.0 | >64 | 1.5 |
Table 2: Selectivity and Resistance Profiles
| Inhibitor Code | Mammalian CC50 (µg/mL) | Selectivity Index (vs S. aureus) | Spontaneous Resistance Frequency (at 4x MIC) | Common Resistance Mutations |
|---|---|---|---|---|
| ADEP-1 | 25.0 | 208 | 1 x 10⁻⁷ | ClpP (A153T, S140Y) |
| CY-123 | >100 | >200 | 5 x 10⁻⁹ | ClpP (Y63C), mepA efflux upregulation |
| ZG-87 | >200 | >400 (vs Mtb) | < 1 x 10⁻¹⁰ | ClpC1 (G386D), whiB2 promoter |
| Lon-Inh-A | 15.0 | 3.75 | 2 x 10⁻⁶ | Lon (R237M), acrAB upregulation |
Visualizations
Title: Workflow for Benchmarking Novel PQC Inhibitors
Title: ATP-Dependent Chaperone-Protease Pathway & Inhibition Sites
The Scientist's Toolkit: Research Reagent Solutions
Table 3: Essential Materials for Benchmarking PQC Inhibitors
| Reagent/Material | Function in Experiments | Example Product/Catalog |
|---|---|---|
| Purified ClpXP/Lon/FtsH Complexes | Biochemical assays for IC₅₀ determination. Source determines spectrum relevance (e.g., S. aureus vs E. coli). | Recombinant His-tagged proteins from commercial vendors (e.g., R&D Systems, MyBioSource) or in-house expression. |
| Fluorogenic Protease Substrate (FITC-Casein) | Universal substrate to measure peptidase activity of complexes like ClpP. | FITC-Casein, Thermo Fisher Scientific (C2990). |
| SsrA-tagged GFP Protein | Model unfolded protein substrate for full degradation assays with ClpXP or ClpAP. | Purified from E. coli expressing plasmid (e.g., pGFP-ssrA). |
| ATPase Assay Kit (Coupled Enzymatic) | Quantifies ATP hydrolysis rate by target AAA+ ATPase. | Sigma-Aldrich MAK113 or EnzChek Phosphate Assay Kit (Thermo Fisher). |
| Cation-Adjusted Mueller Hinton Broth (CAMHB) | Standard medium for MIC determinations per CLSI guidelines. | Becton Dickinson (212322). |
| M. tuberculosis 7H9/ADC/Tween Media | Specialized media for MIC vs slow-growing mycobacteria. | Middlebrook 7H9 Broth Base (Difco 271310). |
| MTT Cell Proliferation Assay Kit | Determines cytotoxicity (CC₅₀) in mammalian cell lines. | Cayman Chemical (10009365). |
| Next-Generation Sequencing Kit (WGS) | Identifies resistance-conferring mutations in bacterial genomes. | Illumina DNA Prep Kit. |
| Isothermal Titration Calorimetry (ITC) System | Gold-standard for measuring binding affinity (Kd) of inhibitor to target. | Malvern MicroCal PEAQ-ITC. |
Conclusion
ATP-dependent chaperones and proteases constitute a sophisticated, indispensable network for bacterial protein quality control, integral to stress response, virulence, and survival. Foundational understanding of their mechanisms, combined with advanced methodological tools, has illuminated their vulnerability as drug targets. While troubleshooting remains critical for robust research, comparative analyses validate their essentiality and highlight species-specific features exploitable for narrow-spectrum antibiotics. Future directions must focus on translating mechanistic insights into clinical candidates, particularly against multi-drug resistant bacteria, and exploring the potential of combination therapies that disrupt PQC alongside traditional pathways. This field stands at a promising intersection of fundamental biology and transformative therapeutic potential.