Accurate Quantification of Protein Encapsulation Efficiency: A Comprehensive Guide to HPLC-ELSD Methods for Drug Delivery Research
This comprehensive guide details the application of High-Performance Liquid Chromatography with Evaporative Light Scattering Detection (HPLC-ELSD) for precisely determining protein encapsulation efficiency in drug delivery systems.
Accurate Quantification of Protein Encapsulation Efficiency: A Comprehensive Guide to HPLC-ELSD Methods for Drug Delivery Research
Abstract
This comprehensive guide details the application of High-Performance Liquid Chromatography with Evaporative Light Scattering Detection (HPLC-ELSD) for precisely determining protein encapsulation efficiency in drug delivery systems. It covers foundational principles, establishes a robust methodological framework from sample preparation to data analysis, and provides troubleshooting strategies for common challenges. The article critically validates the technique against alternative methods like UV and CAD, highlighting its unique advantages for universal, non-chromophoric detection in protein-loaded nanoparticles, liposomes, and microspheres. Aimed at researchers and formulation scientists, this resource serves as a practical manual for developing reliable, standardized analytical protocols in biopharmaceutical development.
Understanding HPLC-ELSD: The Universal Detector for Protein Quantification Without Chromophores
Evaporative Light Scattering Detection (ELSD) is a universal, mass-based detection technique critical for analyzing compounds lacking a chromophore, such as lipids, carbohydrates, polymers, and certain pharmaceuticals. Within the context of High-Performance Liquid Chromatography (HPLC) for protein encapsulation efficiency research, ELSD provides a robust solution for quantifying excipients, lipids, and free/unencapsulated protein without the need for UV absorbance. This application note details the operating principle, experimental protocols, and implementation for drug development workflows.
Operating Principle of ELSD
The ELSD process converts a liquid effluent into measurable light scatter signals through three sequential stages:
- Nebulization: The HPLC column effluent is mixed with a controlled flow of inert gas (typically nitrogen) and converted into a fine, uniform aerosol of droplets.
- Evaporation: The aerosol passes through a heated drift tube, where the volatile mobile phase (e.g., water, acetonitrile, methanol) is completely evaporated. This leaves behind fine, non-volatile analyte particles suspended in the gas stream.
- Detection: The particle-laden gas stream passes through a light path (usually a laser beam). Light is scattered by the particles, and the scattered light is collected at a specific angle (e.g., 90° or 120°) by a photomultiplier tube (PMT). The intensity of the scattered light is proportional to the mass of the analyte present.
Key Advantage for Encapsulation Studies: Unlike UV detection, ELSD response depends on the physical presence of the analyte particle, not its electronic structure. This allows for the direct detection of non-UV absorbing lipids forming the encapsulation vehicle (e.g., liposomes, lipid nanoparticles) and the protein/peptide drug itself, enabling mass balance calculations for encapsulation efficiency.
Table 1: Comparison of HPLC Detectors for Bioformulation Analysis
| Detector Type | Detection Principle | Suitable for Non-UV Analytes? | Mass/Concentration Sensitivity | Gradient Compatibility | Suitability for Encapsulation Efficiency |
|---|---|---|---|---|---|
| UV/Vis | Electronic absorption | No | High (ng-µg) | Excellent (with low-UV solvents) | Low (requires chromophore) |
| ELSD | Light scattering by particles | Yes | Moderate (µg) | Excellent (evaporates solvents) | High (universal for non-volatiles) |
| RID (Refractive Index) | Change in refractive index | Yes | Low (µg-mg) | Poor (baseline drifts) | Low (not gradient compatible) |
| CAD (Charged Aerosol) | Particle charge detection | Yes | High (ng-µg) | Excellent | Very High (higher sensitivity) |
| MS (Mass Spectrometry) | Mass-to-charge ratio | Yes | Very High (pg-ng) | Excellent | Very High (requires expertise) |
Table 2: Typical ELSD Operational Parameters for Lipid/Protein Analysis
| Parameter | Typical Range | Recommended Setting for Lipid Analysis | Recommended Setting for Protein Analysis |
|---|---|---|---|
| Nebulizer Gas Pressure | 1.0 - 3.5 bar | 2.5 - 3.2 bar | 2.0 - 2.8 bar |
| Drift Tube Temperature | 30 - 100 °C | 40 - 60 °C | 60 - 80 °C |
| Gain/PMT Voltage | 1 - 10 (arbitrary) | 6 - 8 | 7 - 9 |
| Mobile Phase Requirement | Volatile buffers (e.g., ammonium formate/acetate, TFA, FA) | Acetonitrile/Isopropanol with 0.1% Formic Acid | Water/Acetonitrile with 0.1% TFA |
Detailed Protocols
Protocol 1: HPLC-ELSD Method for Lipid Excipient Quantification
Objective: To quantify phospholipid components (e.g., DSPC, DOPC, cholesterol) in a liposomal formulation. Materials: HPLC system, ELSD, C18 or C8 reversed-phase column (4.6 x 150 mm, 5 µm), nitrogen generator. Reagents: HPLC-grade acetonitrile, isopropanol, chloroform, ammonium acetate. Procedure:
- Mobile Phase Preparation: Prepare a binary gradient system. Solvent A: 95:5 Water:Acetonitrile with 10mM ammonium acetate. Solvent B: 90:10 Isopropanol:Acetonitrile with 10mM ammonium acetate.
- ELSD Calibration: Prepare a standard curve for each lipid (5-500 µg/mL) in chloroform:methanol (1:1). Inject 10-50 µL.
- ELSD Settings: Nebulizer: 3.0 bar N₂, Drift Tube: 55°C, Gain: 7.
- Chromatography: Run a gradient from 60% B to 100% B over 20 min. Flow rate: 1.0 mL/min.
- Sample Analysis: Dilute liposomal formulation in organic solvent to disrupt vesicles, inject, and quantify peaks against the standard curve.
Protocol 2: Determining Protein Encapsulation Efficiency via Size Exclusion HPLC-ELSD
Objective: Separate and quantify encapsulated vs. free protein to calculate encapsulation efficiency (%EE). Materials: HPLC system with ELSD, size-exclusion column (e.g., silica-based 300Å, 7.8 x 300 mm), ultracentrifuge. Reagents: Phosphate Buffered Saline (PBS), HPLC-grade water. Procedure:
- Sample Preparation: Dilute the protein-loaded nanoparticle formulation (e.g., LNPs) 1:10 in PBS.
- Separation of Free Protein: Ultracentrifuge at 100,000 x g for 60 min. Carefully collect the supernatant containing free/unencapsulated protein.
- Chromatographic Separation: Inject the supernatant directly onto the SEC column. Isocratic mobile phase: PBS or 0.1M ammonium acetate, pH 7.0. Flow rate: 1.0 mL/min.
- ELSD Settings: Nebulizer: 2.5 bar N₂, Drift Tube: 70°C, Gain: 8.
- Quantification & Calculation: The ELSD signal for the free protein peak is measured. A standard curve of the pure protein (5-200 µg) is used for quantification.
% Encapsulation Efficiency = [(Total Protein - Free Protein) / Total Protein] x 100 Total Protein is determined by analyzing a lysed/detergent-treated sample of the original formulation.
Visualizations
Diagram 1: ELSD Process Workflow
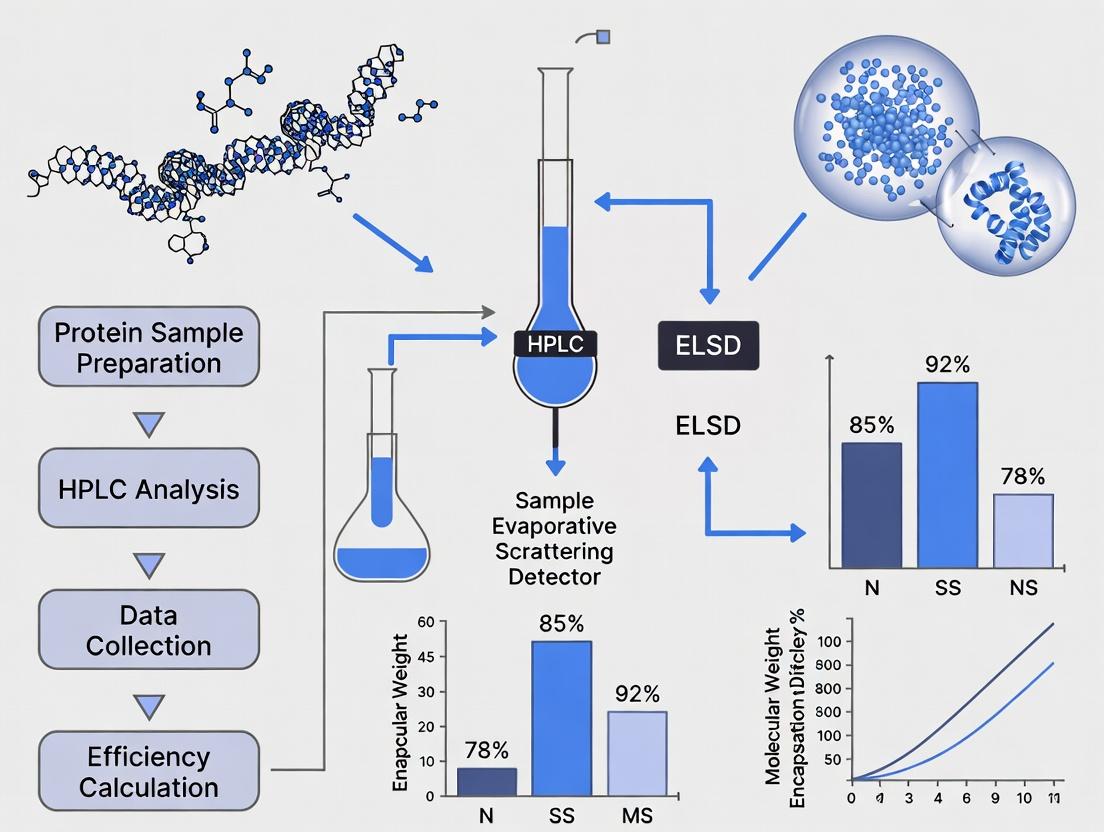
Diagram 2: HPLC-ELSD for Encapsulation Efficiency Workflow
The Scientist's Toolkit: Key Research Reagent Solutions
Table 3: Essential Materials for HPLC-ELSD in Encapsulation Research
| Item | Function & Relevance | Example/Note |
|---|---|---|
| Volatile Buffers (Ammonium formate/acetate, TFA, FA) | Provide necessary pH control/ion-pairing without leaving residue in ELSD drift tube. Critical for maintaining baseline stability. | Use at 5-50 mM concentration. |
| HPLC-Grade Organic Solvents (Acetonitrile, Methanol, Isopropanol, Chloroform) | Low UV-cutoff and high volatility ensure clean evaporation and minimal background noise in ELSD. | Use with stabilizers for certain methods. |
| Nitrogen Gas Generator | Provides consistent, clean, dry nebulizer gas. Purity is critical for stable aerosol generation and low noise. | Prefer generators over cylinder gas for long-term cost savings. |
| C18/C8 Reversed-Phase Columns | Separate individual lipid components (phospholipids, cholesterol) based on hydrophobicity for lipid quantification. | Use with high organic solvent gradients. |
| Size Exclusion (SEC) Columns | Separate nanoparticles (encapsulated protein) from free protein based on hydrodynamic size. Core tool for %EE. | Use with aqueous, salt-based mobile phases (PBS, ammonium acetate). |
| Standard Lipid/Protein Kits | High-purity analytes for generating calibration curves. Essential for absolute quantification of excipients and drug. | Source from reputable biochemical suppliers. |
Within the framework of research on quantifying protein encapsulation efficiency using HPLC-ELSD, a critical challenge is the reliable detection of proteins post-chromatographic separation. Traditional UV detection, while ubiquitous, presents significant limitations when analyzing proteins within complex formulations containing polymeric excipients, lipids, or other UV-absorbing compounds. This application note details why the Evaporative Light Scattering Detector (ELSD) is an ideal solution for this analytical problem, providing protocols for method development and application.
Limitations of UV Detection for Proteins in Formulations
UV detection (e.g., at 214 nm for peptide bonds or 280 nm for aromatic residues) is non-selective. In complex formulations, excipients like polymers (PLGA, PEG), surfactants, or unencapsulated lipids often co-elute or have overlapping UV spectra with the target protein, leading to:
- High baseline interference, obscuring analyte peaks.
- Inaccurate quantification due to co-elution of absorbing species.
- Insuensitivity for proteins with poor UV chromophores.
The ELSD Advantage: A Universal, Mass-Based Detector
The ELSD operates on a principle that is independent of a chromophore:
- Nebulization: The HPLC eluent is transformed into a fine aerosol.
- Evaporation: The mobile phase is evaporated in a drift tube, leaving behind non-volatile analyte particles (e.g., protein).
- Detection: Light scatters when it hits the particle cloud; the scattered light is measured by a photomultiplier.
This process renders the detector "universal" for non-volatile analytes and insensitive to volatile mobile phase components or excipients, making it exceptionally suited for analyzing proteins in the presence of complex formulation matrices.
Key Performance Data: UV vs. ELSD
The following table summarizes comparative data from model studies analyzing proteins (e.g., BSA, Lysozyme) in polymeric nanoparticle formulations.
Table 1: Comparative Performance of UV Detection vs. ELSD for Protein Analysis in Complex Matrices
| Parameter | UV Detection (214 nm) | HPLC-ELSD | Advantage for ELSD |
|---|---|---|---|
| Selectivity in Polymer Presence | Severe interference from PLGA/PEG degradation products. | Minimal to no signal from polymers at typical analytical concentrations. | Enables specific protein quantification in polymer/protein mixtures. |
| Linearity Range (BSA) | ~10–200 µg/mL (with matrix interference) | ~1–500 µg/mL (R² > 0.998) | Wider dynamic range for quantification. |
| Limit of Detection (Lysozyme) | ~5 µg/mL (in buffer) | ~1–2 µg/mL (on-column) | Improved sensitivity for proteins with weaker UV absorbance. |
| Baseline Stability | Unstable with gradient elution; sensitive to mobile phase impurities. | Highly stable; unaffected by solvent absorbance or gradient shifts. | Superior for gradient HPLC methods essential for protein separation. |
| Mobile Phase Flexibility | Restricted to UV-transparent solvents/buffers. | Compatible with volatile buffers (e.g., TFA, ammonium formate, ammonium bicarbonate) and modifiers. | Enables use of MS-compatible conditions and optimal chromatography. |
Experimental Protocol: Determining Protein Encapsulation Efficiency via SEC-ELSD
Aim: To separate and quantify free (unencapsulated) protein from encapsulated protein in a nanoparticle formulation using Size-Exclusion Chromatography (SEC) coupled with ELSD.
I. Materials & Reagent Solutions (The Scientist's Toolkit)
Table 2: Essential Research Reagent Solutions
| Item | Function/Description |
|---|---|
| Volatile SEC Mobile Phase | 30 mM ammonium acetate, pH 6.8, in HPLC-grade water. Provides separation without interfering with ELSD nebulization/evaporation. |
| Protein Standard Stock | Lyophilized protein (e.g., BSA, Lysozyme). Prepare stock solution in mobile phase for calibration. |
| Nanoparticle Dissolution Solvent | Acetonitrile or mild organic solvent. Selectively disrupts nanoparticle matrix to release encapsulated protein without precipitating it. |
| Micro-Centrifugal Filters | 10 kDa molecular weight cut-off (MWCO) devices. For rapid separation of nanoparticles from free protein prior to SEC analysis. |
| HPLC-ELSD System | System equipped with SEC column (e.g., 300 Å, 5 µm), isocratic pump, and ELSD. Critical for mass-based detection. |
| ELSD Nebulizer Gas | High-purity nitrogen or compressed air supply. Required for aerosol generation. |
II. Detailed Methodology
Step 1: Sample Preparation
- Free Protein Fraction: Dilute nanoparticle suspension with mobile phase. Centrifuge at 14,000 x g using a 10 kDa MWCO filter for 15 min. Collect the filtrate containing free protein.
- Total Protein Fraction: Dilute an aliquot of nanoparticles with 50% acetonitrile in mobile phase (v/v). Vortex vigorously for 60 min to fully dissolve the matrix and release all protein. Centrifuge to remove any insoluble debris; supernatant contains total protein.
Step 2: SEC-ELSD Analysis
- Chromatographic Conditions:
- Column: SEC column (e.g., 7.8 x 300 mm).
- Mobile Phase: 30 mM ammonium acetate, pH 6.8.
- Flow Rate: 0.8 mL/min. Isocratic.
- Column Temperature: 25°C.
- Injection Volume: 50 µL.
- ELSD Parameters:
- Nebulizer Temperature: 40°C (Optimize for complete mobile phase evaporation).
- Evaporator (Drift Tube) Temperature: 80°C.
- Gas Flow Rate: 1.5 SLM (Standard Liters per Minute). Set to achieve stable baseline and optimal signal-to-noise.
- Gain: 8-10 (Instrument specific).
- Calibration: Inject a series of protein standard solutions (e.g., 1, 5, 10, 50, 100 µg/mL) to generate a log-log calibration curve (Peak Area vs. Concentration).
Step 3: Data Calculation
- Quantify free protein (from filtrate) and total protein (from dissolved sample) concentrations from their respective peak areas using the calibration curve.
- Encapsulation Efficiency (EE%) = [(Total Protein - Free Protein) / Total Protein] x 100.
Workflow and Signal Pathway Diagrams
ELSD Operational Principle Workflow
Protein Encapsulation Efficiency Analysis Workflow
Application Notes
Within the broader thesis on utilizing High-Performance Liquid Chromatography with Evaporative Light Scattering Detection (HPLC-ELSD) for protein encapsulation efficiency research, this work establishes a universal analytical framework. HPLC-ELSD is uniquely suited for this application as it provides direct mass-based detection of non-volatile analytes (e.g., proteins, polymers, lipids) without requiring chromophores or fluorophores. This is critical for quantifying both the encapsulated payload and the carrier components across diverse nano- and micro-formulations. The following protocols detail standardized methods for separating unencapsulated material and quantifying encapsulation efficiency (EE%) and drug loading (DL%).
Table 1: Quantitative Comparison of Encapsulation Metrics Across Formulations
| Formulation Type | Typical EE% Range (Protein) | Typical DL% Range (w/w) | Key Analytical Challenge Addressed by HPLC-ELSD |
|---|---|---|---|
| Liposomes | 20% - 65% | 1% - 10% | Detection of phospholipids and protein without UV activity. |
| Polymeric NPs (PLGA/PLLA) | 50% - 85% | 5% - 20% | Separation of polymer degradation products from protein analyte. |
| Microspheres | 70% - 95% | 10% - 30% | Handling of high polymer-to-drug ratio and solid residue post-evaporation. |
Experimental Protocols
Protocol 1: Universal Sample Preparation for Separation of Unencapsulated Protein
Objective: To isolate encapsulated nanoparticles/microspheres from free, unencapsulated protein.
- Ultracentrifugation (for Liposomes & Polymeric NPs): Aliquot 1 mL of the raw formulation. Centrifuge at 100,000 x g, 4°C for 60 min (liposomes) or 40,000 x g, 4°C for 30 min (polymeric NPs). Carefully collect the supernatant (containing free protein). Wash the pellet twice with appropriate buffer (e.g., PBS, pH 7.4) with resuspension and repeat centrifugation. Combine supernatants as the "free fraction."
- Vacuum Filtration (for Microspheres): Use a 0.22 μm hydrophilic PVDF filter unit under mild vacuum. Rinse the filter containing the microspheres three times with 5 mL of deionized water. Collect the combined filtrate and rinsates as the "free fraction."
- Pellet Disruption (for Total Protein): Lyse the purified pellet (or filtered microspheres) using an appropriate method: 1% v/v Triton X-100 in buffer for liposomes, or 0.1 M NaOH with gentle heating for polymeric carriers. Neutralize if necessary. This is the "encapsulated fraction."
Protocol 2: HPLC-ELSD Analysis of Protein Content
Objective: To quantify protein in the "free" and "encapsulated" fractions.
- Instrument Parameters:
- Column: Reversed-phase C4 or C8 column (e.g., 4.6 x 150 mm, 5 μm).
- Mobile Phase A: 0.1% Trifluoroacetic Acid (TFA) in Water.
- Mobile Phase B: 0.1% TFA in Acetonitrile.
- Gradient: 20% B to 80% B over 15 min, 2 min hold, re-equilibration.
- Flow Rate: 1.0 mL/min.
- Injection Volume: 50 μL.
- ELSD Parameters: Evaporator Tube Temperature: 80°C, Nebulizer Temperature: 50°C, Gas (N₂) Flow: 1.5 SLM, Gain: 8.
- Quantification: Generate a 5-point calibration curve (e.g., 0.1 - 2.0 mg/mL) of the standard protein. Plot log(peak area) vs. log(concentration). Use the linear regression to calculate protein concentration in unknown fractions.
- Calculation:
- Encapsulation Efficiency (EE%): = [Amount in Encapsulated Fraction / (Amount in Encapsulated + Free Fractions)] x 100.
- Drug Loading (DL%): = (Mass of Protein in Encapsulated Fraction / Total Mass of Recovered Formulation) x 100.
The Scientist's Toolkit: Research Reagent Solutions
Table 2: Essential Materials for Encapsulation Analysis via HPLC-ELSD
| Item | Function & Rationale |
|---|---|
| Poly(lactic-co-glycolic acid) (PLGA) | Biodegradable polymer matrix for nanoparticle/microsphere formation. |
| DSPC/Cholesterol (55:45 mol ratio) | Standard lipid composition for stable, neutral liposome formulation. |
| Trifluoroacetic Acid (TFA), HPLC Grade | Ion-pairing agent in mobile phase to improve protein peak shape and separation. |
| Phosphate Buffered Saline (PBS), pH 7.4 | Isotonic buffer for formulation dilution and washing to maintain stability. |
| Triton X-100 Detergent | Non-ionic surfactant for complete lysis of lipid bilayers to release encapsulated protein. |
| 0.22 μm Hydrophilic PVDF Filters | For size-based separation of microspheres from aqueous free protein. |
| Acetonitrile (ACN), HPLC Grade | Organic mobile phase component for gradient elution of proteins. |
Visualizations
HPLC-ELSD Encapsulation Analysis Workflow
HPLC-ELSD Instrument Pathway for Protein
Essential Components of an HPLC-ELSD System for Protein Analysis
This application note details the essential components and protocols for an HPLC-Evaporative Light Scattering Detector (ELSD) system, specifically optimized for analyzing protein encapsulation efficiency within lipid or polymeric nanoparticles. As part of a broader thesis on analytical methods for nanomedicine, this document provides a framework for reliable, non-UV-dependent quantification of both free and encapsulated protein.
Essential System Components & Function
An HPLC-ELSD system for protein analysis comprises distinct modules, each critical for successful separation and detection. The table below summarizes these components and their specific roles.
Table 1: Core Components of an HPLC-ELSD System for Protein Analysis
| Component | Specific Role & Requirement |
|---|---|
| Solvent Delivery System | High-pressure binary or quaternary pump. Must generate pulse-free flow for stable baseline. Compatibility with aqueous buffers and organic modifiers (e.g., acetonitrile, isopropanol) is essential. |
| Injector | Automated autosampler with precision sample loop (typically 10-100 µL). Enables reproducible injection of nanoparticle suspensions and protein standards. |
| Analytical Column | Size-exclusion (SEC) or reversed-phase (RP) columns dominate. For encapsulation studies, an SEC column (e.g., silica-based, 300 Å pore size) is preferred to separate intact nanoparticles from free protein without disruption. |
| Evaporative Light Scattering Detector (ELSD) | Critical Component. Comprises: 1) Nebulizer: Converts column effluent into a fine aerosol using a gas (N2). 2) Drift Tube: Evaporates the volatile mobile phase, leaving non-volatile analyte particles. 3) Light Scattering Cell: A laser light source illuminates the particles, and a photomultiplier tube detects the scattered light. Response is independent of chromophores. |
| Data Acquisition System | Chromatography software to control the system, acquire signals, and integrate peak areas for quantification. |
Experimental Protocol: Determining Protein Encapsulation Efficiency
This protocol outlines the key steps for analyzing protein-loaded nanoparticles using SEC-HPLC-ELSD.
Aim: To separate and quantify encapsulated protein (within intact nanoparticles) and free, unencapsulated protein, thereby calculating encapsulation efficiency (EE%).
Protocol Steps:
Sample Preparation:
- Prepare the nanoparticle formulation (e.g., protein-loaded liposomes or PLGA nanoparticles).
- Crucial Step: Purify the nanoparticle suspension via size-exclusion spin columns or mini-gel filtration to remove any unformulated protein or aggregates that could interfere. This step may be omitted if the HPLC-SEC separation is highly resolving.
- Prepare a series of dilutions of the standard protein (the same as encapsulated) in the formulation buffer for calibration.
- Prepare the mobile phase: Typically, an isocratic, volatile buffer is used. For SEC, a common choice is 100-200 mM ammonium acetate, pH 6.8-7.2, optionally with 5% organic modifier. Filter (0.22 µm) and degas prior to use.
HPLC-ELSD System Setup & Calibration:
- Install an appropriate SEC column (e.g., 7.8 x 300 mm, 5 µm particle size).
- Connect the ELSD and set parameters. Typical ELSD settings: Nebulizer Gas (N2): 2.5 - 3.5 bar; Drift Tube Temp: 40 - 70°C; Gain: 8 - 10.
- Equilibrate the system with mobile phase at a flow rate of 0.5 - 1.0 mL/min until a stable baseline is achieved.
- Inject protein standard solutions (e.g., 5 - 100 µg) to generate a calibration curve. Plot log(peak area) vs. log(protein mass) for linearization.
Sample Analysis & Data Processing:
- Inject the purified nanoparticle sample.
- The chromatogram will show two primary peaks: a high-molecular-weight peak (void volume, containing intact nanoparticles with encapsulated protein) and a later-eluting peak (free protein).
- Integrate the peak areas for both the nanoparticle peak and the free protein peak.
- Calculation:
- Total Protein (from nanoparticle lysis) = Mass in Nanoparticle Peak + Mass in Free Protein Peak.
- Encapsulation Efficiency (%) = (Mass in Nanoparticle Peak / Total Protein) x 100.
- Drug Loading (%) = (Mass of Encapsulated Protein / Total Nanoparticle Mass) x 100.
Workflow and Data Interpretation
Diagram Title: HPLC-ELSD Workflow for Protein Encapsulation Analysis
The Scientist's Toolkit: Key Research Reagent Solutions
Table 2: Essential Materials for HPLC-ELSD Protein Encapsulation Studies
| Item | Function & Rationale |
|---|---|
| SEC Columns (e.g., silica-based, 300 Å) | Separates analytes by hydrodynamic size. Critical for resolving intact nanoparticles from free protein without causing carrier disruption. |
| Ammonium Acetate Buffer (Volatile, 100-200 mM, pH ~7.0) | Ideal volatile mobile phase salt for ELSD compatibility. Prevents salt crystallization in the drift tube and allows for clean evaporation. |
| High-Purity Nitrogen (N2) Gas | The nebulizing and evaporating gas for the ELSD. Must be free of impurities to prevent elevated background noise. |
| Protein Standard (Pure Target Protein) | Required for constructing the calibration curve. Must be identical to the encapsulated protein for accurate quantification. |
| Size-Exclusion Spin Columns (e.g., Sephadex G-50) | For rapid offline purification of nanoparticle suspensions to remove unencapsulated protein prior to HPLC injection, minimizing column contamination. |
| HPLC-Grade Water & Organic Modifiers (ACN, IPA) | Used for mobile phase preparation and system rinsing. Low UV absorbance and particulate-free to prevent system damage and background noise. |
Critical Method Parameters & Optimization Data
Optimal parameter selection is empirical and depends on the specific protein-nanoparticle system. The table below provides a standard starting point and optimization range.
Table 3: Key Method Parameters and Their Impact
| Parameter | Typical Starting Value | Optimization Range | Impact on Analysis |
|---|---|---|---|
| SEC Mobile Phase | 150 mM Ammonium Acetate | 50 - 300 mM, pH 6.5-7.5 | Ionic strength affects nanoparticle stability and protein-column interactions. |
| Flow Rate | 0.8 mL/min | 0.5 - 1.2 mL/min | Affects separation resolution and analysis time. Lower flow improves SEC resolution. |
| ELSD Nebulizer Gas Pressure | 3.0 bar (N2) | 2.0 - 4.0 bar | Influences aerosol droplet size. Higher pressure gives finer aerosol, higher signal, but can increase noise. |
| ELSD Drift Tube Temperature | 50°C | 40 - 90°C | Must fully evaporate mobile phase. Too low causes condensation; too high can degrade heat-sensitive analytes. |
| Injection Volume | 50 µL | 10 - 100 µL | Balance between detection sensitivity and potential column overloading. |
In the context of a thesis on using High-Performance Liquid Chromatography with Evaporative Light Scattering Detection (HPLC-ELSD) for determining protein encapsulation efficiency in drug delivery systems, a fundamental advantage of ELSD is its independence from the optical properties of the analyte. Unlike UV/Vis detection, which requires the presence of a chromophore (e.g., aromatic amino acids or conjugated bonds), ELSD responds to the mass of non-volatile analyte particles. This is critical for protein analysis where UV absorbance can vary dramatically based on primary sequence, post-translational modifications, or formulation excipients that may interfere.
Core Principles and Quantitative Advantages
Table 1: Comparative Detection Characteristics: UV vs. ELSD for Proteins
| Feature | UV Detection (e.g., 214-280 nm) | Evaporative Light Scattering Detection (ELSD) |
|---|---|---|
| Detection Principle | Absorption of light by chromophores | Light scattering by non-volatile residue |
| Dependency on Sequence | High (Requires Trp, Tyr, Phe, or peptide bonds) | None |
| Response Factor Uniformity | Low (Varies with chromophore count) | High (More consistent across different proteins) |
| Compatibility with Solvents | Requires UV-transparent solvents & buffers | Compatible with volatile buffers, gradients |
| Sensitivity | Typically high (ng-pg for strong chromophores) | Moderate (low µg range, instrument-dependent) |
| Suitability for Encapsulation Studies | Challenged by excipient interference (e.g., polymers, lipids) | Excellent; detects protein directly, unaffected by most formulation matrices |
Table 2: Example Data for Model Proteins with Varied Chromophore Content
| Protein | Tryptophan Residues | Theoretical UV 280nm Extinction Coefficient (M⁻¹cm⁻¹) | Relative UV Peak Area (280 nm) | Relative ELSD Peak Area | Discrepancy (UV vs. ELSD) |
|---|---|---|---|---|---|
| Lysozyme | 6 | ~36,000 | 1.00 (Reference) | 1.00 (Reference) | Minimal |
| Insulin | 0 | ~6,000 | 0.17 | 0.95 | High (UV underestimates) |
| BSA | 2 | ~43,000 | 1.19 | 1.05 | Moderate |
| Cytochrome c | 1 | ~17,000 | 0.47 | 0.98 | High |
Detailed Application Protocol: Determining Protein Encapsulation Efficiency in PLGA Nanoparticles via HPLC-ELSD
Objective
To accurately quantify free (unencapsulated) protein in the supernatant after nanoparticle formulation, enabling calculation of encapsulation efficiency (%EE), without interference from polymeric or surfactant components.
Materials & Reagent Solutions (The Scientist's Toolkit)
Table 3: Essential Research Reagent Solutions
| Item | Function/Description |
|---|---|
| Volatile Mobile Phase A | 0.1% Trifluoroacetic Acid (TFA) in HPLC-grade water. Provides ion-pairing for separation and volatility for ELSD. |
| Volatile Mobile Phase B | 0.1% TFA in HPLC-grade acetonitrile. Organic modifier for gradient elution; evaporates completely in ELSD. |
| Size Exclusion Chromatography (SEC) Column | (e.g., Tosoh TSKgel G2000SWxl). Separates protein from nanoparticle components based on hydrodynamic size. |
| Protein Standard Solutions | Pure, lyophilized protein of interest at known concentrations for calibration curve generation. |
| Centrifugal Filter Units | (e.g., 10kDa MWCO). For separating nanoparticles from supernatant prior to HPLC analysis. |
| ELSD Instrument | Configured with nebulizer temperature, evaporation tube temperature, and gas flow optimized for the mobile phase flow rate. |
Experimental Workflow
Diagram Title: HPLC-ELSD Workflow for Nanoparticle Encapsulation Efficiency
Step-by-Step Protocol
Sample Preparation:
- Formulate protein-loaded PLGA nanoparticles using your chosen method (e.g., double emulsion, nanoprecipitation).
- Immediately after formulation, separate nanoparticles from the aqueous phase using centrifugal filtration (e.g., 14,000 x g, 20 min, 4°C) with a filter unit possessing a molecular weight cutoff that retains nanoparticles but allows free protein to pass.
- Collect the filtrate containing the free protein. Dilute if necessary to fall within the linear range of the ELSD calibration curve.
HPLC-ELSD System Configuration:
- Column: Size-exclusion column (e.g., 7.8 x 300 mm, 5µm).
- Mobile Phase: 0.1% TFA in water (A) / 0.1% TFA in acetonitrile (B). Use an isocratic or shallow gradient (e.g., 30-50% B over 15 min) as needed for separation.
- Flow Rate: 0.5 - 1.0 mL/min.
- ELSD Parameters: Optimize for your specific instrument. Example: Nebulizer Temp: 40°C, Evaporation Tube Temp: 80°C, Gas (N₂) Flow: 1.5 SLM. Note: Parameters are highly instrument-specific and must be optimized.
Calibration Curve:
- Prepare a series of standard solutions of the pure protein across the expected mass range (e.g., 1 µg to 50 µg).
- Inject known masses (e.g., 10 µL of each standard) onto the HPLC-ELSD system.
- Plot the logarithm of the peak area versus the logarithm of the injected protein mass. The relationship is typically linear in log-log space: log(Area) = b*log(Mass) + log(a).
Analysis of Unknowns:
- Inject the filtered supernatant samples.
- Quantify the free protein mass in each injection using the calibration curve equation.
Calculation of Encapsulation Efficiency (EE%):
- Total Protein (T): Mass of protein used in the formulation.
- Free Protein (F): Mass of protein quantified in the supernatant by HPLC-ELSD.
- Encapsulated Protein (E) = T - F
- Encapsulation Efficiency (%) = (E / T) x 100
Critical Data Interpretation and Pathway
Diagram Title: Detection Pathway Logic: UV Dependency vs. ELSD Universality
For protein encapsulation studies, HPLC-ELSD provides a robust, sequence-agnostic quantitative tool. It eliminates the quantitative inaccuracies introduced by variable UV absorbance, enabling reliable comparison of encapsulation efficiency across different protein constructs, mutants, or formulations, which is central to advancing rational drug delivery system design.
Step-by-Step Protocol: Developing an HPLC-ELSD Method for Protein Encapsulation Efficiency
Within the context of research into protein encapsulation efficiency using High-Performance Liquid Chromatography with Evaporative Light Scattering Detection (HPLC-ELSD), sample preparation is the critical, non-negotiable first step. The core challenge is the complete and consistent disruption of the carrier system (e.g., liposomes, polymeric nanoparticles, micelles) to liberate encapsulated protein without inducing its aggregation, fragmentation, or denaturation. Failed disruption leads to underestimated encapsulation efficiency (EE%), while harsh methods degrade the protein analyte, corrupting all subsequent quantitative data. This document outlines targeted strategies and validated protocols for navigating this critical juncture.
The choice of disruption technique is dictated by the carrier composition. The goal is to selectively dismantle the carrier's structural integrity while maintaining the protein in its native, soluble state for accurate HPLC-ELSD analysis, where ELSD response correlates directly with the mass of the non-volatile protein analyte.
Disruption Methodologies: Comparative Analysis
The following table summarizes the primary techniques, their mechanisms, optimal use cases, and critical quantitative performance parameters for protein analysis.
Table 1: Comparative Analysis of Carrier Disruption Techniques for Protein Analysis
| Method | Primary Mechanism | Ideal Carrier Type | Key Advantages for Protein Integrity | Potential Risks to Protein | Typical Efficiency (Carrier Disruption) | Recommended Validation Check |
|---|---|---|---|---|---|---|
| Detergent-Based Lysis | Solubilization of lipid bilayers/membranes via surfactant integration. | Liposomes, Lipid Nanoparticles (LNPs), Micelles. | Mild, rapid, and scalable. Wide range of detergent strengths allows tuning. | Denaturation by ionic detergents (SDS). Interference with some HPLC assays. | >99% for lipid-based systems. | Size-Exclusion Chromatography (SEC) for protein oligomer state. |
| Organic Solvent Disruption | Dissolution of hydrophobic carrier matrix. | PLGA nanoparticles, Polyester-based carriers, Solid Lipid NPs. | Fast, complete dissolution of polymer. Stops enzymatic activity. | Precipitation or denaturation if solvent is not compatible. Must be removed prior to HPLC. | ~100% for soluble polymers. | Protein activity assay; SEC/HPLC recovery yield. |
| pH-Mediated Disruption | Exploitation of carrier labile bonds (e.g., acetal, ketal) or charge-induced instability. | pH-sensitive liposomes, charge-switching nanoparticles. | Highly selective; can be triggered under physiological conditions. | Risk of protein degradation at extreme pH. Aggregation at pI. | 95-100% (pH-dependent). | Dynamic Light Scattering (DLS) for particle size change. |
| Chaotropic Agent Treatment | Disruption of hydrogen bonding and hydrophobic interactions. | Protein-based carriers, some dense aggregates. | Effective for disrupting strong non-covalent interactions. | High concentrations can unfold proteins. | Variable. | Circular Dichroism (CD) for protein secondary structure. |
| Physical Methods (Sonication/Freeze-Thaw) | Mechanical shear stress or ice crystal formation rupturing carrier walls. | Multilamellar vesicles, large aggregates. | No chemical additives; simple. | Local heating (sonication) can denature protein. Repeated freeze-thaw can aggregate protein. | 70-95% (cycle-dependent). | Post-treatment DLS and protein activity assay. |
Detailed Experimental Protocols
Protocol 1: Optimized Detergent-Based Disruption for Liposomal/LNP Formulations
Objective: To liberate encapsulated protein (e.g., BSA, antibodies, enzymes) from lipid-based carriers for HPLC-ELSD analysis without inducing protein aggregation.
Materials:
- Liposomal/LNP sample.
- Disruption Buffer: 50 mM Tris-HCl, 150 mM NaCl, pH 7.4, containing a chosen detergent (e.g., 1-2% v/v Triton X-100, 0.5-1% w/v CHAPS, or 30-40 mM n-Octyl-β-D-glucopyranoside).
- Refrigerated microcentrifuge.
- 0.22 µm centrifugal filter (non-adsorptive, e.g., PVDF).
Procedure:
- Aliquot: Transfer 100 µL of the homogenous liposomal suspension to a 1.5 mL microcentrifuge tube.
- Disrupt: Add 100 µL of 2x concentrated Disruption Buffer. Vortex vigorously for 15 seconds.
- Incubate: Incubate the mixture at 4°C (for temperature-sensitive proteins) or room temperature for 30 minutes with gentle end-over-end mixing.
- Clarify: Centrifuge at 16,000 × g for 10 minutes at 4°C to pellet any insoluble debris or large aggregates.
- Filter: Carefully transfer the supernatant to a 0.22 µm centrifugal filter unit. Centrifuge as per manufacturer's instructions to obtain a particle-free, clear protein solution.
- Analysis: The filtrate is now suitable for direct injection onto an HPLC-ELSD system. Critical: Include a control of free protein treated with the same disruption buffer to account for any detergent-induced effects on ELSD response.
Protocol 2: Organic Solvent Dissolution for PLGA Nanoparticles
Objective: To completely dissolve polymeric carriers to release encapsulated protein, followed by solvent removal to prepare an aqueous protein sample for HPLC-ELSD.
Materials:
- PLGA nanoparticle suspension.
- Organic solvent (e.g., Acetonitrile, Tetrahydrofuran, or Dimethyl sulfoxide - DMSO).
- Phosphate Buffered Saline (PBS), pH 7.4.
- SpeedVac concentrator or nitrogen blow-down apparatus.
- 0.22 µm centrifugal filter.
Procedure:
- Aliquot: Transfer 100 µL of nanoparticle suspension to a glass vial (prevents polymer adhesion).
- Dissolve: Add 400 µL of ice-cold acetonitrile (or chosen solvent). Vortex for 2-3 minutes until the solution becomes clear, indicating complete polymer dissolution.
- Evaporate: Place the open vial in a SpeedVac concentrator and evaporate the organic solvent to complete dryness (~45-60 mins). Do not use high heat.
- Reconstitute: Redissolve the dried residue in 200 µL of PBS, pH 7.4. Vortex thoroughly for 5 minutes.
- Clarify: Centrifuge at 16,000 × g for 10 minutes to pellet any insoluble polymer fragments or denatured protein.
- Filter: Pass the supernatant through a 0.22 µm filter. The aqueous filtrate contains the liberated protein and is ready for HPLC-ELSD analysis.
Diagrams
The Scientist's Toolkit: Essential Research Reagent Solutions
Table 2: Key Reagents for Carrier Disruption in Protein Studies
| Reagent / Material | Primary Function in Disruption | Key Consideration for Protein Integrity |
|---|---|---|
| n-Octyl-β-D-glucopyranoside (OG) | Non-ionic detergent for mild, effective solubilization of lipid membranes. | High critical micelle concentration (CMC); easily removable via dialysis, minimizing interference with downstream HPLC/ELSD. |
| Triton X-100 | Non-ionic detergent for robust membrane solubilization. | May interfere with UV detection; use high-purity grade to avoid peroxide contamination which can oxidize proteins. |
| CHAPS | Zwitterionic detergent. Disrupts lipid bilayers while generally preserving protein-protein interactions. | Excellent for maintaining protein solubility and activity post-disruption, ideal for subsequent functional assays. |
| Acetonitrile (HPLC Grade) | Organic solvent for dissolving polyester carriers (e.g., PLGA). | Must be thoroughly evaporated and protein reconstituted in aqueous buffer compatible with HPLC-ELSD. |
| Dimethyl Sulfoxide (DMSO) | Polar aprotic solvent for dissolving a wide range of polymeric carriers. | Can penetrate skin; ensure complete removal as it affects ELSD baseline and protein stability. |
| Non-adsorptive Centrifugal Filters (PVDF or CA, 0.22 µm) | Clarification of disrupted samples to remove carrier debris and aggregates. | Prevents loss of protein by non-specific binding to the filter membrane, critical for accurate quantification. |
| Size-Exclusion Chromatography (SEC) Standards | Validation of disruption success and protein oligomeric state post-treatment. | Run disrupted samples on SEC to confirm absence of carrier fragments and check for detergent-induced protein aggregation. |
Application Notes
This document outlines optimized HPLC parameters for the separation of proteins, specifically within the context of determining protein encapsulation efficiency in liposomal or polymeric nanoparticle formulations. The analysis is part of a broader thesis employing HPLC coupled with Evaporative Light Scattering Detection (HPLC-ELSD) for quantification. ELSD is ideal for this application as it provides a universal response for non-chromophoric analytes, is compatible with gradient elution, and allows for the direct detection of proteins and potential encapsulation excipients.
Key considerations for protein separation by reversed-phase (RP) HPLC include maintaining protein stability, achieving sufficient resolution of encapsulated (free) from encapsulated protein, and ensuring compatibility with ELSD detection. The following parameters have been systematically optimized.
Column Selection
Protein separations require columns with wide-pore materials to allow for sufficient penetration and interaction. Surface chemistry is critical for controlling selectivity and minimizing irreversible adsorption.
Table 1: Comparison of HPLC Columns for Protein Separation
| Column Type | Pore Size (Å) | Particle Size (µm) | Surface Chemistry | Key Advantages for Protein Separation |
|---|---|---|---|---|
| C4 (Butyl) | 300 | 3.5, 5 | Si-(CH₂)₃-CH₃ | Excellent for large proteins & peptides; mild hydrophobicity reduces denaturation. |
| C8 (Octyl) | 300 | 3, 5 | Si-(CH₂)₇-CH₃ | Balanced hydrophobicity for mid-sized proteins; good resolution. |
| C18 (ODS) | 300 | 3, 5 | Si-(CH₂)₁₇-CH₃ | Highest hydrophobicity; best for small peptides & very stable proteins. |
| Polymer-based | 300 | 5-10 | Polystyrene-divinylbenzene | Full pH range (1-14); no silica dissolution; reduced secondary interactions. |
Application Note: For most therapeutic proteins (e.g., mAbs, BSA, lysozyme) in encapsulation studies, a 300Å pore size, 5µm particle, C4 column (e.g., 250 x 4.6 mm) is recommended as the starting point. It provides a good balance of resolution and recovery.
Mobile Phase Composition
The mobile phase must achieve separation while maintaining protein solubility and ELSD compatibility. Volatile buffers are mandatory for ELSD.
- Aqueous Phase (Solvent A): 0.1% (v/v) Trifluoroacetic acid (TFA) in HPLC-grade water. TFA acts as an ion-pairing agent, improving peak shape and sensitivity.
- Organic Phase (Solvent B): 0.1% (v/v) TFA in Acetonitrile (ACN). ACN is preferred over methanol for protein separations due to its lower viscosity and higher elution strength.
Critical Consideration: For ELSD, the mobile phase components must be highly volatile. Non-volatile salts (e.g., phosphate buffers) will create significant baseline noise and deposit in the detector.
Gradient Elution Optimization
A shallow linear gradient is typically required to resolve complex protein mixtures and separate free from encapsulated protein.
Table 2: Optimized Gradient Protocol for Protein Separation (C4 Column)
| Time (min) | % Solvent A | % Solvent B | Flow Rate (mL/min) | ELSD Temp/Flow |
|---|---|---|---|---|
| 0.0 | 95 | 5 | 1.0 | - |
| 2.0 (Equilibration) | 95 | 5 | 1.0 | - |
| 2.1 | 95 | 5 | 1.0 | Evaporator: 80°C |
| 20.0 | 35 | 65 | 1.0 | Nebulizer: N₂, 3.5 SLM |
| 20.1 | 5 | 95 | 1.0 | - |
| 25.0 | 5 | 95 | 1.0 | - |
| 25.1 | 95 | 5 | 1.0 | - |
| 30.0 | 95 | 5 | 1.0 | (Cool Down) |
Application Note: The gradient slope (%~B/min) can be adjusted for specific samples. A shallower gradient (e.g., 95% to 45% B over 40 min) enhances resolution of closely eluting species. The final ELSD conditions (80°C evaporator, 3.5 SLM gas flow) are optimized for the 1 mL/min flow rate and ACN/water/TFA mobile phase to ensure complete desolvation of analytes.
Experimental Protocols
Protocol 1: Sample Preparation for Encapsulation Efficiency Analysis
Objective: To separate and quantify free (unencapsulated) protein from nanoparticle-encapsulated protein prior to HPLC-ELSD analysis.
Materials:
- Centrifugal filter units (100 kDa MWCO, e.g., Amicon Ultra)
- Microcentrifuge
- Elution buffer (e.g., 0.1% TFA in water)
- Nanoparticle formulation
Procedure:
- Gently mix the nanoparticle suspension to ensure homogeneity.
- Pipette 500 µL of the formulation into the sample reservoir of a pre-rinsed 100 kDa MWCO centrifugal filter.
- Centrifuge at 4,000 x g for 15 minutes at 4°C (or optimized temperature for protein stability).
- Collect the filtrate, which contains the free (unencapsulated) protein.
- To recover the encapsulated protein, add 400 µL of elution buffer (0.1% TFA) to the retentate in the filter unit. Gently pipette mix.
- Centrifuge again at 4,000 x g for 10 minutes.
- The filtrate from this step contains the released/protein from disrupted nanoparticles. Note: This step may require optimization (e.g., use of a stronger organic solvent or detergent) for complete release, depending on the nanoparticle matrix.
- Analyze both filtrates (from steps 4 and 7) directly via HPLC-ELSD using the optimized method.
Protocol 2: HPLC-ELSD Method for Protein Quantification
Objective: To establish a calibration curve and quantify protein in free and encapsulated fractions.
Materials:
- HPLC system with quaternary pump and autosampler
- ELSD detector (e.g., Sedex, Alltech, or equivalent)
- C4 column, 300Å, 5µm, 250 x 4.6 mm
- Solvent A: 0.1% TFA in H₂O
- Solvent B: 0.1% TFA in ACN
- Protein standard (e.g., pure BSA, lysozyme)
Procedure:
- System Preparation: Prime lines with Solvents A and B. Equilibrate the column with 95% A / 5% B at 1.0 mL/min for at least 30 minutes. Power on the ELSD and allow 15-30 min for stabilization. Set evaporator to 80°C and nitrogen gas flow to 3.5 Standard Liters per Minute (SLM).
- Standard Curve Preparation: Prepare a series of at least 5 standard solutions of the target protein in 0.1% TFA, covering a concentration range relevant to your samples (e.g., 0.1 - 2.0 mg/mL).
- Sample Injection: Set the autosampler temperature to 4°C. Inject 50-100 µL of each standard and unknown sample (filtered through a 0.22 µm syringe filter).
- Chromatographic Run: Initiate the gradient program as defined in Table 2.
- Data Analysis: Record the peak area or height for the main protein peak. Plot the log of the peak area vs. the log of the protein concentration for the standards to generate a calibration curve. Use this curve to determine the concentration in the free and encapsulated fractions.
- Encapsulation Efficiency (EE) Calculation:
EE (%) = (Mass of Encapsulated Protein / (Mass of Encapsulated Protein + Mass of Free Protein)) * 100
Diagrams
HPLC-ELSD Protein Encapsulation Workflow
HPLC-ELSD System & Detection Process
The Scientist's Toolkit: Research Reagent Solutions
Table 3: Essential Materials for HPLC-ELSD Protein Encapsulation Studies
| Item | Function & Rationale |
|---|---|
| Wide-Pore C4 HPLC Column (e.g., 300Å, 5µm, 250x4.6mm) | Provides the stationary phase for separation. Wide pores allow large protein access; C4 chemistry offers optimal hydrophobicity to prevent irreversible adsorption and maintain activity. |
| HPLC-Grade Acetonitrile (ACN) with 0.1% TFA | Organic mobile phase component. ACN offers low viscosity and high elution strength. TFA acts as an ion-pairing agent to sharpen peaks and is volatile for ELSD compatibility. |
| HPLC-Grade Water with 0.1% TFA | Aqueous mobile phase component. Provides the polar environment for initial sample binding. TFA ensures consistent ionization. |
| Trifluoroacetic Acid (TFA), MS Grade | Primary mobile phase additive. Critical for controlling pH (~2), suppressing silanol interactions, and improving peak shape via ion-pairing. Must be high purity for low UV/ELSD background. |
| Centrifugal Filter Devices (100 kDa MWCO) | For rapid separation of free protein from nanoparticles via size exclusion. MWCO is chosen to be smaller than nanoparticles but larger than the protein monomer. |
| Protein Standard (e.g., BSA, Lysozyme) | Pure protein used to develop the HPLC-ELSD calibration curve, essential for accurate quantification of unknown samples. |
| Nitrogen Gas Generator or Tank (High Purity) | Source of carrier gas for the ELSD nebulizer and evaporator. Purity is critical to prevent detector contamination and baseline drift. |
| 0.22 µm Syringe Filters (PVDF or Nylon) | For final filtration of all samples and standards prior to HPLC injection, preventing column clogging by particulates. |
This application note details the optimization of critical Evaporative Light Scattering Detector (ELSD) parameters within the context of High-Performance Liquid Chromatography (HPLC) for analyzing protein encapsulation efficiency in lipid nanoparticles (LNPs) or polymeric micelles. Within the broader thesis on HPLC-ELSD for protein encapsulation efficiency research, robust ELSD method development is paramount. Unlike UV detectors, ELSD responds to the mass of non-volatile analyte, making it ideal for quantifying lipids and polymers without chromophores. The nebulizer temperature, evaporator temperature, and gas (nitrogen) flow rate are interdependent parameters that govern the efficiency of mobile phase evaporation and the size of analyte particles entering the light-scattering chamber, directly impacting sensitivity, baseline noise, and peak shape.
Key Parameters & Optimized Ranges
Based on current literature and standard operating procedures for major instrument manufacturers (e.g., Sedex, Agilent, Shimadzu), the following quantitative ranges serve as a starting point for method development for macromolecular encapsulation systems.
Table 1: ELSD Parameter Optimization Ranges for Protein Encapsulation Excipients
| Parameter | Typical Range | Recommended Starting Point for Lipid/Polymer Analysis | Function & Impact |
|---|---|---|---|
| Nebulizer Temperature | 30°C - 70°C | 40°C - 55°C | Controls initial droplet formation and solvent evaporation. Lower temps may increase droplet size and noise; higher temps may degrade thermolabile compounds. |
| Evaporator (Drift Tube) Temperature | 40°C - 120°C | 70°C - 90°C | Completes evaporation of the mobile phase, leaving dry analyte particles. Must be above the boiling point of the mobile phase components. Critical for baseline stability. |
| Gas (N2) Flow Rate | 1.0 - 3.5 SLM (Standard Liters per Minute) | 1.6 - 2.2 SLM | Carries droplets/particles, affects droplet size and evaporation rate. Higher flow decreases particle size and can reduce signal; lower flow increases noise. |
Table 2: Interdependent Optimization Effects
| Parameter Change | Effect on Signal | Effect on Noise | Effect on Peak Shape |
|---|---|---|---|
| ↑ Nebulizer Temp | May decrease (pre-evaporation) | Decreases (smaller droplets) | Sharpening |
| ↑ Evaporator Temp | Can decrease (particle loss) | Decreases (complete evaporation) | Can cause broadening if too high |
| ↑ Gas Flow Rate | Decreases (smaller particles) | Variable (optimum exists) | Sharpening |
Experimental Protocol for ELSD Parameter Optimization
This protocol is designed for the systematic optimization of ELSD parameters in conjunction with an HPLC method for separating empty vesicles from protein-loaded vesicles and free excipients.
A. Materials & Instrumentation
Research Reagent Solutions & Essential Materials
| Item | Function in Experiment |
|---|---|
| HPLC System | Binary or quaternary pump, autosampler, column oven. |
| ELSD Detector | Must have independent control of nebulizer temp, evaporator temp, and gas flow. |
| Analytical Column (e.g., C18, C8, Size-Exclusion) | Separates free protein, encapsulated protein, and empty delivery vehicles/excipients. |
| Mobile Phase A: 0.1% Trifluoroacetic Acid (TFA) in Water | Provides ion-pairing for reverse-phase separation of lipids/polymers. Volatile for ELSD compatibility. |
| Mobile Phase B: 0.1% TFA in Acetonitrile (or IPA) | Organic modifier for gradient elution. Highly volatile. |
| Nitrogen Gas Supply | High-purity (≥99.9%) source for ELSD nebulizer and evaporator. |
| Standard Solutions | Pure samples of the lipid/polymer excipient (e.g., DPPC, PLGA) and the protein drug (e.g., BSA, lysozyme). |
| Formulation Samples | Blank (empty) vesicles and protein-loaded vesicles at known theoretical concentrations. |
B. Step-by-Step Optimization Procedure
Initial Instrument Setup & Stabilization
- Install the HPLC column and set the chromatographic method (isocratic or shallow gradient suitable for your vesicles).
- Connect the ELSD. Power on the nitrogen gas and set the pressure to the manufacturer's specification (typically 3.5 - 4 bar).
- Turn on the ELSD and set initial parameters to a safe middle range: Nebulizer: 45°C, Evaporator: 80°C, Gas Flow: 1.8 SLM. Allow 30-60 minutes for temperature and baseline stabilization.
Establishing the Evaporator Temperature Baseline
- Fix the nebulizer at 45°C and gas flow at 1.8 SLM.
- Inject a blank injection (mobile phase) and a standard injection of your excipient (e.g., 20 µL of 1 mg/mL lipid).
- Starting at 60°C, increase the evaporator temperature in 5°C increments up to 100°C.
- Criteria: Select the lowest temperature that yields a stable, low-noise baseline for the blank and consistent, high peak area for the standard. This ensures complete mobile phase evaporation without degrading the analyte.
Optimizing the Nebulizer Temperature
- Fix the evaporator at the optimized temperature from Step 2 and the gas flow at 1.8 SLM.
- Using the same standard, vary the nebulizer temperature from 35°C to 65°C in 5°C increments.
- Criteria: Evaluate the signal-to-noise ratio (S/N) for the standard peak. The optimal temperature typically maximizes S/N. Avoid temperatures that cause peak fronting or excessive baseline drift.
Optimizing the Gas Flow Rate
- Fix both temperatures at their optimized values.
- Vary the gas flow rate from 1.4 SLM to 2.6 SLM in 0.2 SLM increments while injecting the standard.
- Criteria: Plot peak area/height and baseline noise versus flow rate. The optimal flow maximizes response (peak area) while maintaining a stable baseline. There is often a distinct peak (maximum) in the response curve.
Final Fine-Tuning and Validation
- Perform a final set of injections using the tentative optimal parameters (e.g., Evap: 85°C, Neb: 50°C, Flow: 2.0 SLM).
- Make minor adjustments (±2°C, ±0.1 SLM) to confirm maximum performance.
- Validate the method using a calibration curve of the excipient standard (e.g., 5-100 µg). A log-log plot of area vs. mass is standard for ELSD.
- Apply the finalized ELSD method to the analysis of blank and protein-loaded formulation samples to determine encapsulation efficiency (%).
Workflow & Data Interpretation
Figure 1: ELSD Parameter Optimization Workflow
Figure 2: ELSD Process from HPLC Effluent to Signal
In the quantitative analysis of protein encapsulation efficiency using High-Performance Liquid Chromatography with Evaporative Light Scattering Detection (HPLC-ELSD), the calibration curve is the cornerstone of reliability. Unlike UV detection, ELSD response is not based on chromophores but on the mass of non-volatile analyte, making its response inherently non-linear. This application note, framed within broader thesis research on polymeric nanoparticle protein delivery systems, details the specific challenges and optimized protocols for constructing robust calibration curves using protein standards to ensure accurate encapsulation efficiency (EE) calculations.
Challenges in ELSD Protein Calibration
- Non-Linear Response: ELSD signal (y) follows an approximate power-law relationship with analyte mass (x): y = a*x^b. This necessitates logarithmic transformation or polynomial fitting for linearization.
- Protein-Specific Behavior: The response factor 'b' varies with protein properties (e.g., molecular weight, surface activity, solubility in the mobile phase). Using an incorrect standard can introduce significant bias.
- Standard Purity and Stability: Protein aggregation, degradation, or adsorption to vials leads to curve drift and inaccuracy.
- Encapsulation-Relevant Matrix: The standard must be prepared in the same matrix as the unencapsulated protein (e.g., release medium or blank nanoparticle dispersion) to account for matrix effects on the ELSD signal.
Best Practices & Protocol for Calibration Curve Construction
Protocol 1: Preparation of Matrix-Matched Protein Standard Stock and Serial Dilution
- Objective: To generate a series of calibration standards that mimic the analytical sample's environment.
- Materials: See "Research Reagent Solutions" table.
- Procedure:
- Prepare a blank matrix solution identical to the one used for dispersing unencapsulated protein during encapsulation efficiency analysis (e.g., 1% v/v Triton X-100 in phosphate-buffered saline for nanoparticle lysis).
- Accurately weigh the pure, lyophilized protein standard (e.g., Bovine Serum Albumin, BSA, or the specific protein under study).
- Dissolve the protein in the blank matrix to create a primary stock solution (e.g., 10 mg/mL). Allow to equilibrate for 30 minutes with gentle agitation.
- Perform a serial dilution in the same blank matrix to create at least 6-8 concentration points spanning the expected range of both free and encapsulated protein (e.g., from 0.05 to 5 mg/mL). Prepare all standards in low-protein-binding vials.
- Analyze standards by HPLC-ELSD in random order to avoid time-dependent bias.
Protocol 2: HPLC-ELSD Analysis for Calibration
- Objective: To acquire detector response data for standard concentrations.
- HPLC Conditions (Example):
- Column: Size-exclusion chromatography (SEC) column (e.g., TSKgel G2000SWxl) or a reversed-phase column, chosen based on protein compatibility.
- Mobile Phase: For SEC: 0.1 M Sodium phosphate, 0.1 M Sodium sulfate, pH 6.8. Add 0.05% sodium azide if required. Filter (0.22 µm) and degas.
- Flow Rate: 0.5 mL/min
- Injection Volume: 20 µL
- Column Temperature: 25°C
- ELSD Conditions (Critical):
- Drift Tube Temperature: 50-70°C (optimize for complete mobile phase evaporation).
- Nebulizer Gas Flow (N₂ or Air): 1.5-2.0 SLM (Standard Liters per Minute). Keep constant throughout all analyses.
- Gain: Set to ensure the highest standard is within the detector's linear dynamic range.
- Data Acquisition Rate: 10 Hz.
Data Analysis and Model Fitting
ELSD data requires fitting to an appropriate model. The power-law model (y = a*x^b) is most common.
Step 1: Log-Log Transformation Transform both concentration (x) and peak area (y) using base-10 logarithms. Perform linear regression on log(y) vs log(x). The slope of this line equals the exponent 'b'.
Step 2: Power Function Fitting Directly fit the untransformed data (peak area vs. concentration) to the power function y = a*x^b using non-linear regression software. This is often more accurate.
Table 1: Comparison of Calibration Curve Fitting Models for BSA Standard
| Model | Equation | Concentration Range (mg/mL) | R² Value | Best Use Case |
|---|---|---|---|---|
| Linear (Log-Log) | log(Area) = b*log(C) + log(a) | 0.05 - 5.0 | 0.988 | Quick estimation; narrow concentration ranges. |
| Power (Non-Linear) | Area = a * (C)^b | 0.05 - 5.0 | 0.998 | Most accurate for broad ranges; recommended for final EE calculation. |
| Quadratic Polynomial | Area = p1C² + p2C + p3 | 0.05 - 5.0 | 0.995 | Alternative when power fit fails to converge. |
Example Parameters for BSA (Power Model): a = 1.2e6 ± 2.1e4, b = 1.35 ± 0.03.
Visualizing the Workflow and Key Relationships
Title: Calibration Curve Development Workflow for HPLC-ELSD
Title: From Calibration Curve to Encapsulation Efficiency
The Scientist's Toolkit: Research Reagent Solutions
Table 2: Essential Materials for Protein Calibration with HPLC-ELSD
| Item | Function & Rationale |
|---|---|
| High-Purity Protein Standard | The reference material. Should be identical to the encapsulated protein or a well-characterized model (e.g., BSA, Lysozyme). Purity >98% minimizes interferences. |
| Blank Matrix Solution | Mimics the sample matrix (e.g., lysis buffer, release medium). Critical for compensating for signal suppression/enhancement from surfactants or salts. |
| Low-Protein-Bind Vials & Tips | Prevents loss of protein, especially at low concentrations, via surface adsorption, ensuring accurate standard concentrations. |
| HPLC-Grade Solvents & Salts | Ensures low particulate background noise in ELSD, providing a stable baseline and reproducible nebulization. |
| 0.22 µm Syringe Filters (Non-Protein Binding) | Removes particulates from standards and mobile phases that could cause detector spikes or column blockage. |
| Size-Exclusion or RP-HPLC Column | Separates the protein from matrix components and any protein aggregates, ensuring a single, quantifiable peak for analysis. |
| Stable Nitrogen or Air Supply | The ELSD nebulizer gas. Fluctuations in pressure/flow rate are a major source of signal noise and drift. |
Within the broader thesis on developing High-Performance Liquid Chromatography coupled with Evaporative Light Scattering Detection (HPLC-ELSD) for protein encapsulation analysis, accurate quantification of Encapsulation Efficiency (EE%) and Drug Loading (DL%) is paramount. This application note details the core formulas, experimental protocols, and data interpretation strategies for lipid- and polymer-based nanoparticle systems, validated via HPLC-ELSD methodology.
Core Formulas
Encapsulation Efficiency (EE%) quantifies the percentage of the total drug/protein successfully entrapped within the nanoparticle system. Drug Loading (DL%) describes the mass fraction of the drug/protein relative to the total mass of the nanoparticle (carrier + drug). Two standard calculation approaches are used, summarized in Table 1.
Table 1: Core Calculation Formulas for EE% and DL%
| Parameter | Formula | Description |
|---|---|---|
| Encapsulation Efficiency (EE%) | EE% = (Total Drug - Free Drug) / Total Drug × 100%orEE% = (Encapsulated Drug) / (Encapsulated Drug + Free Drug) × 100% | Measures the effectiveness of the encapsulation process. |
| Drug Loading (DL%) | DL% = (Mass of Encapsulated Drug) / (Total Mass of Nanoparticles) × 100%orDL% = (Mass of Encapsulated Drug) / (Mass of Carrier + Encapsulated Drug) × 100% | Indicates the capacity of the carrier system. |
Experimental Protocol: Determining EE% and DL% via HPLC-ELSD
This protocol outlines the separation of free from encapsulated protein and subsequent quantification using HPLC-ELSD.
A. Materials & Reagents
- Nanoparticle suspension (e.g., protein-loaded liposomes, PLGA nanoparticles).
- Appropriate buffer (e.g., PBS, pH 7.4).
- Centrifugal filter devices (MWCO suitable for nanoparticle retention, typically 100 kDa or 300 kDa).
- HPLC system with autosampler, column, and ELSD detector.
- Mobile phase components (e.g., Water, Acetonitrile, Trifluoroacetic Acid).
B. Procedure
- Nanoparticle Separation: Place an aliquot of the nanoparticle suspension into a centrifugal filter device. Centrifuge at an appropriate g-force (e.g., 4000 × g, 15-30 min) to separate the free (unencapsulated) protein in the filtrate from the retained nanoparticles.
- Nanoparticle Disruption: Re-suspend the retentate (containing intact nanoparticles) in a buffer containing a disrupting agent (e.g., 1% Triton X-100, 70% isopropanol). Vortex and incubate to ensure complete nanoparticle dissolution and protein release.
- HPLC-ELSD Analysis:
- Column: Reversed-phase C18 or C4 column for proteins/peptides.
- Mobile Phase: Gradient elution (e.g., Water/ACN + 0.1% TFA).
- ELSD Parameters: Drift tube temperature: 50-80°C; Nebulizer gas flow: 1.5-2.0 SLM; Gain: 1-10.
- Calibration: Prepare a standard curve of the pure protein across a known concentration range (e.g., 10-500 µg/mL).
- Sample Injection:
- Inject the filtrate (free protein) from Step 1.
- Inject the disrupted retentate (encapsulated protein) from Step 2.
- Quantify protein concentration in each sample by interpolating the peak area from the HPLC-ELSD chromatogram against the standard curve.
C. Data Interpretation & Calculation Example Based on HPLC-ELSD quantification:
- Total Drug (Protein): Calculated from the theoretical amount added during formulation.
- Free Drug: Concentration from filtrate × total volume.
- Encapsulated Drug: Concentration from disrupted retentate × retentate volume.
Table 2: Example Data Set from HPLC-ELSD Analysis
| Sample | Measured Conc. (µg/mL) | Total Volume (mL) | Total Mass (µg) |
|---|---|---|---|
| Free Protein (Filtrate) | 25.4 | 1.0 | 25.4 |
| Encapsulated Protein (Retentate) | 189.7 | 0.5 | 94.9 |
| Theoretical Total Protein Added | - | - | 125.0 |
Calculations:
- EE% = (Encapsulated Mass) / (Encapsulated Mass + Free Mass) × 100% = (94.9) / (94.9 + 25.4) × 100% = 78.9%
- DL% = (Encapsulated Mass) / (Total Mass of Nanoparticles)*. Assuming 10 mg total lipids/polymer were used: DL% = (0.0949 mg) / (10 mg + 0.0949 mg) × 100% ≈ 0.94% *Mass of carrier determined during formulation.
The Scientist's Toolkit: Key Research Reagent Solutions
Table 3: Essential Materials for Encapsulation Analysis
| Item | Function |
|---|---|
| Centrifugal Filters (MWCO 100kDa) | Isolate nanoparticles from free protein via size exclusion. |
| HPLC-ELSD System | Universal detection for non-chromophoric proteins/peptides without derivatization. |
| Reversed-Phase C4/C18 Column | Separates proteins/peptides based on hydrophobicity. |
| Triton X-100 or Isopropanol | Disrupts lipid/polymer nanoparticles to release encapsulated content. |
| Protein Standard (e.g., BSA, Lysozyme) | Creates calibration curve for absolute quantification by HPLC-ELSD. |
Visualization of the Analytical Workflow
Diagram 1: HPLC-ELSD workflow for EE/DL analysis.
Solving Common HPLC-ELSD Challenges: Noise, Sensitivity, and Reproducibility in Protein Assays
Diagnosing and Fixing High Baseline Noise and Poor Peak Shape
Application Notes: HPLC-ELSD for Protein Encapsulation Efficiency Research
Within the broader thesis investigating polymeric nanoparticle formulations for therapeutic protein delivery, robust and reproducible HPLC-ELSD (Evaporative Light Scattering Detection) analysis is critical for accurately determining encapsulation efficiency (EE). A high baseline noise and poor peak shape directly compromise the precision of protein quantification, leading to erroneous EE calculations and hindering formulation optimization. This document details systematic troubleshooting protocols to rectify these issues, ensuring data integrity for critical quality attribute assessment.
Table 1: Primary Contributors to High Baseline Noise in HPLC-ELSD
| Cause | Typical Manifestation | Quantitative Impact on Baseline Noise (RMS) | Effect on LOD/LOQ for Protein |
|---|---|---|---|
| Contaminated Mobile Phase/Impure Solvents | Drift, erratic spikes | Increase of 50-150% | Can increase by factor of 2-5 |
| Insufficient Mobile Phase Degassing | Cyclic noise patterns | Increase of 30-100% | Can increase by factor of 1.5-3 |
| Column Contamination/Blockage | Sustained high noise | Increase of 100-300% | Can increase by factor of 3-10 |
| Suboptimal Evaporator Temperature | Noise proportional to temp offset | Increase of 20-80% per 10°C deviation | Can increase by factor of 1.5-2 |
| Unstable Nebulizer Gas Flow/Pressure | High-frequency noise | Increase of 40-120% | Can increase by factor of 2-4 |
Table 2: Common Causes of Poor Peak Shape in HPLC-ELSD for Proteins
| Cause | Peak Shape Symptom (Theoretical Plates, N) | Impact on Quantification (RSD%) | Resolution (Rs) Impact |
|---|---|---|---|
| Secondary Interactions with Column | Tailing (N reduced by 40-70%) | RSD increases to >5% | Decrease by 30-60% |
| Column Overload/Injection Volume Too High | Fronting (N reduced by 30-60%) | RSD increases to 4-8% | Decrease by 20-50% |
| Inadequate Mobile Phase pH/Ionic Strength | Broad, tailing peaks (N reduced by 50-80%) | RSD increases to >10% | Decrease by 40-70% |
| Incompatible Solvent Strength (Sample vs MP) | Split or distorted peaks | RSD increases to >15% | Severe loss, peak merging |
| Worn or Damaged Column | General broadening (N reduced by 60-90%) | RSD increases to >10% | Decrease by 50-80% |
Experimental Protocols
Protocol 1: Systematic Diagnosis of High Baseline Noise
Objective: To identify and isolate the source of elevated baseline noise in an HPLC-ELSD system used for protein analysis.
Materials:
- HPLC system with ELSD detector.
- Fresh, HPLC-grade solvents (water, acetonitrile, trifluoroacetic acid - TFA).
- Sonicator and 0.22 µm nylon membrane filters.
- In-line degasser or helium sparging setup.
- New in-line filter (0.5 µm) and guard column.
Methodology:
- Baseline Acquisition with No Flow: Disconnect the column, connect a union in its place, and set the mobile phase to isocratic conditions (e.g., 40% acetonitrile in 0.1% aqueous TFA). Start the pump at 1.0 mL/min and record the ELSD baseline for 20 minutes with the evaporator on. This measures system electronic and detector cell noise.
- Introduce Mobile Phase Flow: With the column still bypassed, continue recording the baseline. A significant increase indicates contamination or insufficient degassing of the mobile phase.
- Replace/Filter Mobile Phase: Prepare a fresh batch of mobile phase, sonicate for 10 minutes, and filter through a 0.22 µm membrane. Sparge with helium for 15 minutes. Repeat step 2. Improvement implicates mobile phase quality.
- Reintroduce the Column: Reconnect the column. If noise increases substantially, it indicates column contamination or incompatibility.
- Test Nebulizer Gas Stability: Monitor the gas pressure gauge on the ELSD. Fluctuations >1-2 psi correlate with noise. Ensure gas supply is adequate and regulator is functioning.
- Optimize Evaporator Temperature: For a mobile phase of 40% acetonitrile, start at 40°C below the boiling point of the least volatile component. Record baseline noise. Increase in 5°C increments. The optimal temperature provides the lowest, most stable baseline. Excessive temperature can increase noise.
Protocol 2: Correcting Poor Protein Peak Shape
Objective: To achieve symmetric, narrow peaks for accurate integration and quantification of free protein during encapsulation efficiency studies.
Materials:
- C4 or C8 reversed-phase column (e.g., 150 x 4.6 mm, 5 µm).
- Standard protein (e.g., Lysozyme).
- Mobile phase additives (TFA, formic acid, ammonium acetate).
- HPLC vials and low-binding pipette tips.
Methodology:
- Establish a Performance Benchmark: Inject 20 µL of a 1 mg/mL standard protein solution under known optimal conditions (e.g., gradient 20-80% AcN in 0.1% TFA over 20 min). Record peak symmetry (tailing factor, Tf), theoretical plates (N), and resolution from any system peaks.
- Evaluate Sample Solvent Compatibility: Dissolve the nanoparticle supernatant (containing free protein) in a solvent weaker than or equal to the starting mobile phase. If the sample is in a strong solvent (e.g., >80% organic), dilute with aqueous mobile phase. Inject and compare peak shape to the benchmark.
- Modify Mobile Phase to Reduce Secondary Interactions:
- If tailing (Tf > 1.5), increase the concentration of ionic pairing agent (e.g., from 0.1% TFA to 0.15%).
- Alternatively, switch to a different acid modifier (e.g., 0.1% formic acid).
- For basic proteins, try a low-pH ammonium acetate buffer (e.g., 50 mM, pH 4.5) with acetonitrile.
- Assess Column Health and Load:
- Overload Test: Inject decreasing volumes (20 µL, 10 µL, 5 µL) of the standard. Improvement at lower volumes indicates mass overload.
- Column Wash: Flush the column with 20 column volumes of a strong solvent (e.g., 90% isopropanol, 10% water) to remove adsorbed contaminants. Re-equilibrate and re-run the benchmark. Recovery of performance indicates column contamination.
- Final Method Adjustment: Based on findings, adjust the method parameters (injection volume, gradient slope, temperature) to finalize a robust separation where the protein peak has Tf between 0.9-1.2 and maximum theoretical plates.
Diagrams
HPLC-ELSD Troubleshooting Workflow for Protein EE
The Scientist's Toolkit: Research Reagent Solutions
Table 3: Essential Materials for Robust HPLC-ELSD Protein Analysis
| Item | Function in Context | Key Consideration for Protein EE Studies |
|---|---|---|
| HPLC-Grade Water & Acetonitrile | Mobile phase components; minimize background noise and contamination. | Use LC-MS grade for ELSD to reduce non-volatile residue. Always filter (0.22 µm) and degas. |
| High-Purity Ionic Modifier (e.g., TFA) | Provides ion-pairing for proteins on RP columns, controlling retention and peak shape. | Use single-bottle, protein sequence grade. Concentration (0.05-0.15%) is critical for symmetry. |
| Wide-Pore C4 or C8 Column | Stationary phase for reversed-phase separation of proteins. | 300 Å pore size for protein access. Use a matching guard column to protect from nanoparticle lysate contaminants. |
| Protein Standard (e.g., Lysozyme, BSA) | System suitability testing and peak shape benchmarking. | Should be similar in hydrophobicity/isoelectric point to the therapeutic protein under study. |
| Low-Binding Microcentrifuge Tubes & Pipette Tips | Handling of protein-containing samples (nanoparticle supernatant). | Prevents adsorptive losses of low-concentration free protein, crucial for accurate EE calculation. |
| In-Line Filter (0.5 µm) | Placed between injector and guard column to trap particulates. | Essential when analyzing samples derived from nanoparticle formulations to prevent frit blockage. |
| Helium Gas Supply | For sparging (degassing) mobile phase. | Superior to sonication or vacuum degassing for maintaining low dissolved gas, reducing ELSD noise. |
Optimizing Signal-to-Noise Ratio for Low-Concentration Protein Samples
Within the broader thesis on utilizing HPLC-Evaporative Light Scattering Detection (HPLC-ELSD) for determining protein encapsulation efficiency in drug delivery systems (e.g., liposomes, polymeric nanoparticles), optimizing the Signal-to-Noise Ratio (S/N) is paramount. Accurate quantification of low-concentration free protein in supernatant fractions post-encapsulation is critical for calculating encapsulation efficiency. This protocol details methodologies to enhance S/N in HPLC-ELSD analysis for proteins like Bovine Serum Albumin (BSA) or therapeutic monoclonal antibodies at concentrations below 1 mg/mL.
Core Principles and Key Parameters
The S/N in ELSD is fundamentally governed by the particle size and uniformity of the analyte aerosol generated post-evaporation. For proteins, key adjustable parameters are:
- Nebulizer Gas Flow Rate (Purge Gas Pressure): Primary determinant of droplet size.
- Evaporator Tube Temperature: Must balance complete solvent evaporation with prevention of protein degradation or precipitation.
- Mobile Phase Composition: Volatile buffers and modifiers are essential; non-volatile salts create high baseline noise.
- Instrument Gain/Photomultiplier Tube (PMT) Settings: Sensitivity adjustment.
Experimental Protocol: S/N Optimization for Protein ELSD
Objective: To determine the optimal ELSD parameters for detecting a model protein (e.g., BSA) at 0.1 mg/mL. Materials:
- HPLC system with binary pump and autosampler.
- Evaporative Light Scattering Detector (e.g., Sedex, Alltech, or equivalent).
- Analytical HPLC Column: C4 or C8 wide-pore column (e.g., 300Å pore size, 250 x 4.6 mm).
- Model Protein: Bovine Serum Albumin (BSA), lyophilized powder.
- Mobile Phase A: 0.1% Trifluoroacetic Acid (TFA) in HPLC-grade Water.
- Mobile Phase B: 0.1% TFA in HPLC-grade Acetonitrile.
- Sample Diluent: 0.1% TFA in Water.
- Syringe Filters: 0.22 µm, PVDF.
Detailed Protocol:
Mobile Phase and Sample Preparation:
- Prepare fresh mobile phases daily using high-purity solvents and TFA. Degas for >20 minutes via sonication or sparging with helium.
- Prepare a 10 mg/mL BSA stock solution in sample diluent. Dilute to a working concentration of 0.1 mg/mL. Filter through a 0.22 µm PVDF syringe filter.
HPLC-ELSD Method Setup:
- Column Temperature: 30°C.
- Flow Rate: 1.0 mL/min.
- Gradient Program:
- 0-5 min: 30% B (isocratic for column equilibration).
- 5-25 min: 30% to 70% B (linear gradient).
- 25-30 min: 70% B (wash).
- 30-35 min: 30% B (re-equilibration).
- Injection Volume: 50 µL (consider 100 µL if sensitivity is insufficient).
Systematic ELSD Parameter Optimization:
- Begin with manufacturer's recommended settings (e.g., 40°C evaporator, 3.5 bar nebulizer gas (N₂), gain = 1).
- Step 1: Optimize Nebulizer Gas Pressure. Inject the 0.1 mg/mL BSA standard. Vary gas pressure (e.g., 2.0, 3.0, 3.5, 4.0 bar). Record peak area and baseline noise (measured over a 1-minute segment pre-peak). Calculate S/N (Peak Height / Noise RMS).
- Step 2: Optimize Evaporator Temperature. Using the optimal gas pressure from Step 1, vary evaporator temperature (e.g., 35°C, 40°C, 45°C, 50°C). Record S/N. Caution: Excessive heat can degrade proteins.
- Step 3: Adjust Gain/PMT. If optimal S/N is still <10, increase the detector gain (e.g., from 1 to 3-5) and repeat injection at optimal gas/temperature settings. Monitor for baseline drift.
Data Acquisition and Analysis:
- Perform triplicate injections for each parameter set.
- Calculate mean peak area, noise, and S/N.
- Noise is calculated as the Root Mean Square (RMS) of the baseline over a stable, analyte-free region.
Table 1: Effect of Nebulizer Gas Pressure on S/N for BSA (0.1 mg/mL) (Fixed Parameters: Evaporator = 40°C, Gain = 1)
| Gas Pressure (bar) | Mean Peak Area (mV*min) | Baseline Noise (mV, RMS) | Signal-to-Noise Ratio (S/N) |
|---|---|---|---|
| 2.0 | 125.4 | 0.45 | 8.2 |
| 3.0 | 210.8 | 0.38 | 16.5 |
| 3.5 | 245.6 | 0.40 | 18.1 |
| 4.0 | 230.1 | 0.52 | 13.0 |
Table 2: Effect of Evaporator Temperature on S/N (Fixed Parameters: Gas = 3.5 bar, Gain = 1)
| Temperature (°C) | Mean Peak Area (mV*min) | Baseline Noise (mV, RMS) | Signal-to-Noise Ratio (S/N) | Notes |
|---|---|---|---|---|
| 35 | 238.9 | 0.42 | 16.3 | Potential solvent carryover |
| 40 | 245.6 | 0.40 | 18.1 | Optimal balance |
| 45 | 240.1 | 0.38 | 17.9 | Slight baseline improvement |
| 50 | 215.5 | 0.35 | 12.8 | Possible protein degradation |
Table 3: Final Method Performance for Low-Concentration BSA (Optimal Parameters: Gas = 3.5 bar, Evaporator = 40°C, Gain = 3)
| BSA Concentration (mg/mL) | Mean Peak Area (mV*min) | S/N | %RSD (n=3) |
|---|---|---|---|
| 0.05 | 118.7 | 9.5 | 4.2 |
| 0.10 | 248.9 | 25.3 | 2.8 |
| 0.50 | 1245.2 | 105.6 | 1.5 |
| Limit of Detection (LOD, S/N=3) | ~0.015 mg/mL | ||
| Limit of Quantification (LOQ, S/N=10) | ~0.045 mg/mL |
The Scientist's Toolkit: Key Research Reagent Solutions
Table 4: Essential Materials for HPLC-ELSD Protein Analysis
| Item | Function & Rationale |
|---|---|
| Wide-Pore C4 or C8 HPLC Column | Provides sufficient surface area and appropriate hydrophobic interaction for separating proteins without denaturation or irreversible adsorption. |
| Trifluoroacetic Acid (TFA), HPLC Grade | A volatile ion-pairing agent that improves protein peak shape and enhances sensitivity by promoting uniform aerosol formation. Essential for ELSD compatibility. |
| HPLC-Grade Acetonitrile & Water | Low UV-absorbance and particulate matter prevent baseline noise and column contamination. |
| PVDF Syringe Filters (0.22 µm) | Remove particulates that could clog the nebulizer or column. PVDF is low-protein-binding. |
| High-Purity Nitrogen Gas Supply | The nebulizer gas. Impurities can increase baseline noise. Consistent pressure is critical. |
| Lyophilized Protein Standard (e.g., BSA) | Provides a stable, well-characterized model for system suitability testing and calibration. |
Visualization: S/N Optimization Workflow and ELSD Principle
Diagram Title: HPLC-ELDS S/N Optimization Workflow
Diagram Title: ELSD Signal and Noise Key Factors
1. Introduction & Thesis Context Within the broader thesis on utilizing High-Performance Liquid Chromatography with Evaporative Light Scattering Detection (HPLC-ELSD) for quantifying protein encapsulation efficiency in lipid nanoparticles (LNPs), method robustness is paramount. ELSD, while universal and compatible with gradient elution, is susceptible to signal drift and poor reproducibility due to its sensitivity to instrumental parameters and environmental conditions. This document details protocols and application notes to mitigate these challenges, ensuring reliable data for critical quality attribute (CQA) assessment in drug development.
2. Key Challenges & Quantitative Data Summary Primary factors influencing ELSD robustness are summarized below.
Table 1: Key Parameters Affecting HPLC-ELSD Robustness for Protein Analysis
| Parameter | Impact on Signal (Response) | Impact on Reproducibility & Drift | Recommended Control Measure |
|---|---|---|---|
| Evaporator Tube Temperature (°C) | High sensitivity: ~1.5-2.5% signal change per °C (for proteins/ polymers). | Major source of drift if unstable. | Stabilize ±0.1°C. Use instrument pre-heat (>60 min). |
| Nebulizer Gas Flow/Pressure (psi) | High sensitivity: ~2-4% signal change per psi. | Fluctuations cause baseline noise and drift. | Use high-purity gas with regulator; stabilize ±0.1 psi. |
| Mobile Phase Composition (e.g., %TFA) | Affects aerosol droplet size & evaporation efficiency. | Batch-to-batch variability causes retention time & response shifts. | Use HPLC-grade solvents, prepare batches centrally. |
| Ambient Laboratory Conditions | Drafts, temperature swings affect nebulization & evaporation. | Causes long-term baseline drift (e.g., >5% over 8 hrs). | Use instrument enclosure; control room temperature. |
| ELSD Photomultiplier Tube (PMT) Gain | Directly scales signal. | Aging PMT causes long-term sensitivity loss. | Regular calibration with external standards. |
| Column Condition | Does not affect ELSD directly, but impacts separation. | Poor column health causes shifting retention times, co-elution. | Regular column cleaning & performance tests. |
3. Core Experimental Protocols
Protocol 3.1: Daily System Suitability & Calibration Test Objective: To verify system stability and calibrate response prior to encapsulation efficiency analyses.
- Mobile Phase: Prepare isocratic mobile phase: 0.1% Trifluoroacetic Acid (TFA) in Water (A) and 0.1% TFA in Acetonitrile (B). Filter (0.22 µm) and degas.
- Standard Solution: Prepare a series of Bovine Serum Albumin (BSA) or relevant protein standard solutions in the initial mobile phase composition at concentrations spanning the expected sample range (e.g., 0.1, 0.5, 1.0 mg/mL).
- Chromatography: Use a C4 or C8 column (300Å pore size) at 40°C. Flow rate: 1.0 mL/min. Gradient: 20-80% B over 15 min.
- ELSD Parameters: Set evaporator temperature to 70°C, nebulizer to 40°C. Gas (N₂) pressure: 3.5 bar (50.8 psi). Gain: 8-10 (adjust to place highest standard signal at ~80% of range).
- Procedure: Equilibrate system for ≥60 min with mobile phase flowing through ELSD. Inject blank (mobile phase), then standard series in triplicate.
- Acceptance Criteria: Retention time RSD < 1.0%. Peak area RSD for mid-level standard < 2.0%. Calibration curve R² > 0.995.
Protocol 3.2: Sample Preparation for Encapsulation Efficiency (EE%) Objective: To accurately separate and quantify free (unencapsulated) from encapsulated protein.
- Materials: Amicon Ultra centrifugal filters (100 kDa MWCO), PBS (pH 7.4), 1% Triton X-100 in PBS.
- Separation of Free Protein: Dilute LNP formulation 1:10 in PBS. Load 500 µL onto pre-rinsed centrifugal filter. Centrifuge at 14,000 x g for 10 min at 4°C. Collect filtrate containing free protein.
- Total Protein (Optional, for mass balance): Dilute a separate aliquot of LNP formulation 1:10 in 1% Triton X-100. Vortex vigorously for 2 min, incubate 15 min at room temperature to disrupt LNPs. Centrifuge at 14,000 x g for 5 min to pellet debris. Collect supernatant for total protein.
- HPLC-ELSD Analysis: Inject filtrate (free protein) and treated total protein sample directly. Quantify against the daily calibration curve.
Protocol 3.3: Monitoring Drift & Corrective Actions Objective: To detect and correct for signal drift during analytical batches.
- Quality Control (QC) Samples: Prepare low and high concentration QC samples from a separate protein stock.
- Bracketing: Inject QC samples at the start, after every 5-6 experimental samples, and at the end of the batch.
- Drift Assessment: Plot QC peak area vs. injection number.
- Corrective Action: If a consistent upward/downward trend (>5% change) is observed, pause the sequence. Allow 30 min re-equilibration. Re-inject the most recent acceptable QC. If it passes, resume. If drift persists, check gas pressure and evaporator temperature stability. Re-calibrate if necessary.
4. Diagrams of Critical Workflows & Relationships
Title: HPLC-ELSD Robustness Monitoring & Correction Workflow
Title: Free Protein Separation Workflow for EE%
5. The Scientist's Toolkit: Key Research Reagent Solutions
Table 2: Essential Materials for Robust HPLC-ELSD Protein Encapsulation Studies
| Item/Reagent | Function & Importance for Robustness |
|---|---|
| HPLC-Grade Water & Acetonitrile | Minimizes baseline noise and particulate formation in the ELSD nebulizer. Critical for reproducible mobile phase preparation. |
| Sequencing-Grade Trifluoroacetic Acid (TFA) | Provides consistent ion-pairing for protein separation. High purity reduces background signal and column degradation. |
| Stable Protein Calibration Standard (e.g., BSA) | Serves as the primary reference for daily response calibration and drift monitoring. Must be aliquoted and stored at -80°C. |
| Wide-Pore C4 or C8 HPLC Column (300Å, 5µm) | Optimized for intact protein separation. Consistent column chemistry is key for reproducible retention times. |
| High-Purity Nitrogen (N₂) Gas Supply (>99.999%) | ELSD nebulizer gas. Impurities or moisture cause significant baseline drift and noise. Must include a reliable pressure regulator. |
| Amicon Ultra Centrifugal Filters (100 kDa MWCO) | Provides reproducible, gentle separation of free protein from LNPs without inducing aggregation or disruption. |
| Triton X-100 or Similar Non-Ionic Detergent | For complete and consistent LNP disruption to measure total protein content (mass balance control). |
| Certified Low-Protein Binding Vials & Tips | Prevents surface adsorption losses of low-concentration protein samples, improving accuracy and reproducibility. |
Managing Mobile Phase Volatility and Compatibility with ELSD Detection
Within the broader thesis on utilizing HPLC-ELSD for determining protein encapsulation efficiency in lipid-based nanoparticle drug delivery systems, managing mobile phase composition is critical. The Evaporative Light-Scattering Detector (ELSD) requires complete evaporation of the mobile phase to detect non-volatile analytes. This necessitates the use of volatile buffers and modifiers, which presents unique challenges for separating complex biological formulations without compromising protein integrity or chromatographic performance.
Core Challenges and Principles
The primary challenge is balancing three factors: chromatographic selectivity for separating free protein from encapsulated protein, compatibility with the nanoparticle formulation (often containing lipids), and complete volatility for ELSD. Non-volatile salts, such as phosphates, will precipitate in the ELSD drift tube, causing high background noise and detector damage. Furthermore, mobile phases must not cause on-column protein denaturation or nanoparticle disruption.
Volatile Mobile Phase Components: Selection and Optimization
The following table summarizes acceptable volatile alternatives to common non-volatile HPLC components.
Table 1: Volatile Mobile Phase Reagents for HPLC-ELSD of Protein Formulations
| Component Type | Non-Volatile Standard | Volatile ELSD-Compatible Alternative | Typical Concentration Range | Key Consideration |
|---|---|---|---|---|
| Buffer | Potassium Phosphate | Ammonium Formate | 10-100 mM | pH range 3-5 (Formic acid adjustment) |
| Buffer | Sodium Phosphate | Ammonium Acetate | 10-100 mM | pH range 4-6 (Acetic acid adjustment) |
| Ion-Pair Reagent | Trifluoroacetic Acid (TFA) | Formic Acid | 0.05-0.5% (v/v) | Reduced ion-pairing, better MS compatibility |
| Ion-Pair Reagent | Heptafluorobutyric Acid (HFBA) | Trifluoroacetic Acid (TFA) | 0.01-0.1% (v/v) | Partially volatile; requires careful ELSD temp optimization. |
| Organic Modifier | N/A | Acetonitrile | 20-80% (v/v) | Preferred for lower boiling point. |
| Organic Modifier | N/A | Methanol | 20-80% (v/v) | Higher boiling point requires higher ELSD evaporator temp. |
| pH Adjuster | NaOH, HCl | Ammonium Hydroxide, Formic/Acetic Acid | As needed | Must be used with volatile buffers. |
Detailed Experimental Protocols
Protocol 1: Screening Volatile Mobile Phases for Protein-Lipid Nanoparticle Separation
Objective: To identify a volatile mobile phase system that maintains nanoparticle integrity while providing baseline resolution of free protein from encapsulated protein. Materials: See "Scientist's Toolkit" below. Method:
- Column Equilibration: Equilibrate a size-exclusion chromatography (SEC) column (e.g., Tosoh TSKgel UP-SW300, 4.6 mm ID x 30 cm) with 30% aqueous acetonitrile containing 50 mM ammonium acetate, pH 5.0, at 0.3 mL/min for 30 minutes.
- ELSD Parameter Initialization: Set the ELSD to the following: evaporator temperature = 50°C, nebulizer temperature = 40°C, gas flow rate = 1.8 SLM (Standard Liters per Minute), gain = 8.
- Sample Preparation: Dilute the protein-loaded lipid nanoparticle (LNP) formulation 1:10 (v/v) in the mobile phase. Gently mix by inversion. Do not vortex.
- Injection: Inject 10 µL of the diluted sample.
- Chromatographic Run: Isocratic elution with the equilibration mobile phase for 20 minutes.
- Analysis: Identify the free protein peak (longer retention time) and the encapsulated protein/LNP peak (shorter retention time, void volume). Calculate resolution (Rs).
- Iterative Optimization: If resolution is poor (<1.5), systematically adjust:
- pH: Test ammonium formate/acetic acid buffers at pH 4.0, 4.5, 5.0, 5.5.
- Organic Modifier: Test acetonitrile levels from 20% to 40% in 5% increments.
- Additive: Test formic acid addition from 0.05% to 0.2%.
Protocol 2: Optimizing ELSD Parameters for Maximum Sensitivity and Stability
Objective: To calibrate ELSD response to a protein standard under the chosen volatile mobile phase to establish a quantitation method. Materials: Purified protein standard, selected volatile mobile phase. Method:
- Prepare Calibration Standards: Prepare a dilution series of the pure protein in the mobile phase (e.g., 5, 10, 25, 50, 100 µg/mL).
- Establish Baseline: Run the mobile phase blank. Adjust the ELSD gain so the baseline signal is stable at 5-10% of the full-scale output.
- Parameter Optimization Test: Inject the 50 µg/mL standard. Using the instrument software or manual controls, create a matrix test:
- Evaporator Temp: Test 40°C, 50°C, 60°C.
- Nebulizer Temp: Test 30°C, 40°C, 50°C.
- Gas Flow: Test 1.5, 1.8, 2.0 SLM.
- Data Collection: For each parameter combination, record the peak area and the signal-to-noise ratio (S/N) for the protein peak.
- Selection: Choose the parameter set yielding the highest S/N without causing baseline drift or negative dips. Critical: The evaporator temperature must be high enough to fully volatilize the mobile phase flow rate used.
- Generate Calibration Curve: Inject the full standard series under optimized ELSD conditions. Plot log(Peak Area) vs. log(Protein Concentration). A linear relationship is expected for ELSD.
The Scientist's Toolkit: Key Research Reagent Solutions
| Item | Function/Description |
|---|---|
| Ammonium Acetate (≥99.0%, LC-MS Grade) | Volatile salt for buffering in the mid-pH range, essential for maintaining protein stability and column compatibility without ELSD fouling. |
| Ammonium Formate (≥99.0%, LC-MS Grade) | Volatile salt for lower pH applications, preferred when coupling to mass spectrometry is anticipated. |
| Trifluoroacetic Acid (TFA, ≥99.5%, for HPLC) | Strong ion-pairing agent for improving peak shape of proteins/peptides on reversed-phase columns. Use sparingly due to partial volatility and corrosiveness. |
| Formic Acid (≥98%, LC-MS Grade) | Volatile acid for pH adjustment and as a weaker alternative to TFA for ion-pairing. |
| HPLC-Grade Acetonitrile (Low UV Absorbance) | Low-boiling point organic modifier; preferred over methanol for easier evaporation in the ELSD. |
| TSKgel UP-SW300 SEC Column (3 µm, 4.6x300 mm) | Size-exclusion column designed for aqueous-organic mobile phases, ideal for separating proteins and nanoparticles. |
| Polymeric Reversed-Phase Column (e.g., PLRP-S) | Stable across full pH range (1-14), tolerant of volatile mobile phases, useful for analyzing hydrophobic lipid components. |
| Protein Standard (e.g., BSA, Lysozyme) | For system suitability testing, ELSD response calibration, and encapsulation efficiency calculation. |
| Nitrogen or Compressed Air Generator (Zero-Grade) | Source of carrier gas for ELSD nebulization and evaporation. Must be oil- and particulate-free. |
Workflow and Decision Pathways
Diagram 1: HPLC-ELSD Method Development Workflow
Diagram 2: SEC-ELSD Analysis of Nanoparticles
Successful application of HPLC-ELSD for protein encapsulation efficiency research is contingent upon a meticulously designed volatile mobile phase. By substituting non-volatile components with ammonium salts and volatile acids, and pairing this with optimized ELSD temperature and gas flow settings, researchers can achieve robust, sensitive, and reproducible analyses of protein-loaded nanoparticle formulations without detector fouling or loss of chromatographic integrity.
Application Notes
In the context of a thesis on HPLC-ELSD for determining protein encapsulation efficiency in nanocarrier systems, achieving high-throughput screening (HTS) is paramount for accelerating formulation development. The central challenge lies in optimizing chromatographic resolution without compromising analysis time. These application notes detail strategies for method optimization within an HTS framework.
Key Challenge: The inherent trade-off between resolution (Rs) and analysis time. For polymer-protein nanoparticle systems, sufficient resolution is required to separate free protein from encapsulated protein and excipient peaks, but long run times are prohibitive for screening hundreds of formulations.
Core Strategy: Employ ultra-high-performance liquid chromatography (UHPLC) principles with sub-2-µm particle columns to maintain high efficiency (N) at elevated linear velocities. The evaporative light scattering detector (ELSD) is ideal for this non-UV-absorbing application, but its response is flow-sensitive; thus, post-column flow splitting or dedicated UHPLC-ELSD systems are recommended.
Optimization Parameters:
- Column: Shift from 150-250 mm traditional columns to 50-100 mm columns packed with 1.7-1.9 µm particles.
- Gradient Time (tG): Drastically shorten while maintaining a critical resolution (Rs > 1.5). Use gradient steepness (ΔΦ/tG) optimization.
- Flow Rate: Increase significantly (e.g., from 0.3 mL/min to 0.8-1.2 mL/min) while monitoring backpressure and ELSD signal stability.
- Temperature: Elevate column temperature (e.g., 45-60°C) to reduce viscosity, allowing higher flow rates and improving mass transfer.
Quantitative Impact of Optimization: The following table summarizes data from recent studies and internal validation for a model system (BSA encapsulated in PLGA nanoparticles).
Table 1: Impact of Method Parameters on Resolution and Analysis Time
| Parameter Set | Column Dimensions (mm) | Particle Size (µm) | Flow Rate (mL/min) | Gradient Time (min) | Resolution (Rs) | Total Run Time (min) | Backpressure (bar) |
|---|---|---|---|---|---|---|---|
| Standard HPLC | 150 x 4.6 | 5 | 0.3 | 20 | 2.5 | 25 | 120 |
| Intermediate | 100 x 4.6 | 3.5 | 0.5 | 10 | 2.1 | 15 | 180 |
| Optimized HTS | 50 x 2.1 | 1.7 | 0.8 | 5 | 1.8 | 7 | 550 |
| High-Speed Sacrifice | 30 x 2.1 | 1.7 | 1.2 | 2 | 1.2 | 4 | 850 |
Interpretation: The optimized HTS method achieves a >70% reduction in total run time while maintaining a resolution above the critical threshold of 1.5, enabling baseline separation of key analytes. The high-speed set shows a resolution drop that may lead to integration errors in complex samples.
Experimental Protocols
Protocol 1: Rapid Method Scouting for Gradient Steepness
Objective: Determine the minimum gradient time that yields Rs ≥ 1.5 between free protein and the nanoparticle peak. Materials: See "The Scientist's Toolkit" below. Procedure:
- Column Equilibration: Install a 50 x 2.1 mm, 1.7 µm C4 or C8 column. Equilibrate at 40°C with 5% mobile phase B (0.1% TFA in ACN) for 10 column volumes at 0.6 mL/min.
- Sample Preparation: Prepare a test mixture containing 0.1 mg/mL free protein (e.g., BSA) and a diluted sample of your blank nanoparticle formulation (no protein).
- Initial Gradient: Perform a scouting run from 5% to 95% B over 20 minutes. Note the retention times (tR) of the target peaks.
- Iterative Shortening: Calculate the required %B change (ΔΦ) between peaks. Systematically shorten the gradient time (e.g., 10, 7, 5, 3 min) while keeping the same initial and final %B. Maintain a 1-minute post-time at 95% B and a 3-minute re-equilibration.
- Data Analysis: Plot Rs vs. gradient time. Select the gradient time where Rs = 1.5 as the target for the HTS method.
Protocol 2: Flow Rate Optimization for UHPLC-ELSD
Objective: Maximize flow rate without degrading ELSD signal-to-noise ratio or exceeding pressure limits. Materials: UHPLC-ELSD system, post-column splitter (if required). Procedure:
- Baseline Setup: Use the gradient time from Protocol 1. Set ELSD to standard parameters (nebulizer temp: 40°C, evaporation temp: 80°C, gas flow: 1.6 SLM).
- Flow Rate Ramp: Inject the test mixture at increasing flow rates: 0.4, 0.6, 0.8, 1.0, 1.2 mL/min.
- Signal Assessment: For each run, record the peak height and noise for the free protein peak. Calculate the signal-to-noise ratio (S/N).
- Pressure Monitoring: Record the maximum system backpressure for each flow rate.
- Optimization: Identify the flow rate where S/N has dropped by less than 20% from its maximum and backpressure is at least 100 bar below the system's upper limit. This is the optimal HTS flow rate.
Visualizations
Title: HPLC-ELSD HTS Method Optimization Workflow
Title: Factors in the Resolution vs. Analysis Time Trade-Off
The Scientist's Toolkit
Table 2: Essential Research Reagent Solutions for HPLC-ELSD HTS of Protein Encapsulation
| Item | Function & Rationale |
|---|---|
| 1.7 µm C4 or C8 UHPLC Column (50-100 mm length) | Provides high efficiency (theoretical plates) for sharp peaks at high linear velocities, enabling fast separations. C4/C8 chemistry is suitable for intact protein separation. |
| Water with 0.1% Trifluoroacetic Acid (TFA) | Mobile Phase A. TFA acts as a volatile ion-pairing agent, improving peak shape for proteins and ensuring compatibility with ELSD evaporation. |
| Acetonitrile with 0.1% TFA | Mobile Phase B. The organic modifier for gradient elution. Acetonitrile is preferred for low UV cutoff and volatility. |
| Bovine Serum Albumin (BSA) Standard | A model protein for system suitability testing and method development due to its well-characterized properties. |
| Blank Nanoparticle Formulation | Critical for identifying excipient/particle peaks and assessing separation from the protein signal. |
| Polymer Standards (e.g., PLGA) | Used to characterize the elution profile of the encapsulation matrix, which is vital for method specificity. |
| Post-column Flow Splitter Valve | Essential if using a standard ELSD with a non-optimized flow cell. Splits flow to ~0.2-0.3 mL/min entering the detector, preventing signal saturation and droplet formation. |
| Low-Volume, Maximum Recovery Vials & Inserts | Minimizes sample volume requirements (critical for screening) and reduces unwanted peak broadening from extra-column volume. |
HPLC-ELSD vs. UV, CAD, and Other Techniques: A Critical Validation for Protein Encapsulation
Within the broader research thesis on quantifying protein encapsulation efficiency using HPLC-ELSD (Evaporative Light Scattering Detection), the selection of an appropriate detection method is paramount. Many therapeutic proteins and peptides, such as insulin, growth hormones, and certain antibodies, possess weak or inconsistent UV chromophores due to a lack of aromatic amino acids (Tryptophan, Tyrosine) or due to their structural conformations. This application note provides a detailed comparison of ELSD and UV detection for the analysis of such challenging analytes, focusing on sensitivity, linearity, and compatibility with gradient elution in encapsulation efficiency protocols.
Quantitative Performance Comparison
The following table summarizes key performance metrics for ELSD and UV detection based on current literature and standard operating procedures for proteins like insulin, lysozyme, and bovine serum albumin (BSA) under gradient reverse-phase (RP) or size-exclusion (SEC) HPLC conditions.
Table 1: Performance Comparison of ELSD vs. UV Detection for Weak Chromophore Proteins
| Parameter | UV Detection (Low UV, ~210-220 nm) | Evaporative Light Scattering Detection (ELSD) |
|---|---|---|
| Universal Detection | No (Requires chromophore) | Yes (Detects any non-volatile analyte) |
| Typical Sensitivity (LOD) | ~0.1-1 µg (highly variable) | ~10-100 ng (post-evaporation) |
| Linear Dynamic Range | Broad (~3-4 orders of magnitude) | Narrower (~2-3 orders); Power function fit |
| Gradient Compatibility | Excellent (if mobile phase is UV-transparent) | Excellent (mobile phase is evaporated) |
| Response Factor | Depends on ε (molar absorptivity) | More consistent across similar mass compounds |
| Effect of Mobile Phase | High (requires UV-transparent solvents) | Low (volatile buffers required, e.g., TFA, FA) |
| Destructive/Nondestructive | Nondestructive | Destructive (sample evaporated) |
| Suitability for Encapsulation Efficiency | Poor for low-ε, variable formulations | High; robust against excipient interference |
Detailed Experimental Protocols
Protocol 1: HPLC-UV Method for Protein Analysis (Reference)
This protocol is for baseline comparison but is suboptimal for weak chromophores.
Objective: Separate and quantify a protein mixture via RP-HPLC with UV detection at 214 nm. Materials:
- HPLC System: Binary pump, autosampler, column oven, UV/VIS detector.
- Column: C4 or C8 RP column, 300Å pore size, 150 x 4.6 mm, 5 µm.
- Mobile Phase A: 0.1% Trifluoroacetic acid (TFA) in HPLC-grade water.
- Mobile Phase B: 0.1% TFA in acetonitrile.
- Standards: Protein of interest (e.g., insulin) and blank formulation.
Procedure:
- Sample Prep: Dissolve encapsulated sample in appropriate solvent (e.g., DMSO or mobile phase A) to disrupt carrier, then dilute with Mobile Phase A. Centrifuge at 14,000 rpm for 10 min. Filter supernatant through a 0.22 µm PVDF syringe filter.
- Chromatography: Set flow rate to 1.0 mL/min. Column temperature: 40°C. Use a linear gradient from 20% B to 80% B over 20 minutes. Equilibrate for 10 min post-run.
- Detection: Set UV detector to 214 nm (peptide bond absorption). Reference wavelength: 550 nm.
- Analysis: Prepare a calibration curve (1-100 µg/mL) of pure protein. Integrate peak areas. Encapsulation Efficiency (%) = (Measured encapsulated protein / Total protein added) * 100.
Protocol 2: HPLC-ELSD Method for Protein Encapsulation Efficiency
This is the core recommended protocol for the thesis research.
Objective: Robustly quantify encapsulated protein, free from interference by polymers, lipids, or weak chromophores.
Materials:
- HPLC System: As above, with ELSD replacing/added after UV detector.
- ELSD Parameters: Drift tube temperature: 70°C. Nebulizer gas (N2 or compressed air) pressure: 3.5 bar. Gain: 8-10.
- Column & Mobile Phase: Identical to Protocol 1, but volatile modifiers are critical (TFA, Formic Acid, Ammonium Acetate).
Procedure:
- Sample Preparation: Follow identical steps as Protocol 1, Step 1.
- Chromatography: Use the identical gradient method from Protocol 1, Step 2. Ensure mobile phase is fully compatible (volatile).
- ELSD Operation & Calibration:
- Power on ELSD and allow 15-30 min for lamp stabilization and temperature equilibration.
- Optimize gas pressure and temperature to achieve a stable baseline. Signal should be stable with gradient running.
- Prepare a calibration curve of pure protein across the expected range (e.g., 1-100 µg/mL). Note: ELSD response is nonlinear. Use a log-log plot or power function (Area = a * (Mass)^b) for fitting.
- Data Analysis:
- Inject prepared samples (encapsulated product, free protein control, blank formulation).
- Quantify the protein peak area using the power function calibration curve.
- Calculate Encapsulation Efficiency (EE%):
EE% = (Amount of protein in encapsulated fraction / Total amount of protein used in formulation) * 100
Visualizing the Detection Principles and Workflow
Title: Detection Principles: UV Absorption vs. ELSD Scattering
Title: Workflow for Protein Encapsulation Efficiency Analysis
The Scientist's Toolkit: Essential Research Reagents & Materials
Table 2: Key Reagent Solutions for HPLC Analysis of Protein Encapsulation
| Item | Function / Rationale |
|---|---|
| Volatile Acids (TFA, FA) | Ion-pairing agents for RP-HPLC that provide excellent peak shape and are fully volatile for ELSD compatibility. |
| Acetonitrile (HPLC Grade) | Primary organic modifier for RP-HPLC. Low UV cut-off and high volatility make it ideal for both UV and ELSD. |
| Ammonium Acetate/Formate | Volatile salt buffers for SEC or ion-exchange methods where non-acidic pH is required for protein stability. |
| C4/C8 RP Columns (300Å) | Wide-pore stationary phases suitable for large protein molecules, providing good recovery and separation. |
| 0.22 µm PVDF Filters | For sample clarification. PVDF is low-protein-binding and compatible with organic solvents. |
| Nitrogen/Compressed Air Generator | Pure, dry gas source required for ELSD nebulization and evaporation. Critical for stable baseline. |
| Protein Standards (e.g., Insulin, BSA) | Well-characterized proteins for system suitability testing, calibration, and method validation. |
| DMSO or Organic Solvents | Used to effectively disrupt lipid or polymer-based encapsulation carriers (e.g., liposomes, PLGA NPs) for protein release. |
Within the context of high-performance liquid chromatography (HPLC) method development for protein encapsulation efficiency research, the need for universal, sensitive detection of non-chromophoric analytes is paramount. Evaporative Light Scattering Detection (ELSD) has been a cornerstone for lipid and polymer analysis in nanoparticle characterization. The rise of Charged Aerosol Detection (CAD) presents a powerful alternative and complementary technology. This application note details the operational principles, comparative performance, and practical protocols for integrating CAD and ELSD in the analysis of lipid excipients and protein-loaded nanoparticles, directly supporting thesis research on HPLC-ELSD methodologies.
Charged Aerosol Detection (CAD)
CAD involves three stages: 1) Nebulization of the column effluent into droplets, 2) Evaporation of the mobile phase to form dried analyte particles, and 3) Charging of those particles via a high-voltage corona wire. The resulting charged particle flux is measured by a highly sensitive electrometer, generating a signal proportional to mass.
Evaporative Light Scattering Detection (ELSD)
ELSD also involves nebulization and evaporation. The final stage involves the passage of dried analyte particles through a light beam (typically a laser). The scattered light is detected by a photomultiplier or photodiode, with signal intensity related to particle size and mass.
Table 1: Key Performance Characteristics of CAD vs. ELSD
| Parameter | Charged Aerosol Detection (CAD) | Evaporative Light Scattering Detection (ELSD) |
|---|---|---|
| Detection Principle | Particle charging & electrical current measurement | Light scattering by dried particles |
| Response Factor | More uniform; less dependent on chemical structure | Varies more with chemical properties (mass, volatility) |
| Dynamic Range | Typically 3-4 orders of magnitude | Typically 2-3 orders of magnitude |
| Sensitivity | Generally higher (low picogram range on-column) | Generally good (nanogram range on-column) |
| Mobile Phase Requirements | Volatile buffers and modifiers essential | Volatile buffers and modifiers essential |
| Flow Rate Sensitivity | Sensitive; requires precise control/pneumatic assist | Sensitive; requires optimized nebulizer gas flow |
| Gradient Compatibility | Excellent, with stable baseline | Excellent, with stable baseline |
| Noise Profile | Very low baseline noise | Typically higher baseline noise than CAD |
Table 2: Application Suitability for Protein/Lipid Nanoparticle Analysis
| Analytic Class | CAD Performance | ELSD Performance | Preferred for Thesis Context |
|---|---|---|---|
| Phospholipids (e.g., DSPC, DOPC) | Excellent, uniform response | Good, but response varies by headgroup & saturation | CAD for precise quantification of mixtures |
| Cholesterol | Excellent, linear response | Moderate, non-linear response at lower ranges | CAD |
| PEGylated Lipids (e.g., DMG-PEG2000) | Very Good | Good for higher masses | Complementary Use |
| Polymer Excipients (PLGA, PLA) | Excellent | Good | CAD for broader linear range |
| Free Protein (Unencapsulated) | Poor (requires derivatization) | Poor (requires derivatization) | Neither; use UV or FLD |
| Hydrolytic Degradants | Excellent for non-UV active | Good for non-UV active | CAD for sensitivity |
Complementary Use in a Unified Workflow
CAD and ELSD are not mutually exclusive. CAD's superior sensitivity and uniformity are ideal for quantifying low-abundance lipid components and establishing standard curves. ELSD can serve as a robust, orthogonal method for confirmatory analysis of major components. For comprehensive characterization of lipid nanoparticle (LNP) formulations and encapsulation efficiency, the detectors can be used in parallel or in series post-column (if flow rates are adjusted).
Experimental Protocols
Protocol 1: HPLC-CAD Method for Quantifying Lipid Excipients in LNPs
Title: Simultaneous Quantification of Phospholipid, Cholesterol, and PEG-Lipid by HPLC-CAD.
I. Sample Preparation:
- Dissolve blank (unloaded) or protein-loaded LNP formulations in a suitable organic solvent (e.g., 90:10 isopropanol:chloroform, v/v) to a nominal total lipid concentration of 1 mg/mL.
- Vortex vigorously for 60 seconds and sonicate in a bath sonicator for 5 minutes to ensure complete dissolution/disruption.
- Centrifuge at 14,000 x g for 10 minutes to pellet any insoluble carrier or free protein.
- Dilute the supernatant appropriately with the mobile phase starting conditions prior to HPLC injection.
II. HPLC-CAD Conditions:
- Column: C8 or C18 reversed-phase column, 150 x 4.6 mm, 2.7 µm core-shell or 3.5 µm fully porous.
- Mobile Phase A: Acetonitrile/Water (60/40, v/v) with 10 mM Ammonium Formate.
- Mobile Phase B: Isopropanol/Acetonitrile (90/10, v/v) with 10 mM Ammonium Formate.
- Gradient: 0 min: 30% B; 0-15 min: 30-100% B; 15-20 min: 100% B; 20-20.1 min: 100-30% B; 20.1-25 min: 30% B (re-equilibration).
- Flow Rate: 0.5 mL/min. Note: A post-column pneumatic regulator or split may be needed for optimal CAD nebulization.
- Column Temperature: 55°C.
- Injection Volume: 10 µL.
- CAD Parameters: Nebulizer Temperature: 30°C. Evaporator Temperature: 40°C. Data Collection Rate: 10 Hz. Filter: 3.6 s. Power Function: 1.00.
III. Data Analysis:
- Prepare external standard curves (e.g., 0.5 µg/mL to 200 µg/mL) for each pure lipid component (DSPC, Cholesterol, DMG-PEG2000).
- Integrate peak areas. CAD response follows a power function (Signal = a * mass^b). Use logarithmic transformation or instrument software power function fitting to create linear calibration curves.
- Quantify components in LNP samples against respective standard curves.
Protocol 2: Orthogonal Analysis using HPLC-ELSD for Confirmatory Profiling
Title: Confirmatory Lipid Profiling Using HPLC-ELSD.
I. Sample Preparation: Identical to Protocol 1, Step I.
II. HPLC-ELSD Conditions:
- Column & Mobile Phase: Identical to Protocol 1 for direct comparison.
- Gradient: Adjust timing as necessary based on column dimensions.
- Flow Rate: 1.0 mL/min. Note: Standard flow rates are often more compatible with ELSD without modification.
- ELSD Parameters: Nebulizer Temperature: 40°C. Evaporation Temperature: 80°C. Gas (N2) Flow Rate: 1.5 SLM. Gain: Adjust to fit calibration range. Impactor: Off.
III. Data Analysis:
- ELSD response is typically non-linear. Use a logarithmic plot of area vs. mass or a quadratic fit for calibration (e.g., 5 µg/mL to 500 µg/mL).
- Compare the relative percentage composition of lipid components with results from the HPLC-CAD method.
Visualization of Workflows and Principles
Title: Comparative HPLC Detection Workflows: CAD vs. ELSD
Title: Integrated LNP Characterization Workflow for Encapsulation Studies
The Scientist's Toolkit: Research Reagent Solutions
Table 3: Essential Materials for HPLC-CAD/ELSD Analysis of Lipid Nanoparticles
| Item | Function/Description | Critical Notes for Thesis Research |
|---|---|---|
| HPLC System | Binary or quaternary pump, autosampler, column oven. | Must be compatible with volatile mobile phases (low dwell volume preferred). |
| CAD Detector | e.g., Corona Veo, Charged Aerosol Detector. | Provides universal, mass-sensitive detection for lipid quantification. |
| ELSD Detector | e.g., Sedere Sedex, Alltech 3300. | Orthogonal, universal detector for method confirmation. |
| C8 or C18 RP Column | 150 mm, 2.7-5 µm particle size. | Separates lipids by hydrophobicity. Core-shell particles offer high efficiency. |
| Ammonium Formate | HPLC-grade, volatile buffer salt. | Provides ionic strength for separation, volatile for CAD/ELSD compatibility. |
| Acetonitrile (ACN), Isopropanol (IPA), Chloroform | HPLC-grade solvents. | ACN/IPA for mobile phase; Chloroform/IPA for LNP dissolution. |
| Lipid Standards | High-purity DSPC, Cholesterol, DMG-PEG2000, etc. | Essential for creating quantitative calibration curves for each component. |
| Pneumatic Regulator / Splitter Kit | For flow rate adjustment to CAD. | CAD often performs best at lower flow rates (~0.5 mL/min). |
| Syringe Filters | 0.2 µm, PTFE or Nylon. | For filtering mobile phases and sample supernatants prior to injection. |
| Data Analysis Software | e.g., Chromeleon, Empower, or instrument-native software. | Must support non-linear regression (power function for CAD, log/quad for ELSD). |
Within the broader thesis focusing on the development and application of High-Performance Liquid Chromatography coupled with Evaporative Light Scattering Detection (HPLC-ELSD) for determining protein encapsulation efficiency in polymeric nanoparticles, method validation is a critical step. This document provides detailed Application Notes and Protocols for validating the key analytical parameters of the developed HPLC-ELSD method, ensuring its reliability for quantitative analysis in drug delivery research.
Experimental Protocols & Data Presentation
Protocol for Linearity Study
Objective: To establish a relationship between the peak area (logarithmic scale) and the analyte concentration (logarithmic scale). Methodology:
- Prepare a minimum of five standard solutions of the target protein (e.g., Bovine Serum Albumin) at concentrations spanning the expected range (e.g., 10–500 µg/mL).
- Inject each standard in triplicate into the HPLC-ELSD system.
- Chromatographic conditions (example): C4 or C8 column (150 x 4.6 mm, 5 µm), mobile phase A (0.1% TFA in Water), B (0.1% TFA in Acetonitrile), gradient elution. ELSD conditions: drift tube temperature 80°C, nebulizer temperature 45°C, gas flow rate 1.5 SLM.
- Plot the log(peak area) versus log(concentration). Perform linear regression analysis.
Table 1: Linearity Data for Protein X
| Nominal Conc. (µg/mL) | Log(Conc.) | Mean Log(Peak Area) | RSD (%) |
|---|---|---|---|
| 10 | 1.00 | 3.45 | 1.2 |
| 50 | 1.70 | 4.88 | 0.9 |
| 100 | 2.00 | 5.55 | 1.5 |
| 250 | 2.40 | 6.60 | 1.1 |
| 500 | 2.70 | 7.38 | 0.8 |
Regression Equation: y = 1.92x + 1.55; R² = 0.9987
Protocol for LOD and LOQ Determination
Objective: To determine the Limit of Detection (LOD) and Limit of Quantification (LOQ). Methodology (Signal-to-Noise Ratio Approach):
- Prepare a series of low-concentration standard solutions near the expected detection limit.
- Inject each solution and record the chromatogram.
- Measure the peak height (H) of the analyte and the peak-to-peak noise (N) in a blank chromatogram near the analyte's retention time.
- Calculate LOD as the concentration yielding H/N ≥ 3. Calculate LOQ as the concentration yielding H/N ≥ 10.
- Confirm by injecting standards at the calculated LOD/LOQ levels (n=6) to verify precision (RSD ≤ 20% for LOD, ≤ 10% for LOQ).
Table 2: LOD and LOQ Values
| Analytic | LOD (µg/mL) | LOQ (µg/mL) | Method of Determination |
|---|---|---|---|
| Protein X | 1.5 | 5.0 | Signal-to-Noise (S/N=3/10) |
Protocol for Precision (Repeatability & Intermediate Precision)
Objective: To assess the method's variability under same-day (repeatability) and inter-day/inter-operator (intermediate precision) conditions. Methodology:
- Prepare three QC samples (Low, Medium, High concentrations) of encapsulated and free protein.
- Repeatability: Inject each QC sample six times within the same day by the same analyst using the same instrument.
- Intermediate Precision: Repeat the study on three different days, with two different analysts if possible.
- Calculate the %RSD for peak area and retention time for each QC level.
Table 3: Precision Data (%RSD)
| QC Level | Conc. (µg/mL) | Repeatability (n=6) | Intermediate Precision (n=18) | ||
|---|---|---|---|---|---|
| Peak Area | Rt (min) | Peak Area | Rt (min) | ||
| Low | 15 | 1.8 | 0.3 | 2.5 | 0.5 |
| Medium | 150 | 1.2 | 0.2 | 1.9 | 0.4 |
| High | 400 | 0.9 | 0.1 | 1.5 | 0.3 |
Protocol for Accuracy (Recovery)
Objective: To determine the closeness of the measured value to the true value, expressed as % recovery. Methodology (Spike Recovery):
- Prepare pre-quantified nanoparticle samples.
- Spike these samples with known amounts of the standard protein at three levels (80%, 100%, 120% of the target concentration).
- Process the samples (e.g., disrupt nanoparticles, precipitate polymer, filter) and analyze via the validated HPLC-ELSD method.
- Calculate % Recovery = (Measured Concentration / Theoretical Concentration) × 100.
Table 4: Accuracy (Recovery) Data
| Spike Level (%) | Theoretical Conc. (µg/mL) | Mean Measured Conc. (µg/mL) | % Recovery | RSD (%) |
|---|---|---|---|---|
| 80 | 120 | 118.5 | 98.8 | 1.9 |
| 100 | 150 | 151.2 | 100.8 | 1.5 |
| 120 | 180 | 182.7 | 101.5 | 1.3 |
Protocol for Robustness
Objective: To evaluate the method's capacity to remain unaffected by small, deliberate variations in operational parameters. Methodology (Plackett-Burman or One-Factor-at-a-Time Design):
- Select critical method parameters: Mobile Phase pH (±0.1), Organic Modifier % (±2%), Flow Rate (±0.1 mL/min), ELSD Drift Tube Temperature (±5°C).
- For each varied parameter, analyze a mid-level QC sample (n=3) while keeping other conditions constant.
- Monitor the effect on critical responses: peak area, retention time, tailing factor, and resolution from nearest peak.
Table 5: Robustness Test Results
| Varied Parameter | Condition | Peak Area RSD (%) | Δ Rt (min) | Tailing Factor |
|---|---|---|---|---|
| Mobile Phase pH | -0.1 | 2.1 | +0.12 | 1.15 |
| Nominal | 1.2 | 0.00 | 1.10 | |
| +0.1 | 2.3 | -0.10 | 1.08 | |
| Flow Rate | -0.1 mL/min | 2.5 | +0.25 | 1.12 |
| Nominal | 1.2 | 0.00 | 1.10 | |
| +0.1 mL/min | 2.8 | -0.22 | 1.09 |
Visualization of Method Validation Workflow
Title: HPLC-ELSD Method Validation Sequential Workflow
The Scientist's Toolkit: Key Research Reagent Solutions
Table 6: Essential Materials for HPLC-ELSD Validation in Protein Encapsulation Studies
| Item | Function & Brief Explanation |
|---|---|
| Proteins (e.g., BSA, Lysozyme) | Model proteins used to develop and validate the method, simulating therapeutic biologics. |
| Poly(lactic-co-glycolic acid) (PLGA) | A biodegradable polymer commonly used to fabricate protein-encapsulating nanoparticles. |
| Trifluoroacetic Acid (TFA), HPLC Grade | Ion-pairing agent added to mobile phase (0.1%) to improve protein peak shape and separation on reversed-phase columns. |
| Acetonitrile & Water, HPLC Grade | Primary mobile phase components for reversed-phase protein separation. |
| C4 or C8 Reversed-Phase Column | Stationary phase designed for separating proteins and peptides based on hydrophobicity. |
| Nitrogen or Compressed Air Generator | Source of inert gas required by the ELSD for nebulization and evaporation of the mobile phase. |
| 0.22 µm PVDF Syringe Filters | For filtering mobile phases and sample solutions to protect the HPLC column and ELSD nebulizer. |
| Phosphate Buffered Saline (PBS) | Used for dissolving/dispersing nanoparticles and as a medium for in-vitro release studies. |
| Organic Solvent (e.g., Acetone, DCM) | Used to disrupt/dissolve polymeric nanoparticles to extract encapsulated protein for analysis. |
This application note details validated Evaporative Light Scattering Detector (ELSD) methods coupled with High-Performance Liquid Chromatography (HPLC) for determining the encapsulation efficiency (EE) of monoclonal antibodies (mAbs) in poly(lactic-co-glycolic acid) (PLGA) nanoparticles. Framed within a thesis on HPLC-ELSD for protein encapsulation research, it provides a standardized protocol and a comparative case study of two separation methods: size-exclusion chromatography (SEC) and reversed-phase chromatography (RP).
Quantifying protein encapsulation within polymeric nanoparticles is critical for formulation development. UV detection is often compromised by polymeric interference and excipients. ELSD, as a mass-sensitive detector, offers universal detection independent of chromophores, making it ideal for analyzing mAb-loaded PLGA formulations where the polymer and protein must be distinguished without interference.
Case Study: mAb-Loaded PLGA Nanoparticles
Two complementary HPLC-ELSD methods were developed and validated according to ICH Q2(R1) guidelines for the determination of mAb (therapeutic IgG) encapsulation in PLGA nanoparticles.
Table 1: Validated HPLC-ELSD Method Parameters for mAb/PLGA Analysis
| Parameter | Size-Exclusion Chromatography (SEC) Method | Reversed-Phase (RP) Method |
|---|---|---|
| Primary Purpose | Quantify free (unencapsulated) mAb in supernatant | Quantify total mAb after nanoparticle dissolution |
| Column | TSKgel G3000SWxl (7.8 mm I.D. × 30 cm) | Zorbax 300SB-C8 (4.6 mm I.D. × 15 cm) |
| Mobile Phase | 0.1 M Sodium phosphate, 0.1 M Na₂SO₄, pH 6.8 | A: 0.1% TFA in Water; B: 0.1% TFA in Acetonitrile |
| Gradient/Flow | Isocratic, 0.8 mL/min | Linear: 25% B to 60% B over 12 min, 0.8 mL/min |
| ELSD Settings | Evap. Temp: 90°C, Nebulizer Temp: 60°C, Gas Flow: 1.6 SLM | Evap. Temp: 95°C, Nebulizer Temp: 70°C, Gas Flow: 1.8 SLM |
| Linearity Range | 5 – 500 µg/mL (R² > 0.998) | 10 – 1000 µg/mL (R² > 0.997) |
| LOD/LOQ | 1.5 µg/mL / 5.0 µg/mL | 3.0 µg/mL / 10.0 µg/mL |
| Accuracy (%Recovery) | 98.5% - 101.2% | 97.8% - 102.1% |
| Precision (%RSD) | Intra-day: <1.5%, Inter-day: <2.5% | Intra-day: <2.0%, Inter-day: <3.0% |
| Key Advantage | Preserves mAb integrity; ideal for free protein analysis. | Efficiently separates mAb from dissolved PLGA oligomers. |
Encapsulation Efficiency Calculation
Encapsulation Efficiency (EE) and Drug Loading (DL) were calculated using the following formulas, derived from data obtained by applying the two methods:
- Total mAb (from RP method on dissolved nanoparticles):
C_total - Free mAb in supernatant (from SEC method):
C_free - Encapsulated mAb:
C_encap = C_total - C_free - EE (%) =
(C_encap / C_total) × 100 - DL (%) =
(Mass of encapsulated mAb / Total mass of nanoparticles) × 100
In the case study, for a formulation with a theoretical load of 5% w/w, the validated methods yielded: EE = 72.4 ± 3.1% and DL = 3.62 ± 0.16% w/w.
Detailed Experimental Protocols
Protocol 1: Sample Preparation for Encapsulation Analysis
Objective: To separate free mAb from encapsulated mAb and prepare samples for HPLC-ELSD analysis. Materials: Formulated mAb-PLGA nanoparticle suspension, ultracentrifuge, 100kDa MWCO centrifugal filters, dissolution solvent (0.1 M NaOH with 2% SDS), pH adjustment buffer (1 M Tris-HCl, pH 7.0). Workflow:
- Separation: Aliquot 1 mL of nanoparticle suspension. Ultracentrifuge at 100,000 × g for 45 minutes at 4°C.
- Free mAb Sample: Carefully collect the supernatant. Filter through a 0.22 µm PVDF syringe filter. Analyze directly via the SEC-ELSD method (Protocol 2) for free mAb concentration.
- Total mAb Sample: Resuspend the nanoparticle pellet in 1 mL of dissolution solvent. Vortex vigorously for 2 minutes, then incubate at 37°C for 1 hour with gentle shaking to fully dissolve PLGA and release mAb.
- Neutralization: Adjust pH to 7.0 using Tris-HCl buffer. Filter through a 0.22 µm syringe filter. Analyze via the RP-ELSD method (Protocol 3) for total mAb concentration.
Protocol 2: SEC-ELSD Analysis of Free mAb
Objective: To quantify unencapsulated, intact mAb in the supernatant. Procedure:
- System Setup: Install TSKgel SEC column. Equilibrate with mobile phase (Table 1) for ≥60 min at 0.8 mL/min. Power on ELSD and allow stabilization (~30 min) to achieve stable baseline.
- ELSD Calibration: Inject a series of mAb standard solutions (e.g., 5, 50, 100, 250, 500 µg/mL) in mobile phase. Plot log(peak area) vs. log(concentration) to generate the calibration curve.
- Sample Analysis: Inject 50 µL of filtered supernatant (from Protocol 1, Step 2). The mAb elutes at ~8.5 min. PLGA or its aggregates, if present, elute in the void volume (<6 min).
- Quantification: Determine the concentration of free mAb from the calibration curve.
Protocol 3: RP-ELSD Analysis of Total mAb
Objective: To quantify total mAb (encapsulated + free) after nanoparticle dissolution. Procedure:
- System Setup: Install C8 RP column. Equilibrate with 25% Mobile Phase B (Table 1). Set ELSD to parameters for RP method (Table 1).
- ELSD Calibration: Prepare mAb standards in a matrix mimicking the neutralized dissolution sample. Inject and generate calibration curve as in Protocol 2.
- Sample Analysis: Inject 20 µL of the neutralized, filtered total mAb sample (from Protocol 1, Step 4). Run the gradient. The mAb elutes at ~9.2 min. Degraded PLGA products elute as a broad peak later in the gradient.
- Quantification: Determine total mAb concentration from the RP calibration curve.
The Scientist's Toolkit: Key Research Reagent Solutions
Table 2: Essential Materials for HPLC-ELSD Analysis of Protein-Loaded Nanoparticles
| Item | Function & Rationale |
|---|---|
| PLGA (50:50, acid-terminated) | The biodegradable polymer matrix. Molecular weight (e.g., 10-30 kDa) and end group affect encapsulation and release. |
| Therapeutic mAb (IgG) Standard | Provides the primary analytical standard for calibration and identity confirmation. Must be identical to the encapsulated protein. |
| TSKgel G3000SWxl Column | SEC column optimized for protein separation. Resolves mAb monomer from aggregates and polymer fragments. |
| Zorbax 300SB-C8 Column | Wide-pore RP column suitable for large proteins like mAbs. Provides robust separation from dissolved PLGA. |
| Trifluoroacetic Acid (TFA), HPLC Grade | Ion-pairing agent in RP mobile phase. Enhances protein separation and improves peak shape. |
| Sodium Dodecyl Sulfate (SDS) | Surfactant used in dissolution buffer to fully disrupt nanoparticles and solubilize both PLGA and protein. |
| 100 kDa MWCO Centrifugal Filters | Used for alternative purification of free protein (option to ultracentrifugation), removing any residual nanoparticles. |
| ELSD Calibration Standards (Sucrose/NaCl) | Used for periodic performance qualification of the ELSD detector independent of the analyte. |
Visualized Workflows & Relationships
Diagram 1: Complete Workflow for mAb Encapsulation Analysis
Diagram 2: Case Study Context Within Broader Thesis
Integrating ELSD with Other Analytical Techniques (e.g., SEC, DLS) for Comprehensive Characterization
Application Notes: A Multi-Technique Approach for Liposomal Protein Formulation
Within the thesis research on HPLC-ELSD for protein encapsulation efficiency (EE%), ELSD data alone provides a robust quantification of free vs. encapsulated protein after separation. However, a comprehensive understanding of formulation success requires characterization of the nanoparticle carrier itself. Integrating Size Exclusion Chromatography (SEC) and Dynamic Light Scattering (DLS) with ELSD detection addresses this, correlating encapsulation data with particle size, stability, and aggregation state.
Key Insights from Integrated Data:
- SEC-ELSD vs. DLS: SEC-ELSD provides a size-resolved profile of the liposome population and any protein aggregates in the native buffer, while DLS offers the intensity-weighted average hydrodynamic diameter and polydispersity index (PDI) of the bulk sample.
- Stability Assessment: Pre- and post-chromatography DLS measurements confirm that the SEC separation process does not induce aggregation or disrupt liposome integrity.
- Aggregation Detection: A shift in the SEC-ELSD profile of the liposome peak or an increase in DLS PDI can indicate formulation instability, which may directly impact the EE% calculated by HPLC-ELSD.
Table 1: Comparative Data from Multi-Technique Analysis of Liposomal Insulin Formulation L-INS-05
| Analytical Technique | Key Parameter(s) Measured | Value for Batch L-INS-05 | Interpretation |
|---|---|---|---|
| RP-HPLC-ELSD | Encapsulation Efficiency (EE%) | 78.5% ± 2.1% | High loading achieved. |
| SEC-ELSD | Liposome Peak Retention Time | 8.2 min | Corresponds to ~120 nm based on calibration. |
| SEC-ELSD | Free Protein Aggregate Peak | Not Detected | No significant soluble aggregates present. |
| DLS (Pre-SEC) | Z-Average Diameter (d.nm) | 124.6 nm | Confirms SEC size estimation. |
| DLS (Pre-SEC) | Polydispersity Index (PDI) | 0.08 | Monodisperse, stable population. |
| DLS (Post-SEC, collected peak) | Z-Average Diameter (d.nm) | 121.9 nm | SEC process did not alter liposome size. |
| DLS (Post-SEC, collected peak) | PDI | 0.09 | Population remains monodisperse post-separation. |
Experimental Protocols
Protocol 1: Integrated SEC-ELSD Analysis of Liposome Size and Purity Objective: To separate liposomes from free/unencapsulated protein and characterize the liposome population by size.
- Equipment: HPLC system with: Isocratic pump, autosampler, SEC column (e.g., Tosoh Bioscience TSKgel G5000PWXL, 7.8 mm ID x 30 cm), and an Evaporative Light Scattering Detector (ELSD). Set ELSD to: Evaporator Temp 80°C, Nebulizer Temp 50°C, Gas Flow 1.5 SLM.
- Mobile Phase: 20 mM Phosphate Buffer, 150 mM NaCl, pH 7.4. Filter (0.22 µm) and degas.
- Calibration: Inject 100 µL of protein standard mix (Thyroglobulin, IgG, BSA, Lysozyme) to establish retention time vs. log(MW) curve. Inject 100 µL of nanoparticle size standards (e.g., 50nm, 100nm, 200nm latex beads) for approximate size calibration.
- Sample Analysis: Dilute liposomal formulation 1:10 in mobile phase. Inject 100 µL. Run isocratically at 0.8 mL/min for 25 min.
- Data Analysis: Identify the liposome peak (early elution). Collect this peak fraction for subsequent DLS analysis (Protocol 2).
Protocol 2: DLS for Hydrodynamic Size and Stability Assessment Objective: To measure the average particle size and polydispersity of the formulation before and after SEC separation.
- Equipment: Dynamic Light Scattering instrument (e.g., Malvern Zetasizer).
- Sample Preparation:
- Pre-SEC Sample: Dilute 20 µL of raw liposomal formulation into 980 µL of PBS (pH 7.4) to achieve suitable scattering intensity.
- Post-SEC Sample: Use the fraction collected from the main liposome peak in Protocol 1 directly (or with minimal dilution).
- Measurement: Load sample into a disposable microcuvette. Set temperature to 25°C. Allow 2 min equilibration.
- Parameters: Perform minimum of 3 measurements per sample. Set number of runs automatically.
- Data Analysis: Report the Z-Average diameter (intensity-weighted mean) and the Polydispersity Index (PDI). Compare pre- and post-SEC values to assess separation-induced stress.
Protocol 3: Correlative HPLC-ELSD for Encapsulation Efficiency Objective: To quantify the percentage of protein encapsulated within liposomes.
- Equipment: HPLC system with: Binary pumps, C4 or C8 reversed-phase column, and ELSD. Set ELSD to: Evaporator Temp 90°C, Nebulizer Temp 70°C (optimized for protein).
- Chromatography: Gradient from 30% to 70% Acetonitrile in 0.1% TFA over 15 min. Flow rate: 1.0 mL/min.
- Sample Prep for Total Protein: Lyse 100 µL of formulation with 900 µL of 0.1% Triton X-100 in IPA. Vortex vigorously for 2 min. Centrifuge at 14,000g for 10 min. Inject supernatant.
- Sample Prep for Free Protein: Dilute 100 µL of formulation with 900 µL of PBS. Centrifuge at 20,000g for 30 min (4°C) to pellet liposomes. Inject the supernatant containing free protein.
- Calculation: Use peak area from ELSD. EE% = [(Total Protein - Free Protein) / Total Protein] x 100.
Visualizations
Integrated Characterization Workflow
Decision Logic for Technique Selection
The Scientist's Toolkit: Key Reagent Solutions
| Item | Function in Characterization |
|---|---|
| TSKgel G5000PWXL SEC Column | High-performance column for separation of nanoparticles (liposomes) from free protein based on hydrodynamic size. |
| Phosphate Buffered Saline (PBS), pH 7.4 | Isotonic, physiological mobile phase for SEC and DLS to maintain liposome integrity during analysis. |
| Nanoparticle Size Standards (e.g., 100nm latex) | Used to calibrate the SEC system for approximate liposome size determination. |
| 0.1% Triton X-100 in Isopropanol | Efficient lysis buffer for disrupting liposomal membranes to release total encapsulated protein for HPLC-ELSD assay. |
| Trifluoroacetic Acid (TFA) / Acetonitrile | Standard mobile phase additives for reversed-phase HPLC separation of proteins prior to ELSD detection. |
| Disposable Zeta Cells / Microcuvettes | Essential for DLS sample containment, preventing cross-contamination and ensuring accurate light scattering measurements. |
Conclusion
HPLC-ELSD emerges as a powerful, versatile, and often essential analytical tool for the accurate determination of protein encapsulation efficiency, particularly where traditional UV detection fails. By mastering the foundational principles, implementing robust methodological protocols, and applying systematic troubleshooting, researchers can develop highly reliable assays. The validation data confirms that while techniques like CAD offer similar benefits, HPLC-ELSD provides a proven, cost-effective solution for universal detection. This capability is crucial for advancing reproducible and high-quality nanomedicine and biopharmaceutical products. Future directions include the tighter integration of ELSD with advanced separation techniques and its adaptation for real-time monitoring in process analytical technology (PAT) frameworks, paving the way for more efficient and controlled manufacturing of next-generation protein therapeutics.