ATP Hydrolysis as the Engine of Chaperone Disaggregation: Mechanisms, Methods, and Medical Implications
This article provides a comprehensive analysis of ATP hydrolysis as the fundamental power source for molecular chaperone-mediated disaggregation of protein aggregates, a critical process in cellular proteostasis.
ATP Hydrolysis as the Engine of Chaperone Disaggregation: Mechanisms, Methods, and Medical Implications
Abstract
This article provides a comprehensive analysis of ATP hydrolysis as the fundamental power source for molecular chaperone-mediated disaggregation of protein aggregates, a critical process in cellular proteostasis. We explore the foundational biochemical principles, from the core ATPase cycles of Hsp70, Hsp100, and Hsp110 systems to their collaborative mechanics in threading and fragmentation. The review details cutting-edge methodologies for studying ATP-driven disaggregation in vitro and in vivo, addresses common experimental challenges and optimization strategies, and validates findings through comparative analysis of different chaperone systems and disease models. Aimed at researchers and drug developers, this synthesis highlights how mechanistic insights into ATP-fueled disaggregation are informing novel therapeutic strategies for neurodegenerative and age-related proteinopathies.
The Molecular Motor: How ATP Hydrolysis Drives Chaperone Disaggregation from First Principles
Adenosine triphosphate (ATP) serves as the universal biochemical energy currency, powering essential cellular processes including protein homeostasis (proteostasis). Within proteostasis networks, molecular chaperones utilize ATP hydrolysis to perform mechanical work, notably in the disassembly of toxic protein aggregates—a process critical for cellular viability. This whitepaper frames the role of ATP within the specific context of chaperone-driven disaggregation, a key focus of modern biochemical research with implications for neurodegenerative disease therapeutics. The controlled release of energy from ATP hydrolysis (ΔG ≈ -30.5 kJ/mol under cellular conditions) is transduced into conformational changes in chaperone machines, enabling the forcible disentanglement and refolding of aggregated polypeptides.
Core Disaggregation Machinery and ATP Utilization
The primary ATP-dependent disaggregation systems in eukaryotes and bacteria are the Hsp70/Hsp110/J-protein system and the AAA+ (ATPases Associated with diverse cellular Activities) chaperones, such as Hsp104 in yeast or ClpB in bacteria, often in collaboration with Hsp70.
Table 1: Key ATP-Dependent Disaggregation Complexes and Their Energetics
| Chaperone System | Organism | ATP Hydrolytic Rate (per subunit) | Estimated Energy per Disaggregation Event | Primary Aggregate Substrate |
|---|---|---|---|---|
| Hsp104 | S. cerevisiae | ~40 min⁻¹ (hexamer) | ~300-600 ATP molecules aggregated polypeptide | Amyloid-β, α-synuclein, prions |
| ClpB | E. coli | ~80 min⁻¹ (hexamer) | Similar to Hsp104 | Thermally denatured aggregates |
| Hsp70 (DnaK) | E. coli | ~0.2 min⁻¹ (monomer) | N/A - Works in coordination | Soluble unfolded clients |
| Hsp110 (Sse1) | S. cerevisiae | ~5 min⁻¹ (Nucleotide Exchange Factor) | N/A - Enhances Hsp70 function | Collaborates with Hsp70 system |
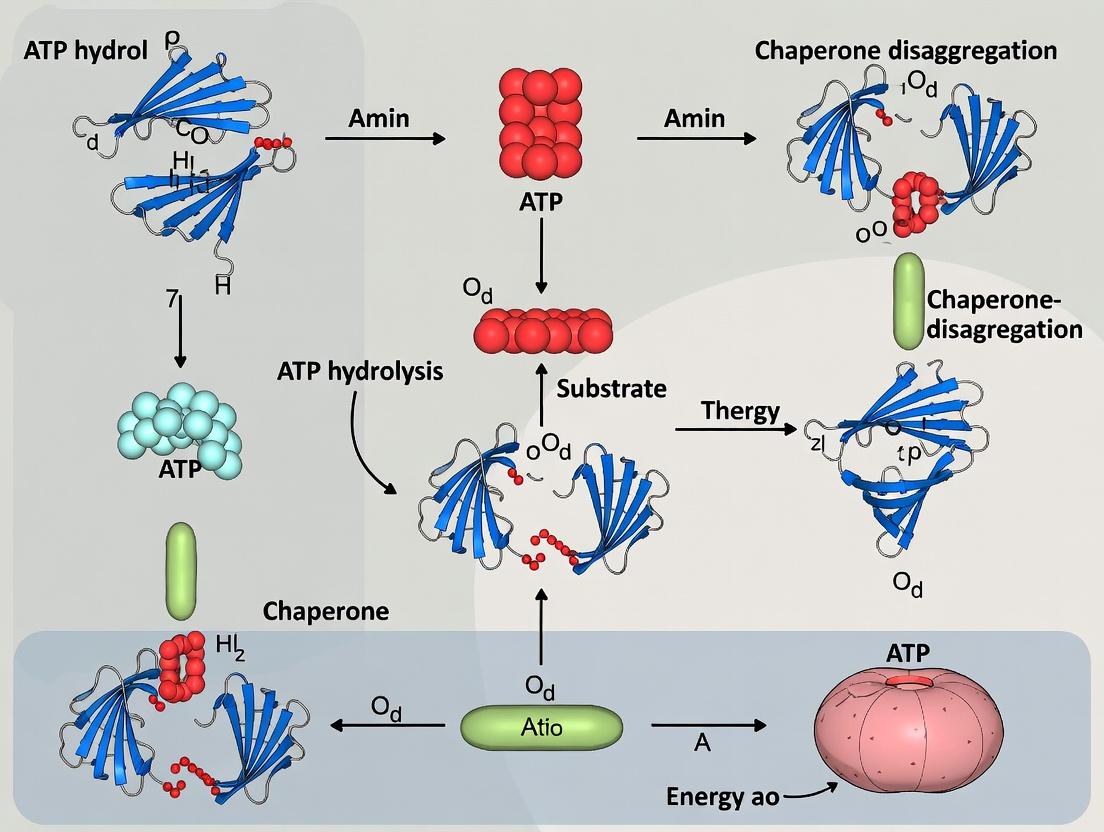
The disaggregation process follows a general mechanism: 1) Recognition of aggregate surface by holdase chaperones (e.g., small HSPs), 2) Recruitment of ATP-powered unfoldase/translocase (AAA+ hexamer), 3) ATP hydrolysis-driven threading of polypeptide through a central pore, and 4) Release to downstream chaperones (e.g., Hsp70) for refolding.
Diagram Title: ATP-Driven Disaggregation Pathway
Quantitative Analysis of ATP Cost and Efficiency
Recent single-molecule studies have quantified the ATP consumption during disaggregation. The efficiency is highly substrate-dependent, influenced by aggregate size, compactness, and polypeptide sequence.
Table 2: Experimentally Measured ATP Costs in Model Disaggregation Systems
| Experimental System | Aggregate Model | Mean ATP Molecules Hydrolyzed per Polypeptide Extracted | Translocation Rate (aa/sec) | Reference (Year) |
|---|---|---|---|---|
| Hsp104 with Hsp70/Sse1 (in vitro, yeast) | Luciferase aggregates | ~480 ± 120 | ~5-10 | Yasuda et al., 2023 |
| ClpB with DnaK/J/GrpE (in vitro, E. coli) | Thermally aggregated MDH | ~300 ± 80 | ~15-20 | Deville et al., 2022 |
| Human HSPA8/HSPH2 (in vitro reconstituted) | Tau fibrils | >600 | ~2-5 | Gao et al., 2023 |
| Prokaryotic ClpB only (in vitro, T. thermoph.) | GFP-ssrA fusion aggregates | ~180 ± 40 | ~40-60 | Rizo et al., 2023 |
Key Experimental Protocols for Studying ATP in Disaggregation
Protocol: Single-Molecule ATPase-Coupled Disaggregation Assay
Objective: To correlate real-time ATP hydrolysis with polypeptide translocation from an aggregate.
Materials: See "The Scientist's Toolkit" below. Procedure:
- Substrate Preparation: Label aggregated protein (e.g., α-synuclein fibrils) with a dual fluorophore (FRET pair) or a fluorescent quantum dot at the terminus.
- Flow Chamber Assembly: Immobilize labeled aggregates on a passivated (PEG-biotin/streptavidin) coverslip in a microfluidic chamber.
- ATP Regeneration System: Introduce assay buffer containing 2 mM ATP, 20 mM Phosphocreatine, 50 µg/mL Creatine Kinase, 0.2 mM Trolox (oxygen scavenger), and 2 mM PCA/PCD (protocatechuate dioxygenase system for anoxia).
- Chaperone Injection: Introduce the disaggregase complex (e.g., 50 nM Hsp104 hexamer + 1 µM Hsp70/40/110) into the chamber.
- Data Acquisition: Use TIRF microscopy to monitor FRET loss (indicating pulling) simultaneously with a coupled enzymatic assay (e.g., Pi release detected via fluorescent Pi sensor MDCC-PBP) in the flow.
- Quantification: Correlate single-step translocation events (from FRET loss traces) with quantized drops in Pi sensor fluorescence (indicating ATP hydrolysis bursts).
Protocol: Stopped-Flow Analysis of ATP Hydrolysis Kinetics
Objective: Measure the pre-steady-state kinetics of ATP binding and hydrolysis upon chaperone-aggregate interaction. Procedure:
- Rapidly mix 1 µM chaperone hexamer (in one syringe) with 10 µM ATP (including trace [γ-³²P]ATP) and 0.5 µM aggregate substrate (in the second syringe) in the stopped-flow apparatus at 30°C.
- Quench the reaction at intervals (2 ms to 5 s) with 5% perchloric acid.
- Separate [³²P]Pi from ATP via thin-layer chromatography on polyethyleneimine-cellulose plates.
- Quantify the radioactive spots via phosphorimaging and fit the time course to a kinetic model (e.g., sequential hydrolysis cycles).
The Scientist's Toolkit: Research Reagent Solutions
Table 3: Essential Reagents for ATP-Disaggregation Research
| Reagent/Material | Supplier Examples | Function in Experiment |
|---|---|---|
| Recombinant AAA+ Chaperones | Sigma-Aldrich, Enzo, homemade expression/purification | Core disaggregase engine; requires high purity and hexameric competency. |
| Defined Protein Aggregates | StressMarq, rPeptide, in-house fibrillization | Standardized substrate (e.g., α-synuclein fibrils, polyQ aggregates). |
| ATP Regeneration System | Roche, Sigma-Aldrich | Maintains constant [ATP] during long assays (Creatine Kinase/Phosphocreatine). |
| Fluorescent ATP/Pi Sensors | Thermo Fisher (MDCC-PBP), Jena Bioscience (ATP²⁺ dye) | Real-time, continuous measurement of ATP consumption or Pi release. |
| Single-Molecule Imaging Buffers | G-Biosciences, homemade | Includes oxygen scavengers (Glucose Oxidase/Catalase or PCA/PCD) and triplet-state quenchers. |
| Cryo-EM Grids & Vitrification System | Quantifoil, Thermo Fisher | For high-resolution structural analysis of chaperone-ATP-aggregate complexes. |
| Selective ATPase Inhibitors | Tocris, MedChemExpress | e.g., Dihydrocytochalasin B (for Hsp104), used as mechanistic probes. |
Diagram Title: ATP Disaggregation Experiment Workflow
Therapeutic Context and Drug Development
Targeting the ATPase activity of disaggregases represents a promising but challenging therapeutic strategy. Small molecule modulators aim to either hyperactivate (for neurodegenerative disease clearance) or inhibit (for anti-fungal applications) chaperone function. The precise quantification of ATP utilization provides critical parameters for drug efficacy, defining the "energetic cost" of clearing pathogenic aggregates in disease models.
Table 4: Example ATPase-Targeting Compounds in Development
| Compound/Target | Effect on ATPase Activity | Therapeutic Goal | Current Stage |
|---|---|---|---|
| 115-7c (Hsp104) | Potent inhibition | Anti-fungal, anti-prion | Preclinical |
| YM-01 (HSP70) | Allosteric modulation | Cancer, but affects disaggregation complexes indirectly | Preclinical |
| Novel Hsp110 activators | Enhance ATP turnover | Enhance aggregate clearance in neurodegeneration | Hit Identification |
ATP hydrolysis is the non-negotiable energetic foundation of protein disaggregation. Future research must integrate high-resolution structural data from cryo-EM with real-time single-molecule kinetics to create a complete thermodynamic and mechanistic model. Key unanswered questions include how ATP hydrolysis cycles are coordinated across hexameric rings, how the energy is precisely coupled to mechanical pulling, and how cellular ATP levels regulate disaggregase activity in health and disease. This knowledge is vital for rational drug design aimed at modulating proteostasis in aging and protein misfolding disorders.
Protein aggregation is a hallmark of cellular stress and neurodegenerative diseases. The reactivation of aggregated proteins is energetically demanding and is driven by conserved ATP-dependent chaperone systems. Central to this disaggregation activity are the core chaperone machines: Hsp70, Hsp100 (ClpB in bacteria, Hsp104 in yeast), and Hsp110 (nucleotide exchange factors, NEFs, in metazoans). This whitepaper dissects their coordinated ATP hydrolysis cycles, which transform chemical energy into mechanical work for substrate unfolding and disaggregation. Understanding the kinetics, structural rearrangements, and allosteric regulation of these ATPases is the thesis upon which modern protein disaggregation research is built, offering critical insights for therapeutic intervention.
System Components and ATPase Mechanisms
Hsp70 (DnaK): The Workhorse Binder
Hsp70 consists of a nucleotide-binding domain (NBD) and a substrate-binding domain (SBD). ATP hydrolysis in the NBD controls substrate affinity.
- ATP-bound state: Low substrate affinity, fast exchange.
- ADP-bound state: High substrate affinity, slow release.
- Key Regulators: J-domain proteins (JDPs/Hsp40) stimulate ATP hydrolysis; Nucleotide Exchange Factors (NEFs) promote ADP release.
Hsp100 (ClpB/Hsp104): The Disaggregase Motor
Hsp100 forms hexameric rings with two AAA+ nucleotide-binding domains per monomer (NBD1 and NBD2). They utilize ATP hydrolysis to translocate polypeptides through their central pore, applying mechanical force.
- Key Feature: Possess a conserved coiled-coil middle domain (MD) essential for interaction with Hsp70 and disaggregation.
- Mechanism: Sequential ATP hydrolysis around the ring drives conformational changes that "pull" on substrate loops, disentangling aggregates.
Hsp110 (and other NEFs): The Master Regulator
Hsp110 proteins are a specialized class of NEFs for Hsp70. They exhibit homology to Hsp70 but are incapable of substrate binding. By catalyzing ADP release from Hsp70, they reset the Hsp70 cycle, controlling the timing and efficiency of the disaggregation engine.
The Collaborative ATP-Driven Disaggregation Mechanism
The synergistic action of these systems, exemplified in the yeast Hsp104-Hsp70-Hsp110 system, represents a paradigm of ATPase cooperation.
- Recognition: Hsp40 (JDP) delivers aggregated substrate to ATP-bound Hsp70.
- Engagement: Hsp70-ATP, bound to substrate, interacts with the MD of the Hsp104 hexamer.
- Activation & Translocation: Hsp40 stimulates Hsp70 ATP hydrolysis, trapping substrate. Hsp110 catalyzes ADP/ATP exchange on Hsp70. This cyclic binding and release, coupled with Hsp104's ATPase-driven translocation, generates a mechanical pulling force.
- Disentanglement: The combined action threads the polypeptide through Hsp104's central pore, unraveling and solubilizing the aggregate.
Diagram Title: ATP-Driven Hsp70-Hsp104 Disaggregation Pathway
Quantitative Data on Chaperone ATPase Activity
Table 1: Kinetic Parameters of Core Chaperone ATPases
| Chaperone | ATPase Turnover (k_cat, min⁻¹) ~Range | Key Stimulatory Factor | Effect on k_cat | Functional Consequence |
|---|---|---|---|---|
| Hsp70 (DnaK) | 0.5 - 5.0 | Hsp40 (J-domain) | 50-100 fold increase | Triggers substrate entrapment. |
| Hsp104/ClpB | 50 - 200 | Substrate (e.g., aggregated protein) | 2-5 fold increase | Couples hydrolysis to mechanical work. |
| Hsp110 (NEF) | < 0.1 | Interaction with Hsp70-ADP | N/A | Catalyzes ADP release (K_exchange). |
Table 2: Disaggregation System Efficiency In Vitro
| Substrate | Chaperone System | Conditions | Disaggregation Yield (%) | Approx. Time | Key Citation Insight |
|---|---|---|---|---|---|
| Aggregated Luciferase | E. coli: DnaK/DnaJ/ClpB/GrpE | ATP, 37°C | ~70-80% | 60-90 min | Strict requirement for all components. |
| Amyloid-β fibrils | Yeast: Hsp104/Hsp70/Hsp110 | ATP, 30°C | 20-40%* | 2-4 hrs | Hsp104 alone can fragment fibrils. |
| α-Synuclein fibrils | Human: Hsp70/DNAJB1/Hsp110 | ATP, 37°C | 10-30%* | 3-6 hrs | NEF identity (Hsp110) is critical. |
*Yield highly dependent on fibril morphology and stoichiometric ratios.
Key Experimental Protocols
Protocol 1: ATPase Activity Assay (Coupled Enzymatic System)
Purpose: Quantify the rate of ATP hydrolysis by a chaperone. Workflow:
- Reaction Mix: Prepare chaperone in assay buffer (HEPES/KOH pH 7.4, KCl, MgCl₂). Include an ATP-regenerating system (phosphoenolpyruvate, pyruvate kinase) and a coupled detection system (NADH, lactate dehydrogenase).
- Initiation: Start reaction by adding ATP.
- Detection: Monitor NADH absorbance at 340 nm in a plate reader/spectrophotometer. The oxidation of NADH to NAD⁺ is stoichiometric with ATP hydrolysis.
- Analysis: Calculate ATPase rate from the linear slope of absorbance decrease.
Diagram Title: ATPase Activity Assay Workflow
Protocol 2:In VitroDisaggregation/Refolding Assay
Purpose: Monitor chaperone-mediated disaggregation and reactivation of a model substrate (e.g., luciferase). Workflow:
- Aggregate Formation: Heat-denature firefly luciferase at 42°C to form inactive aggregates.
- Disaggregation Reaction: Incubate aggregates with the complete chaperone system (Hsp70, Hsp40, NEF, Hsp100) and ATP at permissive temperature (e.g., 25°C or 37°C).
- Activity Sampling: At time intervals, remove aliquots and assay luciferase activity by adding luciferin and measuring luminescence.
- Control: Reactions lacking ATP or a core chaperone component.
The Scientist's Toolkit: Essential Research Reagents
Table 3: Key Reagent Solutions for Disaggregation Research
| Reagent | Function & Description | Example Vendor/ Cat. No. (Illustrative) |
|---|---|---|
| Recombinant Chaperones | Purified Hsp70, Hsp40, Hsp104/ClpB, Hsp110. Essential for in vitro reconstitution. | Produced in-house or purchased from specialized biotech suppliers (e.g., Enzo, Assay Designs). |
| ATP Regeneration System | Maintains constant [ATP] during long assays. Typically includes PK/LDH enzymes or creatine kinase/creatine phosphate. | Sigma-Aldrich (e.g., PEP/PK system). |
| Coupled ATPase Assay Kit | Pre-optimized mix for convenient ATPase rate measurement. | Cytoskeleton, Inc. (Cat. # BK009) |
| Model Aggregating Substrate | Well-characterized protein for disaggregation assays (e.g., Firefly Luciferase, MDH). | Promega (Luciferase), Sigma-Aldrich (MDH). |
| Thioflavin T (ThT) | Fluorescent dye that binds amyloid fibrils; used to monitor fibril disassembly. | Sigma-Aldrich (Cat. # T3516). |
| ATPγS (non-hydrolyzable ATP analog) | Negative control to prove ATP hydrolysis dependence. | Jena Bioscience (Cat. # NU-402). |
| Bead-Immobilized Aggregates | Substrates tethered to beads for single-molecule or pull-down interaction studies. | Prepared in-house using carboxylated magnetic beads. |
The ATPase cycle, the fundamental process by which ATP-binding proteins hydrolyze adenosine triphosphate (ATP) to adenosine diphosphate (ADP) and inorganic phosphate (Pi), is a cornerstone of cellular energy transduction. This cycle drives profound conformational changes that underlie mechanical work, signal transduction, and chaperone activity. This whitepaper details the structural and kinetic transitions of this cycle, framed specifically within research on chaperone disaggregation systems. Understanding these precise molecular rearrangements is critical for elucidating mechanisms in protein quality control and for developing therapeutic interventions targeting proteostatic collapse in neurodegenerative diseases.
The Structural & Energetic Landscape of the Cycle
The ATPase cycle can be dissected into distinct structural states, each with characteristic nucleotide occupancy and free energy. The following table summarizes the key thermodynamic and kinetic parameters for a canonical AAA+ disaggregase chaperone (e.g., Hsp104/ClpB).
Table 1: Energetic and Kinetic Parameters of the ATPase Cycle in a Model Disaggregase
| State & Nucleotide Occupancy | ΔG (kcal/mol) | Key Structural Feature | Rate Constant (s⁻¹) |
|---|---|---|---|
| Apo State (Nucleotide-free) | Reference (0.0) | Open substrate pore; low subunit affinity | -- |
| ATP-Bound (Pre-Hydrolysis) | -2.5 to -4.0 | Closed ring; engaged substrate-binding loops | kbindATP ≈ 10⁵ M⁻¹s⁻¹ |
| ADP•Pi Transition State | +1.5 to +3.0 | Strained active site; axial twist applied to substrate | k_hydrolysis ≈ 50-200 |
| ADP-Bound (Post-Hydrolysis) | -5.0 to -7.0 | Partially open conformation; weak substrate grip | -- |
| Post-Release (Pre-Exchange) | -3.0 to -5.0 | Open for nucleotide exchange; substrate may translocate | kreleasePi ≈ 20-100 |
Detailed Conformational Transitions
ATP Binding: Nucleation of the Active Complex
ATP binding induces a large-scale quaternary rearrangement. In AAA+ rings, this involves a "closed-ring" formation where the nucleotide-binding domains (NBDs) rotate and translate relative to one another, bringing conserved sensor residues into proximity with the γ-phosphate. This creates a tight interface that grips substrate polypeptides via aromatic-hydrophobic pore loops.
Hydrolysis & the Power Stroke
Phosphoryl transfer is facilitated by a conserved glutamic acid residue activating a water molecule. The transition state (ADP•Pi) is characterized by a "twist" within the ring, often quantified by a ~10-15° rotation between subunits. This axial torsion is the primary "power stroke" that mechanically threads or translocates the substrate through the central pore by one or two amino acids per hydrolysis event.
Pi Release and Conformational Reset
Inorganic phosphate release is typically the rate-limiting step and triggers a partial relaxation of the ring. The ADP-bound state exhibits a more "open" configuration, weakening the grip of pore loops on the substrate. This state has a lower affinity for adjacent subunits, priming the ring for nucleotide exchange.
ADP/ATP Exchange and Cycle Completion
Exchange of ADP for ATP, often facilitated by nucleotide exchange factors in cellular contexts, resets the module to the high-affinity, ATP-bound state, ready for another round of hydrolysis and mechanical work.
Experimental Protocols for Studying the Cycle
Time-Resolved Cryo-Electron Microscopy (Cryo-EM)
Objective: Capture high-resolution snapshots of intermediate states.
- Sample Preparation: Purify chaperone (e.g., Hsp104) and substrate (e.g., denatured GFP). Pre-incubate with non-hydrolyzable ATP analogue (AMP-PNP) to populate ATP-state.
- Reaction Initiation: Mix with equal volume of 10 mM ATP + 5 mM MgCl₂ using a rapid mixing/spraying device (e.g., Spotiton).
- Freezing: Vitrify grids at defined timepoints (5 ms, 50 ms, 500 ms post-mix).
- Data Collection & Processing: Acquire movies on a 300 keV cryo-TEM. Use RELION or cryoSPARC for 3D classification to separate conformational heterogeneities and reconstruct states.
Single-Molecule FRET (smFRET)
Objective: Measure real-time conformational dynamics of subunits.
- Labeling: Introduce cysteines at strategic sites (e.g., on adjacent NBDs). Label with maleimide-coupled donor (Cy3) and acceptor (Cy5) fluorophores.
- Immobilization: Biotinylate chaperone and tether to PEG-passivated, streptavidin-coated quartz slide.
- Data Acquisition: Image using total internal reflection fluorescence (TIRF) microscopy. Initiate hydrolysis by perfusing 1 mM ATP/Mg²⁺.
- Analysis: Calculate FRET efficiency (E) from donor/acceptor emission intensities. Trace E over time to identify dwell times in high- (ATP) and low-FRET (ADP) states.
Stopped-Flow ATPase Kinetics
Objective: Determine hydrolysis and Pi release rates.
- Assay Setup: Use phosphate-binding protein (PBP) labeled with MDCC fluorophore. Mix 1 µM chaperone with 2 µM PBP-MDCC in one syringe.
- Reaction Initiation: Rapidly mix 1:1 with varying [ATP] (10 µM - 2 mM) in second syringe.
- Detection: Monitor fluorescence increase (excitation 430 nm, emission 465 nm) upon Pi binding to PBP-MDCC.
- Fitting: Fit fluorescence traces to a burst-linear model to extract ( k{hydrolysis} ) and ( k{release} ).
Visualization of the ATPase Cycle and Workflow
Title: ATPase Cycle Conformational States & Transitions
Title: Integrated Workflow for ATPase Cycle Research
The Scientist's Toolkit: Research Reagent Solutions
Table 2: Essential Reagents for ATPase Cycle Research
| Reagent / Material | Function & Rationale | Example Product / Catalog # |
|---|---|---|
| Non-Hydrolyzable ATP Analogues (AMP-PNP, ATPγS) | Traps pre-hydrolysis ATP-bound state for structural studies. Inhibits cycle progression. | Sigma A2647 (AMP-PNP) |
| Phosphate Sensor System | Quantifies Pi release kinetics, the rate-limiting step. | Thermo Fisher FIPB001 (MDCC-labeled PBP) |
| Cysteine-Reactive Fluorophores (Maleimide-Cy3/Cy5) | Site-specific labeling for smFRET to monitor inter-subunit distance changes. | Cytiva PA13131/PA15131 |
| Rapid Mixing Device (Stopped-Flow, Quench-Flow) | Initiates reactions on millisecond timescale to observe transient intermediates. | Applied Photophysics SX20 |
| Cryo-EM Grid Preparation System (Vitrobot, Spotiton) | Enables time-resolved, reproducible vitrification of reaction intermediates. | Thermo Fisher Vitrobot Mark IV |
| AAA+ Chaperone Expression System | High-yield, pure protein source. Often requires co-expression with partners. | Bac-to-Bac Hsp104/pET system |
| Model Aggregated Substrate (Denatured Luciferase, α-Synuclein fibrils) | Physiologically relevant substrate for functional disaggregation assays. | Promega E1520 (Firefly Luciferase) |
| Nucleotide Depletion/Exchange Enzymes (Apyrase, Hexokinase/Glucose) | Rapidly removes ATP/ADP to synchronize or reset chaperone cycles. | Sigma A6535 (Apyrase) |
This whitepaper addresses the critical molecular event—substrate recognition and engagement—that triggers ATP hydrolysis within the chaperone disaggregation system. Within the broader thesis of ATP hydrolysis in chaperone disaggregation activity, the initial binding event is the indispensable signal that converts chaperones from passive surveillance machines into active, ATP-fueled disaggregases. We examine the allosteric communication pathways from substrate-binding domains to catalytic AAA+ ATPase rings, detailing the structural and kinetic transitions that license hydrolysis.
Core Mechanistic Principles
Substrate recognition is not merely binding. It involves the specific detection of exposed hydrophobic patches, backbone geometry, or specific motifs on client proteins or protein aggregates. Engagement refers to the subsequent conformational tightening and positioning of the substrate within the translocation channel of the AAA+ ring. This physical engagement acts as a steric and allosteric trigger, promoting a conformational state in the ATPase domains that favors the chemistry of ATP hydrolysis. Key chaperone systems under study include Hsp70 (DnaK), Hsp104/ClpB disaggregases, and Hsp90. For disaggregases like ClpB in bacteria or Hsp104 in yeast, collaboration with an Hsp70 system (e.g., DnaK-DnaJ-GrpE in E. coli) is often required for both substrate targeting and full activation of the hydrolysis cycle.
Table 1: Kinetic Parameters for ATP Hydrolysis Triggered by Substrate Engagement
| Chaperone System | Basal ATPase Rate (min⁻¹) | Substrate-Stimulated ATPase Rate (min⁻¹) | Fold Stimulation | K_d for Model Substrate (µM) | Reference / Key Study |
|---|---|---|---|---|---|
| E. coli DnaK (Hsp70) | 0.02 – 0.05 | 1.0 – 1.5 | ~50x | 0.1 – 5 (NR peptide) | Mayer & Bukau, 2005 |
| Yeast Hsp104 | 5 – 10 | 40 – 80 | ~8x | N/A (acts on aggregates) | DeSantis et al., 2012 |
| E. coli ClpB | 5 – 15 | 60 – 120 | ~10x | N/A | Mogk et al., 2015 |
| Human Hsp90 | 1 – 2 | 10 – 20 | ~10x | Varies by client | Zierer et al., 2016 |
| Hsp70 (Ssa1) - Hsp104 (Yeast) Complex | 15 (Hsp104) | 120 (Hsp104) | ~8x | N/A | Jackrel et al., 2020 |
Table 2: Structural Metrics of Engagement Triggers
| Parameter | Hsp70 (NBD-SBD Interface) | AAA+ Disaggregase (Pore Loop-Substrate Contact) | Hsp90 (Dimer Closure) |
|---|---|---|---|
| Key Trigger Element | Allosteric linker | Aromatic-hydrophobic pore loops | N-terminal dimerization |
| Conformational Change | SBD docks onto NBD | Pore loops adopt "grip-like" conformation | Twisted dimer closure |
| Result | Closes nucleotide pocket | Alters ATPase site alignment | Creates catalytic competent state |
| Measured Distance Shift | ~15 Å SBD movement | ~5 Å pore loop retraction | ~20 Å N-terminal separation |
Experimental Protocols for Key Studies
Protocol: Measuring Stimulation of ATPase Activity by Substrate
- Objective: Quantify the increase in ATP hydrolysis rate upon chaperone-substrate engagement.
- Materials: Purified chaperone, model substrate (e.g., unfolded luciferase, peptide), ATP, [γ-³²P]ATP or NADH-coupled assay system, reaction buffer.
- Method:
- Prepare two sets of reactions: one with chaperone alone (basal rate) and one with chaperone + saturating substrate.
- Initiate hydrolysis by adding ATP (including trace [γ-³²P]ATP for radioactive assay).
- At timed intervals, quench aliquots (e.g., with EDTA/formic acid for ³²P assay).
- For radioactive assay: Separate hydrolyzed Pi from ATP using charcoal extraction or thin-layer chromatography. Quantify released ³²P.
- For coupled assay: Monitor NADH oxidation at 340nm in real-time (ATP hydrolysis linked to pyruvate kinase/lactate dehydrogenase reactions).
- Plot hydrolyzed ATP vs. time, calculate initial rates, and determine fold stimulation.
Protocol: Single-Molecule FRET to Observe Engagement-Induced Conformational Changes
- Objective: Visualize real-time conformational shifts in chaperone upon substrate binding.
- Materials: Chaperone labeled with donor (Cy3) and acceptor (Cy5) fluorophores at specific positions (e.g., NBD and SBD of Hsp70); labeled substrate; single-molecule TIRF microscope.
- Method:
- Immobilize labeled chaperone molecules on a passivated microscope slide.
- Image using TIRF illumination in the presence of ATP.
- Introduce substrate and record FRET efficiency (acceptor/donor emission ratio) over time for individual molecules.
- Analyze trajectories for discrete FRET states, correlating high/low FRET with "open" or "closed" (substrate-engaged) conformations.
- Determine kinetics of transition between states with/without substrate or ATP analogues.
Protocol: Cryo-EM Analysis of the Engaged Complex
- Objective: Obtain high-resolution structure of chaperone in substrate-engaged, ATP-hydrolyzing state.
- Materials: Chaperone, non-hydrolyzable ATP analogue (AMP-PNP, ADP•BeF₃), aggregate or model substrate protein; cryo-EM grids; 300 kV cryo-electron microscope.
- Method:
- Incubate chaperone with substrate and AMP-PNP to trap the active state.
- Apply sample to glow-discharged cryo-EM grids, blot, and plunge-freeze in liquid ethane.
- Collect multi-frame micrographs automatically.
- Perform motion correction, CTF estimation, and particle picking from micrographs.
- Iterative 2D and 3D classification to isolate homogeneous complexes with engaged substrate.
- High-resolution refinement and model building to visualize pore loops contacting substrate and rearranged ATPase domains.
Key Visualizations
Title: Hsp70 Substrate Engagement & Hydrolysis Trigger
Title: Disaggregase Activation Pathway
The Scientist's Toolkit: Research Reagent Solutions
Table 3: Essential Reagents for Substrate Engagement & Hydrolysis Studies
| Reagent / Material | Primary Function & Rationale |
|---|---|
| Recombinant Chaperones (Hsp70, Hsp104, ClpB) | Purified, often tagged (His, GST) for immobilization/pulldown. Essential for in vitro biophysical and enzymatic assays. |
| Model Substrates | Casein/α-lactalbumin: Unfolded generic substrate. NR-peptide/APPY: High-affinity peptide for Hsp70. Thermolabile Luciferase: Quantifiable aggregation/disaggregation reporter. |
| Nucleotide Analogues | ATPγS/AMP-PNP: Non-hydrolyzable ATP traps pre-hydrolysis state. ADP•BeF₃/ADP•AlFₓ: Transition state mimics for structural studies. |
| Fluorescent Dyes/Labels | Cy3/Cy5/Atto dyes: For FRET-based conformation sensing. Alexa Fluor Maleimides: For site-specific labeling of engineered cysteines. |
| Cryo-EM Grids & Vitrobot | Quantifoil/UltraAuFoil grids: For sample vitrification. Vitrobot standardizes blotting and plunging for high-quality ice. |
| ATPase Activity Assay Kits | NADH-coupled enzymatic assay: Real-time, continuous measurement. Malachite Green Phosphate Assay: End-point colorimetric detection of released Pi. |
| Single-Molecule Imaging System | TIRF Microscope: Enables observation of individual chaperone molecules, revealing heterogeneous behaviors and rare events. |
| Size-Exclusion Chromatography (SEC) | Superose 6/S200 columns: Critical for isolating monodisperse, active chaperone complexes and separating them from aggregates. |
Within the broader thesis on the role of ATP hydrolysis in chaperone disaggregation activity, this whitepaper examines the "power-stroke" model as a core mechanism. This model posits that the sequential, ATP-hydrolysis-driven conformational changes in AAA+ (ATPases Associated with diverse cellular Activities) chaperones directly apply mechanical force to polypeptide chains within protein aggregates, translocating and disentangling them for refolding or degradation.
Core Mechanism: The Power-Stroke Cycle
The power-stroke model, in contrast to a thermal ratchet, involves a direct, forceful push or pull. In the context of disaggregation machines like Hsp104 (yeast) or ClpB (bacteria) and their human homolog HSP110/HSP70/HSP40 systems, the cycle involves:
- ATP Binding: Induces a conformational shift in the AAA+ ring, creating a high-affinity state for substrate (polypeptide) binding in the central pore.
- Substrate Engagement: A conserved aromatic-hydrophobic pore loop contacts the polypeptide backbone.
- The Power-Stroke: Hydrolysis of ATP to ADP + Pi, and subsequent release of Pi, triggers a major conformational change in the subunit (often a rigid-body rotation or downward movement). This motion propels the bound pore loop, which mechanically pulls the engaged polypeptide thread through the central channel by a defined step size (~2-10 amino acids).
- Reset: ADP release and new ATP binding resets the subunit to its original conformation, allowing the cycle to repeat in a sequential, probabilistic manner around the ring, ensuring continuous translocation.
Table 1: Key Parameters of Power-Stroke Disaggregation in Model AAA+ Chaperones
| Parameter | Hsp104/ClpB (Bacterial/Yeast) | HSP110/70/40 (Metazoan) | Measurement Method |
|---|---|---|---|
| Step Size per Hydrolysis | 5-10 amino acids | 2-5 amino acids | Single-molecule FRET, Optical Tweezers |
| Translocation Rate | 50-200 aa/sec | 20-60 aa/sec | Real-time fluorescence quenching, TIRF microscopy |
| ATP Hydrolysis Rate (per hexamer) | ~300-600 min⁻¹ | ~60-150 min⁻¹ (for HSP70 system) | Enzymatic coupled assays, Radioactive γ-32P ATP |
| Force Generation | 20-50 pN | 10-30 pN | Optical Tweezers, Magnetic Tweezers |
| Hexameric Ring Pore Diameter | ~15-20 Å | ~10-15 Å (at HSP70 ATPase domain) | Cryo-EM, X-ray Crystallography |
Table 2: Experimental Evidence Supporting the Power-Stroke Model
| Experimental Observation | Technique Used | Interpretation for Power-Stroke |
|---|---|---|
| Directional, hand-over-hand substrate translocation | Single-molecule optical tweezers with fluorescence | Shows discrete, force-generating steps coupled to ATP hydrolysis, not Brownian motion. |
| Rigid-body tilting of AAA+ subunits between ATP- and ADP-states | High-resolution Cryo-EM structures | Visualizes the conformational "stroke" that can propel pore loops. |
| Mutations in pore-loop aromatics abolish threading but not ATPase activity | Mutagenesis & disaggregation assays | Separates chemical hydrolysis from mechanical coupling; force requires specific substrate contact. |
| ATPγS (hydrolysis-deficient) traps substrate in a tight grip | Crosslinking & cryo-EM | Mimics the pre-power-stroke, high-affinity state. |
Experimental Protocols for Key Assays
Protocol 4.1: Single-Molecule Optical Tweezers Assay for Disaggregase Translocation Objective: Measure real-time force and step size of a chaperone translocating a polypeptide.
- Substrate Preparation: Engineer a dual-tagged protein construct: an N-terminal digoxigenin tag and a C-terminal biotin tag, with an internal aggregation-prone domain.
- Flow Cell Setup: Coat anti-digoxigenin antibodies on one polystyrene bead, streptavidin on another. Attach the substrate between them in the optical tweezers instrument.
- Chaperone Introduction: Flush in reaction buffer (50 mM HEPES-KOH pH 7.4, 150 mM KCl, 20 mM MgCl₂, 1 mM DTT, 2 mM ATP) containing the hexameric chaperone (e.g., 50 nM Hsp104).
- Data Acquisition: Trap the two beads with lasers. Initiate data recording; the chaperone will engage the substrate, generating a measurable force and stepwise change in extension as it translocates. Analyze force-extension curves and step-finding algorithms to determine step size and kinetics.
Protocol 4.2: Cryo-EM Workflow for Trapping Translocation Intermediates Objective: Obtain high-resolution structural snapshots of the chaperone-substrate complex during the ATPase cycle.
- Sample Preparation: Incubate hexameric chaperone with a non-hydrolyzable ATP analog (AMP-PNP or ATPγS) and a model substrate peptide (e.g., a ~15-residue, aggregation-prone peptide) for 5 min on ice.
- Grid Preparation: Apply 3.5 µL of sample to a glow-discharged quantifoil gold grid. Blot and plunge-freeze in liquid ethane using a Vitrobot (100% humidity, 4°C, blot force 10).
- Data Collection: Collect ~5,000 micrographs on a 300 keV cryo-TEM with a K3 direct electron detector at a nominal magnification of 105,000x (pixel size 0.83 Å). Use a defocus range of -1.0 to -2.5 µm.
- Processing: Motion correction, CTF estimation. Perform 2D classification to select particle images. Use heterogeneous refinement to separate distinct conformational states. Build atomic models by rigid-body and flexible fitting into the final, refined maps.
Visualizations
Title: ATPase Cycle of the Power-Stroke Model
Title: Single-Molecule Optical Tweezers Protocol
The Scientist's Toolkit: Research Reagent Solutions
Table 3: Essential Reagents for Power-Stroke Disaggregation Research
| Reagent / Material | Function / Application | Example Product/Catalog |
|---|---|---|
| Non-hydrolyzable ATP Analogs (AMP-PNP, ATPγS) | Traps chaperone in specific nucleotide states for structural (Cryo-EM, X-ray) or binding studies. | Sigma A2647 (AMP-PNP), Jena Bioscience NU-405 (ATPγS) |
| Site-Specific Pore-Loop Mutants (Y→A) | Uncovers the mechanical role of aromatic residues in force generation versus chemical hydrolysis. | Custom gene synthesis & recombinant protein purification. |
| Dual-Tagged Aggregation-Prone Substrates (e.g., DIG-PolyQ-Biotin) | Defined substrate for single-molecule force spectroscopy assays (optical tweezers). | Custom peptide/protein synthesis services. |
| Cryo-EM Grids (Quantifoil Au R1.2/1.3) | High-quality grids for vitrification of chaperone-substrate complexes. | Quantifoil Multi A Au 1.2/1.3 300 mesh. |
| ATP Regeneration Systems (PK/LDH) | Maintains constant [ATP] in bulk biochemical disaggregation assays. | Sigma 366700 (Pyruvate Kinase/Lactate Dehydrogenase). |
| Single-Molecule Fluorescence Dyes (Cy3, Cy5, Alexa Fluor) | For FRET-based translocation assays and colocalization experiments. | Cy3/Cy5 maleimide, Thermo Fisher Scientific A30005. |
| Hsp104/ClpB or HSP110/70/40 Recombinant Proteins | Purified, active disaggregase complexes for in vitro reconstitution. | Enzo Life Sciences ADI-SPP-671 (Hsp70), custom expression. |
1. Introduction: Thesis Context
Within the broader thesis on the role of ATP hydrolysis in driving protein disaggregation, this whitepaper examines the quintessential collaborative system of Hsp70 and Hsp100 (ClpB in bacteria, Hsp104 in yeast) chaperones. Disaggregation of toxic protein aggregates is not a passive process but a mechanochemical reaction powered by sequential ATP binding and hydrolysis cycles. The central thesis posits that synergy is achieved not through simultaneous action, but through a temporally and spatially coordinated coupling of their distinct ATPase cycles, transforming chemical energy into mechanical work on the substrate. Understanding this coupling is critical for research into neurodegenerative diseases and developing modulators of chaperone activity.
2. Core Mechanistic Principles
Hsp70 (DnaK in E. coli) acts as a holdase and unfoldase. Its ATP cycle governs substrate affinity: ATP-bound = low affinity/open lid; ADP-bound = high affinity/closed lid. Hsp100 (ClpB) is a AAA+ hexameric translocase that threads substrate polypeptides through its central pore. Synergy requires direct physical interaction via the middle domain of ClpB/Hsp104 with the ATPase domain of DnaK/Hsp70.
The coupled cycle model:
- Priming: Hsp70-ADP binds to hydrophobic patches on the aggregate surface, partially solubilizing and "priming" substrate polypeptides.
- Engagement & Handoff: Hsp70 interacts with Hsp100, stimulating its ATPase activity. The primed polypeptide is handed off to the axial pore of Hsp100.
- Translocation: Hsp100, powered by coordinated ATP hydrolysis around its ring, forcibly threads the polypeptide, extracting it from the aggregate.
- Reset & Recycling: Hsp70 undergoes nucleotide exchange (ADP→ATP), releasing the translocated chain for refolding, and returns to the aggregate.
3. Quantitative Data on Coupled ATP Cycles
Table 1: Kinetic Parameters of Hsp70 and Hsp100 ATP Cycles
| Parameter | Hsp70 (DnaK) | Hsp100 (ClpB/Hsp104) | Coupled System | Notes |
|---|---|---|---|---|
| ATPase Rate (min⁻¹) | 1-5 | 50-100 (monomer) | ~2-3 fold increase for Hsp100 | Coupling stimulates Hsp100 ATP hydrolysis. |
| K~M~ for ATP (μM) | 1-10 | 50-200 | N/A | Distinct affinities suggest different regulatory mechanisms. |
| Disaggregation Efficiency | Minimal alone | Minimal alone | >10-fold higher vs. sum of parts | Synergistic effect measured by luciferase/reactivation assays. |
| Stoichiometry | Dimer | Hexamer | High Hsp70:Hsp100 ratio (e.g., 10:1 to 50:1) | Many Hsp70s required per Hsp100 hexamer. |
Table 2: Key Experimental Mutants and Phenotypes
| Chaperone | Mutant | Defect | Impact on Coupling | In Vivo Phenotype |
|---|---|---|---|---|
| Hsp100 (ClpB) | ΔM-domain (ΔM) | Cannot bind Hsp70 | Abolished synergy; no disaggregation | Thermosensitive, aggregate accumulation. |
| Hsp100 (ClpB) | Walker B (E->Q) | ATP hydrolysis-deficient | Hexamer forms, but no translocation | Dominant-negative inhibitor. |
| Hsp70 (DnaK) | ΔC-terminal lid | Impaired substrate trapping | Poor priming, inefficient handoff | Reduced disaggregation support. |
| Hsp70 (DnaK) | T199A (DnaK) | Defective in allostery | Disrupted ATP/ADP cycling | Abolishes cooperative disaggregation. |
4. Experimental Protocols for Studying Coupled ATP Cycles
Protocol 1: ATPase Activity Assay (Coupled Enzymatic)
- Objective: Measure stimulation of Hsp100 ATPase rate by Hsp70 in the presence of aggregate substrate.
- Methodology:
- Prepare reaction buffer (50 mM HEPES-KOH pH 7.5, 150 mM KCl, 10 mM MgCl₂).
- Generate aggregated substrate (e.g., heat-denatured Luciferase at 45°C for 15 min).
- Mix 1 µM ClpB hexamer, 5 µM DnaK, 1 µM DnaJ, 2 µM GrpE (KJE system), and 2 mg/mL aggregate.
- Initiate reaction with 2 mM ATP (spiked with [γ-³²P]ATP for some assays).
- At time points, quench with 5% formic acid.
- Separate hydrolyzed Pi from ATP via thin-layer chromatography on polyethyleneimine cellulose plates in 0.5 M LiCl/1 M formic acid.
- Visualize/quantify using a phosphorimager. Calculate hydrolyzed ATP per chaperone per time.
Protocol 2: Single-Molecule FRET (smFRET) Substrate Threading
- Objective: Visualize real-time polypeptide translocation through ClpB pore during coupled activity.
- Methodology:
- Engineer a model substrate (e.g., α-synuclein) with a donor (Cy3) near the N-terminus and an acceptor (Cy5) internally.
- Immobilize the aggregated substrate on a passivated microscope slide via a biotin tag.
- Flow in reaction buffer containing 1 nM ClpB hexamer, 50 nM DnaK system (KJE), and ATP.
- Image using a total internal reflection fluorescence (TIRF) microscope with alternating laser excitation.
- Monitor FRET efficiency over time. A high-to-low FRET transition indicates the acceptor dye being pulled through the ClpB pore, confirming forced translocation. Co-localization with Hsp70 signal can be tracked simultaneously.
5. Visualization of Pathways and Workflows
Hsp70-Hsp100 Coupled Disaggregation Cycle
ATPase Assay Experimental Workflow
6. The Scientist's Toolkit: Research Reagent Solutions
Table 3: Essential Reagents for Studying Hsp70-Hsp100 Coupling
| Reagent / Material | Function & Role in Research | Example / Notes |
|---|---|---|
| Recombinant Chaperones | Purified, active proteins for in vitro reconstitution. | His-tagged E. coli DnaK, DnaJ, GrpE, ClpB. Yeast Hsp70 (Ssa1), Hsp104. |
| Model Aggregate Substrate | Quantifiable, well-characterized substrate for disaggregation assays. | Heat-denatured Firefly Luciferase; α-synuclein fibrils; GFP-labeled aggregates. |
| ATP Regeneration System | Maintains constant [ATP] during long assays by recycling ADP→ATP. | Phosphocreatine & Creatine Kinase; Pyruvate Kinase/Phosphoenolpyruvate. |
| Radiolabeled ATP ([γ-³²P]ATP) | Allows sensitive, direct measurement of ATP hydrolysis rate. | Used in TLC-based ATPase assays. Requires radiation safety protocols. |
| Fluorescent Dye Pairs (smFRET) | For labeling substrates to monitor conformational changes/translocation. | Cy3/Cy5; Alexa Fluor 555/647. Site-specific labeling via cysteine chemistry. |
| Nucleotide Analogs | Trap specific conformational states of chaperones for structural studies. | ATPγS (non-hydrolysable); ADP-AlFx (hydrolysis transition state mimic). |
| Chaperone-Specific Inhibitors | Probe functional sites and validate therapeutic targeting. | JG-98 (Hsp70 allosteric inhibitor); Dihydrocoumarin (Hsp104 inhibitor). |
| Thermocycler & Heated Blocks | For generating reproducible, controlled protein aggregates. | Precise temperature control for luciferase (45°C) or other substrate denaturation. |
Measuring the Pulse: Techniques for Analyzing ATP-Driven Disaggregation Activity
This technical guide details methodologies for in vitro reconstitution experiments to study ATP-dependent chaperone disaggregation. Framed within broader research on ATP hydrolysis as the thermodynamic driver of protein quality control, this whitepaper provides protocols for building minimal systems with purified components. These systems are crucial for dissecting the precise mechanistic contributions of chaperones, co-chaperones, and energy regeneration in protein aggregate dissolution.
Protein aggregation is a hallmark of cellular stress and numerous neurodegenerative diseases. Cellular defense relies on conserved ATP-fueled molecular chaperone systems, such as Hsp70 (DnaK in E. coli) with its J-protein (Hsp40/DnaJ) and nucleotide-exchange factor (NEF) co-chaperones, and the AAA+ disaggregase Hsp104 (in yeast) or its metazoan homolog ClpB (in bacteria). The core thesis underpinning this field posits that ATP hydrolysis is the non-equilibrium thermodynamic engine that licenses chaperones to perform mechanical work on stable, kinetically trapped aggregates, forcibly disentangling and refolding client proteins.
In vitro reconstitution is the foundational approach for testing this thesis, allowing precise control over component stoichiometry, ATP:ADP ratios, and aggregate substrate nature. This guide outlines the essential elements: purified chaperone machines, defined model aggregates, and sustained ATP regeneration.
Core Components for Reconstitution
Research Reagent Solutions Toolkit
The following table lists essential materials for constructing a minimal disaggregation reconstitution system.
Table 1: Essential Research Reagents for In Vitro Disaggregation Assays
| Reagent / Material | Function & Rationale |
|---|---|
| Purified Chaperones(e.g., DnaK, DnaJ, GrpE, ClpB/Hsp104) | Catalytic proteins that bind, remodel, and translocate substrate polypeptides. Purity is critical to avoid contaminating ATPases or proteases. |
| Model Aggregates(e.g., heat-denatured Luciferase, α-Lactalbumin, or chemically modified MDH) | Defined, reproducible substrate to quantify disaggregation activity. Fluorescently labeled variants enable real-time tracking. |
| ATP Regeneration System(Creatine Kinase + Phosphocreatine or Pyruvate Kinase + Phosphoenolpyruvate) | Maintains a constant, physiologically relevant [ATP] by regenerating ATP from ADP, preventing product inhibition. |
| ATP, ADP, AMP-PNP, ATPγS | Nucleotide triphosphates and non-/slowly-hydrolysable analogs for probing hydrolysis dependence and kinetic steps. |
| Coupling Enzyme System(e.g., Pyruvate Kinase/Lactate Dehydrogenase + NADH) | Couples ATP hydrolysis to oxidation of NADH, allowing continuous spectrophotometric monitoring of ATP consumption. |
| Fluorescent Dyes(e.g., SYPRO Orange, Thioflavin T, Bis-ANS) | Report on protein unfolding/aggregation (SYPRO Orange) or amyloid formation (ThT) via fluorescence intensity changes. |
| Protease K | Used in "protease protection" assays to distinguish folded from unfolded/aggregated substrate. |
| Buffers with Defined Cations(e.g., HEPES-KOH, Tris-HCl, with MgCl₂) | Maintain pH and provide essential Mg²⁺ cations, which are cofactors for ATP binding and hydrolysis. |
Quantitative Parameters of Core Components
Optimal performance requires specific concentrations and ratios, derived from seminal and recent studies.
Table 2: Typical Concentration Ranges for Reconstitution Components
| Component | Typical Working Concentration | Notes & Key References |
|---|---|---|
| Hsp70 (DnaK) | 0.5 – 5 µM | Acts as a "holdase" and "foldase"; concentration often exceeds aggregate substrate. |
| Hsp40 (DnaJ) | 0.1 – 1 µM | Stimulates Hsp70 ATPase; sub-stoichiometric to Hsp70 (typical ratio ~1:5 J:K). |
| NEF (GrpE) | 0.05 – 0.2 µM | Promotes ADP release from Hsp70; required for efficient cycling. |
| AAA+ Disaggregase (ClpB/Hsp104) | 0.05 – 0.5 µM | Hexameric motor; low nM KM for ATP; concentration critical for threading activity. |
| Model Aggregate (Luciferase) | 10 – 100 nM | Substrate concentration is kept low relative to chaperones to ensure binding. |
| ATP | 1 – 5 mM | Physiological ATP concentration. Must be regenerated. |
| ATP Regeneration System(e.g., 20 mM Phosphocreatine + 0.1 mg/ml Creatine Kinase) | Maintains [ATP] within ~90% of initial for >1 hour. | Essential for long assays; prevents accumulation of inhibitory ADP. |
| Mg²⁺ | 2 – 10 mM | Must be in excess over [ATP] (e.g., [Mg²⁺] = [ATP] + 1-2 mM). |
Detailed Experimental Protocols
Protocol A: Preparation of Model Heat Aggregates
Objective: Generate reproducible, stable aggregates of a model substrate (Firefly Luciferase).
- Dilution: Dilute purified Luciferase to 2 µM in aggregation buffer (25 mM HEPES-KOH pH 7.6, 50 mM KCl, 5 mM MgCl₂).
- Heat Denaturation: Aliquot 50 µL into thin-walled PCR tubes. Incubate in a thermal cycler or precise heat block at 45°C for 15 minutes. This yields small, defined aggregates.
- Chill & Clarify: Immediately place tubes on ice for 5 min. Centrifuge at 20,000 x g for 10 min at 4°C to pellet large aggregates.
- Quantification: Carefully transfer the supernatant containing the soluble aggregates to a new tube. Determine protein concentration (Bradford assay). Small heat aggregates remain in the supernatant and are the functional substrate. Store on ice and use within 4-6 hours.
Protocol B: ATP-Coupled Disaggregation Assay with Real-Time Monitoring
Objective: Measure ATP consumption concurrent with substrate refolding.
- Prepare Reaction Mix (98 µL): In a UV-transparent cuvette, combine:
- 25 mM HEPES-KOH, pH 7.6
- 50 mM KCl
- 5 mM MgCl₂
- 2 mM ATP
- 20 mM Phosphocreatine
- 0.1 mg/ml Creatine Kinase (ATP regeneration)
- 0.2 mM NADH
- 1 mM Phospho(enol)pyruvate
- 0.05 mg/ml Pyruvate Kinase
- 0.05 mg/ml Lactate Dehydrogenase (PK/LDH coupling system)
- Purified chaperones (e.g., 2 µM DnaK, 0.4 µM DnaJ, 0.1 µM GrpE, 0.2 µM ClpB)
- Baseline Recording: Place cuvette in a thermostatted spectrophotometer at 25°C. Record absorbance at 340 nm (A340) for 2 minutes to establish a stable baseline.
- Initiate Reaction: Add 2 µL of prepared heat-aggregated Luciferase (from Protocol A) to a final concentration of 40 nM. Mix rapidly by pipetting.
- Data Acquisition: Continuously record A340 for 60-120 minutes. The oxidation of NADH to NAD⁺ causes a decrease in A340, directly proportional to the amount of ATP hydrolyzed.
- Analysis: Calculate ATP consumption rate from the slope (∆A340/min), using the extinction coefficient for NADH (ε340 = 6220 M⁻¹cm⁻¹). Correlate with Luciferase reactivation samples taken at time points (see Protocol C).
Protocol C: Functional Disaggregation/Refolding Assay
Objective: Quantify the recovery of native enzymatic activity from aggregates.
- Set Up Disaggregation Reaction (50 µL): In a low-binding microcentrifuge tube, combine buffer, ATP, regeneration system, chaperones, and aggregated substrate as in Protocol B without the PK/LDH coupling system.
- Incubate: Place reaction at 25°C or 30°C.
- Sample: At time points (0, 15, 30, 60, 90 min), remove 5 µL aliquots and dilute into 95 µL of Luciferase assay reagent (contains D-Luciferin and ATP) in a white-walled microplate.
- Measure Activity: Immediately measure luminescence in a plate reader. Compare to a native Luciferase standard curve (0-100 nM) to calculate the nM concentration of refolded, active enzyme.
- Controls: Include essential controls: (i) Aggregates alone (no chaperones), (ii) Chaperones + aggregates + non-hydrolysable ATP analog (AMP-PNP), (iii) Complete system without one critical component (e.g., no NEF or no J-protein).
Visualizing Mechanisms and Workflows
Title: In Vitro Disaggregation Reconstitution Workflow
Title: ATP Hydrolysis Cycle in Hsp70-J Protein Function
Title: ATP-Driven Threading by AAA+ Disaggregase Hexamer
Data Interpretation & Key Considerations
Integrating Data Tables: Correlate ATP consumption rates (from Protocol B, Table 2 parameters) with refolding kinetics (Protocol C). A productive system shows a lag phase of ATP consumption followed by a linear rate that coincides with the appearance of active substrate. Inhibition of refolding by AMP-PNP, without inhibiting initial ATP consumption, localizes the hydrolysis requirement to the translocation step.
Critical Controls: Always run "no-chaperone" and "no-regeneration" controls. The latter demonstrates the rapid stall of disaggregation as [ATP] falls and [ADP] rises, providing direct evidence for the thesis on sustained ATP hydrolysis necessity.
Advanced Modifications: Incorporate single-molecule fluorescence, use optically trapped aggregate beads, or employ deuterium exchange mass spectrometry (HX-MS) on sampled time points to obtain structural insights into the disaggregation process. The core in vitro system described here is the essential foundation for these advanced interrogations of the chaperone motor machinery.
This technical guide details methodologies for real-time kinetic assays used to study ATP hydrolysis coupled to chaperone-mediated protein disaggregation. Within the broader thesis on ATP-dependent chaperone activity, these assays are critical for quantifying the fundamental energy transduction mechanism. Direct, continuous measurement of ATP consumption during disaggregation provides unparalleled insight into reaction stoichiometry, efficiency, and kinetics, informing models of chaperone function in protein homeostasis and its therapeutic targeting.
Core Principle: Coupling ATP Hydrolysis to a Spectroscopically Detectable Signal
ATP hydrolysis (ATP + H₂O → ADP + Pi + H⁺ + energy) can be monitored indirectly by coupling the production of ADP or Pi to a secondary reaction with a measurable optical change.
Primary Coupling Strategies:
- NADH Oxidation (Enzymatic Coupling): A linked enzyme system converts the products of ATP hydrolysis into a change in NADH absorbance (340 nm) or fluorescence (Ex: 340 nm, Em: 460 nm).
- Phosphate-Sensitive Fluorescent Dyes: Direct detection of inorganic phosphate (Pi) release using dyes whose fluorescence intensity increases upon Pi binding (e.g., MDCC-PBP).
- pH-Sensitive Dyes: Detection of the proton (H⁺) released during ATP hydrolysis.
Experimental Protocols
Protocol A: NADH Oxidation Coupled Assay (Standard Pyruvate Kinase/Lactate Dehydrogenase System)
Objective: Continuously monitor ATP hydrolysis by chaperones during disaggregation via the depletion of NADH.
Principle: ATP → ADP + Pi (by chaperase/disaggregase). ADP + Phosphoenolpyruvate (PEP) → ATP + Pyruvate (by Pyruvate Kinase, PK). Pyruvate + NADH + H⁺ → Lactate + NAD⁺ (by Lactate Dehydrogenase, LDH). The rate of NADH decrease (ΔA₃₄₀/Δt) equals the rate of ADP production, hence ATP hydrolysis.
Detailed Methodology:
- Reaction Mix (in cuvette):
- 50 mM HEPES-KOH, pH 7.4
- 150 mM KCl
- 20 mM MgCl₂
- 2 mM DTT
- 2 mM Phosphoenolpyruvate (PEP)
- 2 mM ATP
- 0.4 mM NADH
- Coupling enzymes: 20 U/ml Pyruvate Kinase (PK), 30 U/ml Lactate Dehydrogenase (LDH)
- Substrate: Aggregated model protein (e.g., heat-aggregated luciferase, α-synuclein fibrils) at 5-20 µM monomer equivalent.
Pre-incubation: Incubate reaction mix (minus ATP and chaperone) for 5 min at desired assay temperature (e.g., 30°C, 37°C) in a spectrophotometer or fluorometer with temperature control.
Baseline Recording: Start recording absorbance at 340 nm (or fluorescence) for 60-120 sec.
Reaction Initiation: Add the ATP-dependent chaperone system (e.g., 1 µM DnaK/DnaJ/GrpE, 0.5 µM ClpB from E. coli; or 2 µM Hsp70, 1 µM Hsp110, 0.5 µM Hsp40 in metazoans) to the cuvette. Mix rapidly and continue recording.
Data Acquisition: Record for 30-60 minutes. The slope of the linear decrease in signal is proportional to the steady-state ATPase rate.
Controls:
- No chaperone (baseline ATPase).
- No substrate (chaperone basal ATPase).
- No ATP (background).
Data Calculation: ATPase Rate (µM/s) = (ΔA₃₄₀/Δt) / (εₙₐₕ * path length), where εₙₐₕ = 6220 M⁻¹cm⁻¹ for NADH. The disaggregation-stimulated ATPase rate is obtained by subtracting the basal rate (no substrate) from the total rate.
Protocol B: Direct Phosphate Detection Using MDCC-PBP
Objective: Directly monitor Pi release in real-time with high sensitivity, bypassing enzyme coupling.
Principle: A mutated phosphate-binding protein (PBP) labeled with the fluorophore MDCC exhibits a >7-fold increase in fluorescence intensity (Ex: 430 nm, Em: 465 nm) upon Pi binding.
Detailed Methodology:
- Phosphate Trap Solution: Prepare MDCC-PBP (commercially available) in assay buffer. A typical concentration is 10-50 µM. Pre-incubate with 0.01-0.1 U/ml Purine Nucleoside Phosphorylase (PNP) and 200 µM 7-methylguanosine (MEG) to scavenge any background phosphate.
Reaction Mix:
- Standard chaperone/disaggregation buffer (e.g., 50 mM HEPES, 150 mM KCl, 10 mM MgCl₂).
- 0.5-1 µM MDCC-PBP.
- PNP/MEG scavenging system.
- Substrate aggregates (as in Protocol A).
- ATP-dependent chaperone system.
Initiation: Pre-equilibrate mix (minus ATP) in a fluorometer cuvette. Record baseline fluorescence. Initiate reaction by adding ATP (final 1-5 mM).
Calibration: Perform an internal calibration at the end of each run by adding known amounts of Pi (e.g., 2 nmol, 4 nmol) to convert fluorescence change to Pi concentration.
Advantage: Higher temporal resolution and sensitivity than NADH coupling, ideal for detecting rapid, burst-phase kinetics of Pi release.
Table 1: Comparison of Real-Time ATPase Assay Methods
| Method | Signal Readout | Linear Range (Pi) | Time Resolution | Advantages | Limitations |
|---|---|---|---|---|---|
| NADH Oxidation (PK/LDH) | Absorbance at 340 nm / Fluorescence (Ex340/Em460) | ~2-500 µM | ~10-30 seconds | Robust, well-established, inexpensive reagents. | Signal decrease, lower sensitivity, potential lag from coupling enzymes. |
| MDCC-PBP Fluorescence | Fluorescence Increase (Ex430/Em465) | 0.1-200 µM | <1 second | High sensitivity, direct Pi detection, signal increase. | Requires phosphate scavenging, dye cost, calibration needed. |
| pH-Sensitive Dyes | Fluorescence/ Absorbance change (pH-dependent) | Varies | ~1-5 seconds | Can be very sensitive. | Highly sensitive to buffer conditions, requires low-buffer systems. |
Table 2: Exemplary Kinetic Parameters from Literature (Hsp70/40/110 Disaggregase System)
| Substrate | Chaperone System | Basal ATPase Rate (min⁻¹) | Substrate-Stimulated ATPase Rate (min⁻¹) | Stimulation Factor | Assay Method | Reference* |
|---|---|---|---|---|---|---|
| Heat-aggregated Luciferase | Hsp70 (2 µM), Hsp40 (1 µM), Hsp110 (0.5 µM) | 0.02 - 0.05 | 0.15 - 0.25 | 5-8x | NADH Oxidation | Shorter, 2011 |
| α-Synuclein Fibrils | Human Hsp70 (2 µM), DNAJB1 (1 µM), Apg2 (0.5 µM) | 0.03 - 0.06 | 0.08 - 0.12 | 2-4x | MDCC-PBP | Gao, 2015 |
| Amyloid-β(1-42) Oligomers | Hsc70 (2 µM), DNAJB1 (1 µM), Hsp110 (0.5 µM) | 0.01 - 0.03 | 0.06 - 0.10 | 3-10x | NADH Oxidation | Kundel, 2018 |
*References are representative. Current literature should be consulted via live search.
The Scientist's Toolkit: Key Research Reagent Solutions
Table 3: Essential Materials for Real-Time ATPase/Disaggregation Assays
| Reagent / Material | Function / Role | Example Vendor / Catalog Consideration |
|---|---|---|
| ATP (Adenosine Triphosphate) | Hydrolysis substrate for chaperones. Use high-purity, sodium or magnesium salt. | Sigma-Aldrich, Roche. Prepare fresh stock in pH-adjusted buffer. |
| Phosphoenolpyruvate (PEP) | Phosphoryl donor for PK in NADH-coupled assay. | Roche, Sigma-Aldrich. |
| NAH (β-Nicotinamide Adenine Dinucleotide) | Reducing agent whose oxidation is monitored in coupled assay. | Roche, MilliporeSigma. Light-sensitive. |
| Pyruvate Kinase / Lactate Dehydrogenase (PK/LDH) | Enzymatic coupling system for ADP detection. | Sold as a mix from Roche (PK/LDH enzyme mix) or individually. |
| MDCC-labeled Phosphate Binding Protein (PBP) | Fluorescent sensor for direct Pi detection. | Thermo Fisher Scientific (MESG Phosphate Assay Kit) or in-house expression/purification. |
| 7-Methylguanosine (MEG) & Purine Nucleoside Phosphorylase (PNP) | Phosphate scavenging system for MDCC-PBP assays. | Components often included in commercial kits or available separately (Sigma). |
| Model Aggregated Substrates (e.g., Luciferase, α-Synuclein, Insulin) | Disaggregation targets. Must be prepared reproducibly (e.g., heat aggregation, fibrillation protocols). | Recombinant proteins from various suppliers (Promega, rPeptide, Sigma). |
| Recombinant Chaperones (Hsp70, Hsp40, Hsp110/ClpB) | The ATP-hydrolyzing disaggregation machinery. | Expressed and purified in-house for control, or available from specialized biotech (Enzo, StressMarg). |
| UV-transparent Cuvettes or Microplates | Reaction vessels for spectrophotometry/fluorometry. | BrandTech, Hellma, Corning. Material must be compatible with UV (e.g., quartz, specific plastics). |
| Temperature-Controlled Spectrofluorometer | Instrument for real-time kinetic measurement. | Instruments from Agilent, Horiba, Tecan. |
Visualization of Assay Workflows and Signaling Logic
Diagram 1: NADH oxidation coupled assay workflow.
Diagram 2: Chaperone ATP hydrolysis in cellular disaggregation signaling.
This technical guide details the application of single-molecule biophysical techniques to directly visualize ATP-dependent mechanical pulling. This work is framed within a broader thesis investigating the role of ATP hydrolysis in chaperone-driven protein disaggregation. The disaggregation of toxic protein aggregates is a critical cellular defense against neurodegeneration. While bulk biochemical assays have established the importance of ATP, they obscure the stochastic, stepwise mechanical actions of chaperone complexes. Single-molecule methods, particularly Förster Resonance Energy Transfer (FRET) and Optical Tweezers, are indispensable for dissecting the real-time kinetics, forces, and conformational dynamics by which ATP hydrolysis is transduced into pulling forces that disentangle misfolded polypeptides. Insights from these experiments are pivotal for understanding fundamental proteostasis mechanisms and for informing drug development aimed at modulating chaperone activity in diseases of aging.
Technical Foundations
Single-Molecule FRET (smFRET)
smFRET measures nanoscale distance changes (typically 3-8 nm) between a donor (D) and an acceptor (A) fluorophore attached to a biomolecule. The efficiency of energy transfer (E) is inversely proportional to the sixth power of the distance (R) between the dyes: E = 1 / [1 + (R/R₀)⁶], where R₀ is the Förster distance at which transfer is 50% efficient. In the context of chaperone disaggregation, dyes can be placed on the chaperone motor domain and the substrate polypeptide or on different segments of a translocating chain to monitor conformational transitions and engagement cycles driven by ATP hydrolysis.
Optical Tweezers
Optical tweezers use a highly focused laser beam to trap dielectric microspheres, applying picoNewton-scale forces and measuring nanometer-scale displacements. In a dual-trap configuration, a protein substrate (e.g., an aggregated polypeptide) is tethered between two beads. A chaperone complex, such as Hsp104 or ClpB, can then be introduced. Its ATP-hydrolysis-dependent pulling on the substrate is detected as a change in the tension or extension of the tether, providing direct readouts of force generation, step size, and processivity.
Key Experimental Protocols
Protocol: smFRET to Monitor Chaperone-Substrate Engagement
Objective: To visualize real-time, ATP-dependent conformational dynamics during initial substrate engagement. Key Steps:
- Labeling: Site-specifically label the chaperone's pore-loop region with a donor fluorophore (e.g., Cy3B) and an aggregation-prone peptide substrate with an acceptor fluorophore (e.g., ATTO647N) using cysteine-maleimide chemistry.
- Surface Immobilization: Biotinylate the chaperone and immobilize it on a PEG-passivated, streptavidin-coated quartz microscope slide.
- Data Acquisition: Use a total-internal-reflection fluorescence (TIRF) microscope. Inject the labeled substrate in imaging buffer with an oxygen-scavenging and triplet-state quenching system (e.g., PCA/PCD/Trolox).
- ATP Stimulation: Initiate the reaction by flowing in buffer containing ATP (e.g., 1-5 mM) and an ATP-regenerating system. Record donor and acceptor emission simultaneously at 10-100 ms time resolution.
- Data Analysis: Calculate FRET efficiency (E = I_A/(I_A + I_D)) for single complexes over time. Identify dwell times in high- or low-FRET states and correlate transitions with ATP hydrolysis cycles.
Protocol: Dual-Trap Optical Tweezers to Measure Direct Pulling
Objective: To measure the force and step size generated by a chaperone complex pulling on a polypeptide. Key Steps:
- DNA Handle and Substrate Construction: Engineer a polyprotein substrate (e.g., tandem repeats of a titin domain or a aggregation-prone sequence) flanked by cysteine and lysine residues. Conjugate one end to a digoxigenin-labeled DNA handle and the other to a biotin-labeled DNA handle via click chemistry or NHS ester reactions.
- Bead Tethering: Incubate the construct with anti-digoxigenin-coated and streptavidin-coated polystyrene beads (~1-2 µm diameter) separately. In the dual-trap instrument, capture one bead in each optical trap.
- Force Calibration: Bring the beads into proximity to allow tether formation. Move one trap relative to the other to stretch the tether, confirming a single-molecule tether by its characteristic force-extension curve (e.g., worm-like chain model).
- Chaperone Introduction: Flow in the chaperone complex (e.g., Hsp104 hexamer) in buffer containing ATP (and possibly co-chaperones).
- Pulling Measurement: Hold the tether at a constant force (force-clamp mode) or maintain a fixed trap separation (passive mode). Record the bead positions with nanometer precision. Discrete stepping events, increases in tether length, or force spikes indicate ATP-dependent pulling activity.
Data Presentation: Quantitative Insights
Table 1: Key Single-Molecule Parameters from Recent Chaperone Disaggregation Studies
| Chaperone System | Technique | Measured Step Size | Generated Force | ATP Hydrolysis Rate (per hexamer) | Processivity (Events per engagement) | Reference Key Findings |
|---|---|---|---|---|---|---|
| Hsp104 (S. cerevisiae) | Optical Tweezers | 5-8 nm | 20-50 pN | ~400 min⁻¹ | 15-30 steps | Translocation in 2-5 nm substeps; dwell times depend on ATP concentration. |
| ClpB (E. coli) | smFRET | N/A (Conformational change) | N/A | ~200 min⁻¹ | N/A | ATP binding in NBD1 triggers coiled-coil compaction, priming engagement. |
| Hsp70/DnaJ/DnaK (E. coli) | smFRET | N/A | N/A | ~0.5 min⁻¹ (per DnaK) | Stochastic | DnaJ binding induces high-FRET state in substrate, stabilized by DnaK-ATP. |
| Hsp104 Hexamer | Optical Tweezers + smFRET | 2 nm (substep) | Up to 60 pN | ~500 min⁻¹ | Highly processive | Cooperative ATP hydrolysis drives a power stroke; unfolding precedes translocation. |
Table 2: Essential Research Reagent Solutions (The Scientist's Toolkit)
| Reagent/Material | Function in Experiment | Example Product/Note |
|---|---|---|
| Maleimide-reactive Dyes (Cy3B, ATTO647N) | Site-specific covalent labeling of cysteine residues for smFRET. | Thermo Fisher, Sigma-Aldrich. Use in 2-5x molar excess over protein. |
| PEG-Passivated Slides | Create an inert, non-sticky surface to minimize non-specific binding of biomolecules. | Microsurfaces Inc. home-made using methoxy-PEG-silane and biotin-PEG-silane. |
| Oxygen Scavenging System | Prolongs fluorophore lifetime by reducing photobleaching/blinking. | Protocatechuic acid (PCA)/Protocatechuate-3,4-dioxygenase (PCD) system or glucose oxidase/catalase. |
| Triplet State Quencher | Further reduces fluorophore blinking. | Trolox (a vitamin E analog), cyclooctatetraene (COT). |
| ATP Regeneration System | Maintains constant [ATP] during prolonged experiments. | Phosphocreatine (20 mM) and Creatine Kinase (40 µg/mL). |
| Streptavidin/Anti-Dig Beads | Tethering points for optical tweezer experiments. | Polystyrene or silica beads, ~1-2 µm (Spherotech, Polysciences). |
| Biotin/Digoxigenin-labeled DNA Handles | Provide specific, strong attachment points between the protein substrate and the beads. | PCR-generated or purchased long dsDNA (~500-1000 bp) with modified nucleotides. |
| Non-hydrolyzable ATP Analog (e.g., AMP-PNP, ATPγS) | Used as a control to trap specific conformational states and demonstrate ATP-dependence. | Jena Biosciences. Distinguish binding effects from hydrolysis. |
Visualizing Mechanisms and Workflows
Title: smFRET Experimental Workflow for Chaperone Studies
Title: ATPase Cycle Drives Mechanical Pulling in Chaperones
Title: Dual-Trap Optical Tweezer Setup for Pulling Assays
Within the study of ATP hydrolysis in chaperone disaggregation activity, understanding the precise conformational dynamics of AAA+ ATPase machines (e.g., ClpB, Hsp104, Hsp70/DnaK systems) is paramount. These molecular machines undergo cyclic nucleotide-driven structural rearrangements to translocate and remodel substrates. This whitepaper details the synergistic application of Cryo-Electron Microscopy (cryo-EM) and X-ray crystallography to capture high-resolution snapshots of these transient states. The integration of these structural techniques is foundational to elucidating the mechanochemical coupling that powers protein disaggregation.
| Parameter | X-ray Crystallography | Single-Particle Cryo-EM |
|---|---|---|
| Typical Resolution | 1.5 - 3.0 Å | 2.5 - 4.0 Å (for complexes >150 kDa) |
| Sample State | Crystalline, static | Vitrified solution, multiple states possible |
| Sample Requirement | High-purity, crystallizable (>0.1 mg) | High-purity, monodisperse (>0.02 mg) |
| Information Obtained | Atomic coordinates, chemical detail | 3D density map, conformational heterogeneity |
| Optimal Target Size | Any (requires crystal) | > ~150 kDa for sub-3Å |
| ATPase State Capture | Trapped by analogs (AMP-PNP, ADP•AlFx) | Direct visualization of populations (ATP, ADP, apo) |
| Data Collection Time | Hours-Days (synchrotron) | Days (modern microscopes) |
| Key Limitation | Crystal packing may bias conformation | Lower resolution can obscure side chains |
Experimental Protocols for Conformational State Trapping
Sample Preparation for AAA+ ATPase Structural Studies
- Protein Purification: Recombinant ATPase (e.g., Hsp104) is expressed in E. coli and purified via affinity (Ni-NTA/His-tag), ion-exchange, and size-exclusion chromatography (Superdex 200) in a low-salt buffer (e.g., 20 mM HEPES pH 7.5, 150 mM KCl, 5 mM MgCl2).
- Nucleotide Trapping:
- ATP-bound state: Incubate with 5 mM AMP-PNP (non-hydrolyzable analog) and 5 mM MgCl2 for 30 min on ice.
- ADP-Pi transition state: Incubate with 5 mM ADP, 5 mM AlCl3, and 10 mM NaF to form ADP•AlFx for 30 min.
- ADP-bound state: Incubate with 5 mM ADP and 5 mM MgCl2.
- Apo state: Include 5 mM EDTA to chelate Mg2+ and remove nucleotide.
X-ray Crystallography Workflow for ATPase Domains
- Crystallization: Use the hanging-drop vapor-diffusion method. Mix 1 μL of 10 mg/mL protein-nucleotide complex with 1 μL of reservoir solution (e.g., 18-22% PEG 3350, 0.1-0.2 M ammonium citrate pH 7.0). Crystals appear at 20°C in 3-7 days.
- Cryo-protection and Soaking: Transfer crystal to reservoir solution supplemented with 25% ethylene glycol. For nucleotide soaking, crystals may be transferred to cryo-solution containing 10 mM of the desired nucleotide/analog for 1-2 hours.
- Data Collection & Processing: Flash-cool in liquid N2. Collect a 180° dataset at a synchrotron (100K, λ ~1.0 Å). Process using XDS or HKL-3000. Solve structure by molecular replacement (MR) using a known ATPase domain (PDB ID) in PHASER. Refine with phenix.refine and Coot.
Single-Particle Cryo-EM Workflow for Full-Length ATPase Complexes
- Grid Preparation: Apply 3 μL of 0.5-1.0 mg/mL sample to a glow-discharged Quantifoil R1.2/1.3 300-mesh Au grid. Blot for 3-5 seconds (100% humidity, 4°C) and plunge-freeze in liquid ethane using a Vitrobot Mark IV.
- Data Acquisition: Collect movies on a 300 keV Titan Krios with a Gatan K3 detector. Use SerialEM for automated collection: 81 frames, total dose 50 e-/Å2, defocus range -1.0 to -2.5 μm, pixel size 0.83 Å.
- Data Processing: Motion correct with MotionCor2, estimate CTF with CTFFIND-4. Pick particles with cryoSPARC blob picker. Perform 2D classification to remove junk. Generate an ab initio model, followed by heterogeneous refinement to separate conformational states. Carry out non-uniform refinement and local resolution estimation. For distinct states (e.g., ATP, ADP-bound), apply 3D variability analysis or focused classification.
Diagram Title: Structural Biology Workflow for ATPase States
The Scientist's Toolkit: Essential Research Reagents & Materials
| Item | Function in ATPase Structural Studies |
|---|---|
| AMP-PNP (Adenylyl-imidodiphosphate) | Non-hydrolyzable ATP analog for trapping the ATP-bound "power stroke" state. |
| ADP•AlFx (Aluminum Fluoride) | Mimics the pentavalent transition state of ATP hydrolysis (ADP-Pi), trapping the catalytic intermediate. |
| Holey Carbon Grids (Quantifoil, C-flat) | Support film for vitrified cryo-EM samples; holey pattern provides clean ice. |
| SEC Column (Superdex 200 Increase) | Critical size-exclusion chromatography step to obtain monodisperse, oligomerized ATPase complexes. |
| Cryo-Protectant (e.g., Ethylene Glycol) | Prevents ice crystal formation in protein crystals during flash-cooling for X-ray data collection. |
| Negative Stain (Uranyl Acetate) | Rapid screening of sample quality and homogeneity by conventional TEM before cryo-EM. |
| Detergent (e.g., GDN, DDM) | Maintains stability of membrane-associated AAA+ ATPases (e.g., Vps4, p97) during purification. |
| TEV Protease | Cleaves affinity tags (His-tag, GST) to obtain native protein after purification, crucial for crystallization. |
Diagram Title: ATPase Cycle Trapping for Structural Studies
Application to Chaperone Disaggregation Research
The combined structural data from these techniques directly informs the disaggregation thesis. For example, cryo-EM structures of Hsp104 in different nucleotide states reveal how the axial pores of its hexameric ring constrict and expand, while high-resolution crystal structures of individual domains pinpoint key residues involved in ATP binding and hydrolysis. Correlating these snapshots with biochemical assays (e.g., FRET-based translocation, disaggregation kinetics) allows researchers to build a sequential movie of the disaggregation mechanism, from substrate engagement to thread-through and release.
Cryo-EM and X-ray crystallography are complementary cornerstones for visualizing the conformational ensemble of disaggregation ATPases. By providing spatially and temporally resolved snapshots, they transform the abstract ATP hydrolysis cycle into a tangible mechanical model. This structural framework is indispensable for rational drug design targeting AAA+ chaperones, with applications in neurodegenerative diseases associated with protein aggregation.
This technical guide details the development and application of genetically-encoded reporter systems for monitoring protein disaggregation in living cells, framed within the broader thesis of understanding ATP hydrolysis-driven chaperone activity. These systems enable real-time, quantitative analysis of proteostasis in models of neurodegeneration and aging, directly linking chaperone ATPase cycles to functional recovery of aggregated substrates.
The fundamental thesis posits that the energy from ATP hydrolysis is transduced by chaperone systems (e.g., Hsp70, Hsp104, ClpB) into mechanical work for disentangling and refolding aggregated proteins. In-cell reporter systems are designed to make this biochemical activity visible, quantifying the spatiotemporal dynamics of disaggregation as a direct readout of chaperone ATPase function.
Core Reporter System Architectures
Fluorescent Protein Complementation Reporters
These systems rely on the aggregation-induced separation and subsequent chaperone-mediated reassembly of fluorescent protein fragments.
- Split-GFP Systems: An aggregating protein-of-interest is fused to one fragment (e.g., GFP11), while its complementary fragment (GFP1-10) is expressed diffusely. Aggregation sequesters GFP11, preventing fluorescence. Disaggregation and refolding allow complementation and fluorescent signal generation.
- Luciferase Fragment Complementation: Similar principle using fragments of NanoLuc or Firefly luciferase, where luminescence upon complementation signals disaggregation.
Fluorescent Protein Relocalization Reporters
These reporters monitor the physical redistribution of a fluorescently-tagged substrate from aggregates to a soluble state.
- Hsp104-GFP Sensor: The yeast disaggregase Hsp104 is fused to GFP. It localizes to and accumulates on protein aggregates. A decrease in punctate fluorescence, quantified by high-content imaging, indicates aggregate dissolution.
- Aggregate-Specific Dye Probes: Although not genetically encoded, dyes like Proteostat or Thioflavin T are used in conjunction with live-cell imaging to monitor bulk aggregate load.
Degradation-Coupled Reporters
These link disaggregation to subsequent proteasomal degradation, using unstable fluorescent proteins.
- Ubiquitin-Proteasome System (UPS) Reporters: A disaggregation-prone protein (e.g., huntingtin-Q74) is fused to a rapidly degrading fluorescent protein (e.g., d2GFP). Upon disaggregation and liberation, the fusion is ubiquitinated and degraded, leading to a decrease in fluorescence.
Table 1: Comparison of Core Reporter System Characteristics
| Reporter Type | Example Construct | Readout | Temporal Resolution | Key Advantage | Key Limitation |
|---|---|---|---|---|---|
| Complementation | PolyQ-GFP11 + GFP1-10 | Fluorescence Increase | Minutes-Hours | High signal-to-noise; direct refolding readout | Background from spontaneous complementation |
| Relocalization | Hsp104-GFP | Puncta Count/Intensity Decrease | Hours | Visualizes chaperone engagement | Indirect; measures chaperone binding, not substrate fate |
| Degradation-Coupled | Htt-Q74-d2GFP | Fluorescence Decrease | Hours | Integrates disaggregation & downstream processing | Confounded by proteasomal impairment |
Detailed Experimental Protocol: Split-GFP Disaggregation Assay
This protocol quantifies Hsp70/Hsp40/Hsp110-mediated disaggregation of polyQ aggregates in HeLa cells.
Materials & Reagent Setup
- Plasmids: pGFP1-10 (constitutively expressed), pGFP11-polyQ (Q62) (inducible or constitutive).
- Cell Line: HeLa or HEK293T.
- Transfection Reagent: Polyethylenimine (PEI) or Lipofectamine 3000.
- Imaging Medium: Leibovitz's L-15 medium without phenol red.
- Controls: GFP-full length (positive), GFP11-polyQ alone (negative), ATPase-deficient chaperone mutants (e.g., Hsp70 K71M).
Procedure
Day 1: Seed cells in a 96-well glass-bottom imaging plate at 20,000 cells/well. Day 2: Co-transfect with pGFP1-10 and pGFP11-polyQ62 at a 1:2 ratio. Include controls. Day 3 (24h post-transfection): Induce aggregation if using an inducible system. For constitutive expression, aggregates will have formed. Day 4 (Imaging):
- Replace medium with pre-warmed L-15 imaging medium.
- Acquire baseline images (T0) using a widefield or confocal microscope with a 40x objective (GFP channel: Ex 488nm / Em 510nm). Use automated stage to image ≥5 fields/well.
- Optional: Add small molecule modulator of chaperone ATPase activity (e.g., 115-7c for Hsp70) or DMSO vehicle.
- Place plate in a live-cell incubation chamber (37°C, 5% CO2).
- Acquire images at 30-minute intervals for 6-12 hours.
Data Analysis
- Segmentation: Use ImageJ/Fiji or CellProfiler to identify cells (DAPI/Hoechst channel) and GFP-positive aggregates (thresholding).
- Quantification: For each cell, measure total GFP fluorescence intensity (integrated density) over time.
- Normalization: Normalize intensity in each cell to its T0 value.
- Kinetic Modeling: Fit normalized data to an exponential recovery model:
F(t) = F_max - (F_max - F_0)*e^(-k*t), wherekis the apparent disaggregation rate constant.
Table 2: Key Research Reagent Solutions
| Reagent/Category | Example Product/Identifier | Function in Disaggregation Assay |
|---|---|---|
| Split-GFP System | GFP1-10 / GFP11 plasmids (Addgene #70219, #70220) | Core components for aggregation-dependent fluorescence complementation. |
| Aggregating Substrate | pGFP11-Htt-Q62 (or other polyQ length) | Provides the aggregation-prone substrate linked to the reporter fragment. |
| Chaperone Expression Vectors | pCMV-Hsp70, pCMV-Hsp40 (DNAJB1), pCMV-Hsp110 (HSPH2) | Enable overexpression of specific disaggregation machinery components. |
| ATPase-Deficient Mutant | pCMV-Hsp70-K71M (Addgene #14699) | Critical negative control to link fluorescence recovery to ATP hydrolysis. |
| Live-Cell Dye | SiR-Actin (Cytoskeleton) or HaloTag-based ligands | Allows simultaneous visualization of cell morphology without spectral interference. |
| Proteasome Inhibitor (Control) | MG-132 (10 µM) | Used in degradation-coupled assays to block downstream processing, isolating disaggregation signal. |
Diagram Title: Split-GFP Disaggregation Reporter Workflow
Diagram Title: ATP Hydrolysis Cycle in Chaperone Disaggregation
Data Interpretation & Integration with ATPase Kinetics
The disaggregation rate constant (k) derived from reporter assays can be directly correlated with biochemical ATPase measurements.
Table 3: Correlating Reporter Data with Biochemical Parameters
| In-Cell Reporter Readout | Corresponding Biochemical Assay | Expected Correlation | Insight into Thesis |
|---|---|---|---|
| Disaggregation Rate Constant (k) | ATP turnover rate (k_cat) of chaperone complex | Positive correlation under saturating substrate | Links speed of aggregate clearance to speed of ATP hydrolysis. |
| Maximum Fluorescence Recovery (F_max) | Fraction of refolded substrate in vitro | Positive correlation | Indicates coupling efficiency between hydrolysis and productive refolding. |
| Lag Time before Signal Change | Time to form functional chaperone-substrate complex | Negative correlation with complex stability | Reflects initial steps (recruitment, priming) before energy-consuming work. |
| Effect of ATPase Mutant (K71M) | Abolished ATP hydrolysis in vitro | Reporter signal abolished | Direct causal evidence that reporter output requires ATP hydrolysis. |
Advanced Applications & Future Directions
- FRET-Based Stress Sensors: Reporters sensitive to conformational changes during disaggregation.
- Single-Cell Analysis: Using microfluidics to track heterogeneity in disaggregation capacity linked to ATP levels.
- Drug Screening: High-content screening platforms using these reporters to identify compounds that modulate chaperone ATPase activity for neurodegenerative diseases.
Genetically-encoded disaggregation reporters provide an indispensable bridge between in vitro ATPase kinetics and functional proteostasis in living systems. By quantitatively linking fluorescence output to the chaperone ATP hydrolysis cycle, they rigorously test the core thesis that disaggregation is a direct, measurable consequence of ATP-fueled molecular remodeling.
High-Throughput Screening (HTS) Platforms for Identifying Modulators of Chaperone ATPase Activity
This guide details HTS platforms for identifying modulators of chaperone ATPase activity, a critical research focus within the broader thesis on the role of ATP hydrolysis in driving chaperone-mediated protein disaggregation. The ATPase cycle of chaperones like Hsp70, Hsp90, and ClpB is fundamental to their disaggregation function. Small-molecule modulators (inhibitors or activators) of this activity are essential tools for mechanistic dissection and potential therapeutic development. HTS enables the rapid evaluation of vast chemical libraries to discover such probes.
Core HTS Assay Principles and Quantitative Data
The choice of assay is dictated by sensitivity, robustness, cost, and compatibility with automation. Below is a comparison of the primary assay formats.
Table 1: Core HTS Assay Platforms for Chaperone ATPase Activity
| Assay Platform | Principle | Throughput (Well/Day) | Z'-Factor* | Approx. Cost per 384-well plate | Key Advantages | Key Limitations |
|---|---|---|---|---|---|---|
| Coupled Enzyme (NADH/NADPH) | ATP hydrolysis linked to oxidation of NADH, measured by absorbance (340 nm). | 20,000 - 50,000 | 0.6 - 0.8 | $50 - $150 | Homogeneous, continuous, widely validated. | Interference from colored compounds, secondary enzyme coupling can be complex. |
| Malachite Green Phosphate | Inorganic phosphate (Pi) detection via malachite green-molybdate complex (A650). | 10,000 - 30,000 | 0.5 - 0.7 | $30 - $100 | Direct Pi measurement, endpoint, no secondary enzymes. | Acid-sensitive compounds interfere, sensitive to free phosphate contamination. |
| Luminescent ATP Detection | Luciferase-based detection of remaining ATP after reaction (e.g., ATP Lite, CellTiter-Glo). | 50,000 - 100,000+ | 0.7 - 0.9 | $200 - $500 | Ultra-high sensitivity, wide dynamic range, simple "add-and-read". | Detects ATP remaining (inverse signal), cost per data point can be high. |
| Fluorescent Phosphate (PBP/MdGreen) | Phosphate binding protein (PBP) coupled to a fluorophore; Pi binding increases fluorescence. | 30,000 - 70,000 | 0.7 - 0.9 | $100 - $300 | Highly sensitive, real-time kinetic measurement, minimal interference. | Requires purified PBP reagent, protein-based dyes can be unstable. |
*Z'-Factor >0.5 is generally acceptable for HTS; >0.7 is excellent.
Detailed Experimental Protocols
Protocol A: Coupled Enzyme Assay for Hsp70 ATPase (384-well format)
- Objective: To measure ATPase activity via the depletion of NADH.
- Key Reagents: Hsp70 protein, ATP, NADH, phosphoenolpyruvate (PEP), pyruvate kinase (PK), lactate dehydrogenase (LDH).
- Procedure:
- Assay Buffer: Prepare 50 mM HEPES-KOH (pH 7.4), 50 mM KCl, 10 mM MgCl₂, 1 mM DTT. Add 0.01% Tween-20 for compound screening.
- Master Mix: In assay buffer, combine 0.2 mM NADH, 1 mM PEP, 20 U/ml PK, 20 U/ml LDH. Keep on ice.
- Plate Setup: Dispense 20 µL of test compound or DMSO control into a clear-bottom 384-well plate. Add 20 µL of Hsp70 (final conc. 0.5-2 µM). Pre-incubate for 15 min at 25°C.
- Reaction Initiation: Add 20 µL of Master Mix containing ATP (final conc. 1 mM). Final assay volume is 60 µL.
- Kinetic Measurement: Immediately read absorbance at 340 nm every minute for 60-90 minutes using a plate reader (e.g., BMG Labtech CLARIOstar).
- Data Analysis: Calculate the slope of NADH depletion (ΔA340/min). Activity is proportional to the negative slope. Normalize to DMSO-only (100% activity) and no-enzyme (0% activity) controls.
Protocol B: Endpoint Malachite Green Assay for Hsp90 ATPase (1536-well format)
- Objective: To measure accumulated inorganic phosphate post-reaction.
- Key Reagents: Hsp90 protein, ATP, malachite green reagent (commercial kit or prepared).
- Procedure:
- Assay Buffer: 40 mM HEPES (pH 7.4), 100 mM KCl, 5 mM MgCl₂.
- Reaction Setup: Using an acoustic dispenser (e.g., Labcyte Echo), transfer 25 nL of compound/DMSO into a 1536-well plate. Add 2 µL of Hsp90 (final 50 nM). Pre-incubate 10 min.
- Reaction Initiation: Add 2 µL of ATP (final 500 µM) in buffer. Incubate for 60 min at 30°C.
- Reaction Stop & Detection: Add 5 µL of malachite green reagent (e.g., PiColorLock Gold). Incubate for 15-20 min at room temperature for color development.
- Measurement: Read absorbance at 620-650 nm.
- Data Analysis: Convert A650 to [Pi] using a phosphate standard curve (0-100 µM). Calculate ATPase rate. Normalize to controls.
Visualizing Workflows and Pathways
HTS Workflow for ATPase Modulator Discovery
Title: HTS Workflow for ATPase Modulator Discovery
ATP Hydrolysis Cycle in Hsp70 Disaggregation
Title: ATP Hydrolysis Cycle in Hsp70 Disaggregation Function
The Scientist's Toolkit: Research Reagent Solutions
Table 2: Essential Reagents for Chaperone ATPase HTS
| Reagent / Material | Function in Assay | Example Product / Vendor |
|---|---|---|
| Recombinant Chaperone Protein | The enzymatic target. Must be highly pure and ATPase-active. | Human Hsp70 (BPS Bioscience), Yeast Hsp104 (purified in-house). |
| Coupled Enzyme Assay Kit | Provides optimized PK/LDH enzymes and reagents for NADH-linked assays. | ATPase Assay Kit (Colorimetric) - Sigma-Aldrich MAK113. |
| Malachite Green Phosphate Kit | Provides stable, sensitive formulation for Pi detection. | PiColorLock Gold Assay Kit - Thermo Fisher Scientific A37862. |
| Luminescent ATP Detection Kit | For "ATP depletion" assays; highly sensitive. | ADP-Glo Kinase Assay - Promega V6930. |
| Fluorescent Phosphate Sensor | Recombinant protein for real-time, fluorescent Pi detection. | MDCC-labeled Phosphate Binding Protein (PBP) - Thermo Fisher Scientific P22061. |
| Low-Volume Assay Plates | For miniaturized HTS (1536-well or 384-well). | Corning 1536-well Low Volume Polystyrene Plate. |
| Liquid Handling System | For automated, precise reagent dispensing. | Echo 655T Acoustic Liquid Handler (Labcyte). |
| Multi-Mode Plate Reader | For absorbance, fluorescence, and luminescence detection. | CLARIOstar Plus (BMG Labtech) or EnVision (PerkinElmer). |
| Positive Control Inhibitor | For assay validation and QC (Z'-factor calculation). | VER-155008 (Hsp70 inhibitor, MedChemExpress), Radicicol (Hsp90 inhibitor). |
| DMSO-Tolerant Buffer Systems | To maintain protein stability and activity in compound screening. | HEPES or TRIS buffers with stabilizers (BSA, CHAPS). |
Overcoming Experimental Hurdles in ATPase and Disaggregation Assays
In the study of chaperone-mediated protein disaggregation, ATP hydrolysis serves as the fundamental energy currency driving the mechanical unfolding and refolding of misfolded protein aggregates. Maintaining a consistent ATP supply (homeostasis) and preventing the irreversible inactivation of chaperone ATPases (exhaustion) are critical, yet often overlooked, experimental challenges. This whitepaper outlines common pitfalls and provides technical guidance for research within this context.
Core Pitfalls & Quantitative Data
Failure to manage ATP levels and monitor enzyme activity leads to artifactual data, including misinterpreted kinetics and false-negative disaggregation results.
Table 1: Common Pitfalls and Their Experimental Consequences
| Pitfall | Direct Consequence | Impact on Disaggregation Assay |
|---|---|---|
| Unbuffered ATP Depletion | Non-linear reaction kinetics; chaperone stalling on substrate. | Apparent loss of chaperone efficacy; truncated aggregate clearance. |
| ADP/Inorganic Phosphate Accumulation | Product inhibition of chaperone ATPase; altered chaperone conformation. | Reduced disaggregation rate and yield; potential formation of "frozen" chaperone-substrate complexes. |
| Chaperone ATPase Exhaustion | Irreversible oxidation or thermal inactivation of ATPase domains. | Complete loss of function over extended assays; poor reproducibility between experiments. |
| Inadequate Regeneration System | Failure to maintain [ATP] within Km range for the chaperone. | Sub-optimal and variable disaggregation activity; misleading IC50 values in inhibitor screens. |
Table 2: Key Parameters for ATP Homeostasis in Model Disaggregation Systems
| System Component | Typical Concentration Range | Critical Parameter(s) | Recommended Monitoring Method |
|---|---|---|---|
| ATP Regeneration System (e.g., CP/CK) | Phosphocreatine (20-40 mM); Creatine Kinase (20-40 U/mL) | Regeneration rate must exceed chaperone ATPase rate. | Coupled NADH oxidation assay or HPLC. |
| ATPase Chaperone (e.g., Hsp104, Hsp70/DnaJ/GrpE) | 0.5 - 5 µM (oligomeric chaperone) | Specific Activity (min⁻¹); Km for ATP (µM). | Malachite Green Phosphate Assay; Enzymatic Coupling Assay. |
| Substrate (Aggregated Protein) | 0.1 - 5 µM (monomer equivalent) | Substrate:Chaperone molar ratio. | Thioflavin T (ThT) or ANS fluorescence. |
| Free Mg²⁺ | 1-5 mM in excess of [ATP] | Mg:ATP ratio critical for hydrolysis. | Atomic absorption spectroscopy or fluorometric probes. |
Detailed Experimental Protocols
Protocol: Real-Time ATP Homeostasis Monitoring in Disaggregation
Objective: To maintain and verify constant [ATP] during a chaperone disaggregation reaction.
Reagents:
- Disaggregation buffer (e.g., 50 mM HEPES-KOH pH 7.4, 150 mM KCl, 20 mM MgCl₂).
- ATP Regeneration Mix: 5 mM ATP, 40 mM Phosphocreatine (di-Tris salt), 40 U/mL Creatine Kinase (from rabbit muscle).
- Chaperone system (e.g., 2 µM Hsp104 hexamer, 4 µM DnaK, 1 µM DnaJ, 0.5 µM GrpE).
- Model aggregate (e.g., 1 µM pre-formed α-synuclein fibrils, labeled with Thioflavin T).
- Coupled ATP Detection Mix: 0.2 mM NADH, 2 mM Phospho(enol)pyruvate, 50 U/mL Pyruvate Kinase, 50 U/mL Lactate Dehydrogenase.
Method:
- Prepare the master reaction mix containing buffer, ATP Regeneration Mix, and Coupled ATP Detection Mix.
- In a thermostatted fluorometer cuvette (37°C), add master mix, chaperones, and aggregates. Initiate reaction.
- Monitor ThT fluorescence (λex = 440 nm, λem = 485 nm) for disaggregation.
- Simultaneously, monitor NADH absorbance (λ = 340 nm). The linear decrease in A340 reports the net ATP consumption rate. A constant slope indicates stable [ATP]. A non-linear, decelerating trace indicates system failure.
- Calculate ATP turnover from the NADH slope (ε₃₄₀ = 6220 M⁻¹cm⁻¹). Correlate directly with ThT signal decay.
Protocol: Assessing Chaperone ATPase Exhaustion
Objective: To determine if a loss of activity is due to reversible product inhibition or irreversible enzyme exhaustion.
Reagents: As in 3.1, plus fresh ATP.
Method:
- Run a standard disaggregation assay for an extended period (e.g., 4-6 hours) until the ThT signal plateaus.
- Split the reaction into two aliquots.
- Aliquot A (Control): Add fresh buffer equal to 10% of reaction volume.
- Aliquot B (Rescue): Add fresh ATP Regeneration Mix and fresh chaperone system (each equal to 10% of reaction volume).
- Continue monitoring ThT fluorescence.
- Interpretation:
- If only Aliquot B resumes disaggregation, the original halt was due to chaperone exhaustion.
- If both aliquots show resumed activity, the halt was due to ATP/product depletion, and the fresh chaperones in B were not the limiting factor.
- A complementary ATPase activity gel (native PAGE with [γ-³²P]ATP) of samples pre- and post-assay can visualize inactive chaperone oligomers.
Visualizing Pathways and Workflows
Diagram 1 Title: ATP Homeostasis vs. Exhaustion in Disaggregation
Diagram 2 Title: Workflow for Monitoring ATP Homeostasis
The Scientist's Toolkit: Research Reagent Solutions
Table 3: Essential Reagents for Robust Disaggregation Assays
| Reagent / Material | Function & Rationale | Example Product / Cat. No. (for reference) |
|---|---|---|
| High-Purity ATP (Di/Tri-salts) | Minimizes contaminant divalent cations (e.g., Ca²⁺) that alter ATPase kinetics. | Sigma-Aldrich A2383 (ATP, disodium salt, >99% HPLC). |
| Creatine Kinase (CK) & Phosphocreatine (CP) | Gold-standard ATP-regenerating system. CK from rabbit muscle is highly stable. | Roche 10736966001 (CK); Sigma-Aldrich P7936 (CP, di-Tris salt). |
| Pyruvate Kinase / Lactate Dehydrogenase (PK/LDH) Coupling Enzymes | For continuous, sensitive spectrophotometric detection of ATP turnover via NADH oxidation. | Sigma-Aldrich P0294 (PK/LDH mixture). |
| Malachite Green Phosphate Assay Kit | End-point colorimetric quantification of inorganic phosphate (Pi) release. | ScienCell MAK307. |
| Thioflavin T (ThT) | Fluorescent dye that specifically binds amyloid-like aggregates; standard for monitoring disaggregation. | Sigma-Aldrich T3516. |
| Protease Inhibitor Cocktail (without EDTA) | Protects chaperones from proteolytic degradation during long assays without chelating essential Mg²⁺. | Thermo Fisher 78425. |
| Thermostable Luciferase-based ATP Assay | Ultra-sensitive, real-time luminescent monitoring of absolute [ATP] in microplate format. | Promega FF2000. |
| Size-Exclusion Spin Columns (Desalting) | Rapid buffer exchange to remove accumulated ADP/Pi from chaperone preps pre-assay. | Cytiva 28918008 (MicroSpin G-25). |
Within the broader thesis on ATP hydrolysis in chaperone disaggregation activity research, the precise optimization of cofactor conditions is a critical determinant of experimental success and biological relevance. This technical guide details the current understanding of how magnesium (Mg2+), potassium (K+), and nucleotide (ATP/ADP) concentrations synergistically regulate the kinetics and efficiency of chaperone-driven protein disaggregation. Accurate recapitulation of in vivo conditions in vitro is essential for mechanistic studies and for screening potential therapeutic modulators.
Chaperone systems such as Hsp70, Hsp100 (e.g., ClpB in bacteria, Hsp104 in yeast), and their collaborative networks rely on ATP binding and hydrolysis to fuel conformational changes necessary for substrate remodeling and disaggregation. Mg2+ is an obligate cofactor for ATP hydrolysis, stabilizing the transition state. K+ acts as an allosteric regulator, often stimulating ATPase activity. The concentrations of ATP and its hydrolysis product, ADP, govern the chaperone’s nucleotide-bound state, dictoring its affinity for client proteins and co-chaperones. Imbalanced conditions can lead to artefactual data, including suppressed activity or non-physiological aggregation.
The following tables synthesize current data from key model systems (E. coli DnaK-ClpB, yeast Hsp70-Hsp104, human Hsp70-Hsp110).
Table 1: Optimized Cofactor Concentration Ranges for In Vitro Disaggregation Assays
| Chaperone System | [Mg2+] (mM) | [K+] (mM) | [ATP] (mM) | [ADP] (mM, if added) | Typical Buffer System | Reference Key Insights |
|---|---|---|---|---|---|---|
| E. coli DnaK-ClpB | 2-5 | 50-100 | 1-5 | 0.1-1 (for kinetics) | HEPES-KOH, pH 7.5 | [K+] > 50 mM maximally stimulates ClpB ATPase. Mg2+ in excess of ATP required. |
| Yeast Hsp70 (Ssa1)-Hsp104 | 2-10 | 50-150 | 2-10 | N/A | MOPS-KOH, pH 7.2 | High [K+] mimics cytosolic ionic strength; optimizes Hsp104 hexamer stability. |
| Human Hsp70-Hsp110 | 1-5 | 40-120 | 1-3 | Variable | HEPES-KOH, pH 7.4 | Nucleotide exchange factor activity (Hsp110) is sensitive to Mg2+/ADP ratio. |
Table 2: Effects of Cofactor Deviation on Disaggregation Metrics
| Parameter Altered | Effect on ATPase Rate | Effect on Disaggregation Yield | Potential Artefact |
|---|---|---|---|
| Low [Mg2+] (<0.5 x [ATP]) | Severely inhibited | Abolished | Substrate trapping in high-affinity state. |
| Very High [Mg2+] (>20 mM) | Often inhibited | Reduced | Non-specific cation effects, protein aggregation. |
| Low [K+] (<20 mM) | Reduced (allosteric) | Slowed kinetics | Loss of chaperone complex cooperativity. |
| High [K+] (>200 mM) | May be inhibited | Variable | Possible complex destabilization. |
| High [ADP]/[ATP] ratio | Net hydrolysis decreased | Inhibition, substrate release blocked | Mimics energy-depleted cellular state. |
Experimental Protocols for Optimization
Titration of Mg2+ and ATP for Maximal Hydrolysis Rate
Objective: Determine the Mg2+:ATP ratio that yields maximum steady-state ATPase activity for the chaperone system. Reagents: Purified chaperone, ATP stock (pH 7.0 with KOH), MgCl2 stock, ATP-regeneration system (Pyruvate Kinase/Phosphoenolpyruvate), detection system (NADH-coupled enzyme assay or malachite green for phosphate). Procedure:
- Prepare a master reaction buffer (e.g., 50 mM HEPES-KOH pH 7.5, 100 mM KCl, 2 mM DTT).
- In a 96-well plate, vary [MgCl2] from 0 to 10 mM while keeping [ATP] constant at 2 mM.
- In a parallel experiment, vary [ATP] from 0.1 to 10 mM while keeping [MgCl2] in a fixed molar excess (e.g., [Mg2+] = [ATP] + 1 mM).
- Initiate reactions by adding chaperone. Monitor ATP hydrolysis continuously (NADH absorbance at 340 nm) or take time-points for phosphate detection.
- Plot hydrolysis rate (µM Pi/min) vs. cofactor concentration. The optimal [Mg2+] is typically 1-2 mM in excess of total [ATP] to account for nucleotide chelation.
Potassium Activation Curve for Disaggregation Efficiency
Objective: Establish the [K+] that yields maximal disaggregation of a model substrate (e.g., heat-aggregated luciferase). Reagents: Chaperone system, aggregated substrate, ATP/Mg2+ at optimized ratio, KCl stock, luciferase activity assay reagents. Procedure:
- Generate aggregated firefly luciferase by incubating at 45°C for 15 min in HEPES buffer.
- Set up disaggregation reactions with fixed chaperone and ATP/Mg2+ concentrations. Vary [KCl] from 0 to 200 mM (maintain ionic strength with compensating NaCl if necessary).
- Incubate at 30-37°C for 60-90 minutes.
- Remove aliquots, dilute, and measure recovered luciferase activity by adding luciferin and quantifying luminescence.
- Plot % luciferase activity recovered vs. [K+]. The plateau indicates the optimal range for functional cooperation.
Diagrams
Diagram 1: Cofactor Roles in Chaperone Disaggregation
Diagram 2: Experimental Optimization Workflow
The Scientist's Toolkit: Research Reagent Solutions
Table 3: Essential Reagents for Cofactor Optimization Studies
| Reagent/Material | Function & Importance | Example Product/Catalog |
|---|---|---|
| Ultra-Pure ATP, >99% (Na+ or K+ salt) | Minimizes contaminating ADP and other nucleotides that alter kinetics. | Sigma-Aldrich A2383 (ATP, Na salt), Roche 10127523001 (ATP, K salt). |
| Molecular Biology Grade MgCl₂ & KCl | High-purity salts free of heavy metal contaminants that inhibit enzymes. | Thermo Fisher Scientific AM9530G (MgCl₂), AM9640G (KCl). |
| ATP-Regeneration System (Pyruvate Kinase/Phosphoenolpyruvate) | Maintains constant [ATP] during long assays, crucial for steady-state kinetics. | Sigma-Aldrich P0294 (PK) & P0560 (PEP). |
| Coupled Enzyme ATPase Assay Kit (NADH-based) | Allows real-time, continuous monitoring of ATP hydrolysis rate. | Cytoskeleton #60102 (ATPase Colorimetric Assay). |
| Model Aggregated Substrate (e.g., Firefly Luciferase) | Standardized, quantifiable substrate for disaggregation efficiency assays. | Promega E1501 (Luciferase). |
| Low-Binding Microplates & Tubes | Prevents loss of chaperone/substrate to plastic surfaces, critical for reproducibility. | Eppendorf LoBind tubes, Corning #4515 (Non-binding surface plates). |
| Precision Cation Chelators (EDTA, EGTA) | For precisely controlling free vs. bound Mg2+ concentrations in buffers. | Sigma-Aldrich E9884 (EDTA), E4378 (EGTA). |
Within the broader thesis on the role of ATP hydrolysis in chaperone disaggregation activity, a critical and often confounding experimental factor is the non-specific binding of chaperones to non-target, "sticky" substrates. This whitepaper provides an in-depth technical guide on the mechanisms and origins of this stickiness, its impact on data interpretation, and robust experimental strategies to mitigate it, thereby ensuring the accurate assessment of ATP-driven disaggregation functions.
Chaperone systems, particularly ATP-dependent ones like Hsp70, Hsp104, and ClpB, are studied for their ability to rescue aggregated proteins. A core tenet of the thesis is that controlled, hydrolysis-driven conformational changes are essential for substrate threading and disaggregation. However, many aggregation-prone substrates and model aggregates (e.g., chemically denatured proteins, amyloid fibrils) exhibit hydrophobic patches or charged regions that promote adventitious chaperone binding independent of ATP hydrolysis cycles. This non-specific binding produces false-positive signals in pull-down assays, obscures quantification of active disaggregation, and complicates kinetics measurements.
Hydrophobic Interactions
The substrate-binding domains (SBDs) of many chaperones are inherently hydrophobic. Misfolded aggregates present exposed hydrophobic surfaces, leading to promiscuous interactions.
Electrostatic Interactions
Net positive or negative charges on chaperone surfaces can bind non-specifically to oppositely charged aggregates or experimental surfaces (e.g., bead matrices in pull-down assays).
Table 1 quantifies how non-specific binding skews common disaggregation assay readouts.
Table 1: Impact of Non-Specific Binding on Disaggregation Assays
| Assay Type | Primary Readout | Effect of Non-Specific Binding | Typical Error Range |
|---|---|---|---|
| Co-immunoprecipitation | Pellet-associated chaperone | Increased background, false-positive identification | 20-50% of total signal |
| Fluorescence Anisotropy | Bound substrate fraction | Overestimation of binding affinity (Kd) | Kd can appear 2-10x tighter |
| ATPase Activity | Hydrolysis rate (kcat) | Basal rate elevation, masking substrate stimulation | Increase of 0.5-2 min⁻¹ |
| Light Scattering | Aggregate turbidity | Chaperone coating reduces scattering without disaggregation | Up to 30% signal drop |
Experimental Protocols for Mitigation
Protocol: Competitive Elution in Affinity Pulldown Assays
Objective: To distinguish specific (ATP-sensitive) from non-specific chaperone-substrate complexes. Materials: See Scientist's Toolkit. Procedure:
- Immobilize model aggregate (e.g., α-casein or thermally aggregated Luciferase) on NHS-activated sepharose beads.
- Block beads with 3% BSA in Assay Buffer (20 mM HEPES, pH 7.4, 50 mM KCl, 5 mM MgCl₂) for 1 hour.
- Incubate beads with chaperone (e.g., DnaK/DnaJ/GrpE system) in buffer ± 2 mM ATP for 30 min at 30°C.
- Wash beads 3x with 10 column volumes of Assay Buffer.
- Competitive Elution: Perform sequential 15-minute elutions: a. Elution 1: Assay Buffer + 500 mM NaCl (weakens electrostatics). b. Elution 2: Assay Buffer + 0.1% (v/v) Triton X-100 (weakens hydrophobics). c. Elution 3: Assay Buffer + 5 mM ATP (specific elution).
- Analyze eluates and bead-bound fraction by SDS-PAGE and densitometry.
Protocol: Surface Plasmon Resonance (SPR) with Regeneration Screening
Objective: To derive accurate kinetics by identifying conditions that remove non-specifically bound chaperone. Procedure:
- Immobilize aggregated substrate on a CMS sensor chip via amine coupling.
- Flow chaperone over the surface at multiple concentrations in running buffer (with 1 mM ADP to stabilize binding).
- Regeneration Screen: After each association/dissociation cycle, test 30-second pulses of potential regeneration solutions: a. 10 mM Glycine-HCl, pH 2.5 b. 1 M NaCl c. 0.05% SDS d. 2 mM ATP in running buffer
- Identify the mildest condition (often ATP) that returns response units (RU) to baseline without damaging the chip surface.
- Perform full kinetic series using this regeneration condition. Data fitting must account for a non-specific binding component using a two-site model.
The Scientist's Toolkit: Essential Reagents & Materials
Table 2: Key Research Reagent Solutions
| Item | Function & Rationale |
|---|---|
| Non-hydrolyzable ATP analogs (e.g., ATPγS) | Distinguish ATP-dependent binding; reduces non-specific signal by locking chaperone in high-affinity state. |
| Inert crowding agents (e.g., Ficoll PM-70, 2%) | Mimic cellular cytoplasm, reducing non-productive hydrophobic interactions by volume exclusion. |
| Charge-balanced assay buffers (e.g., CHAPS detergent, 0.1%) | Contains zwitterionic detergent to shield hydrophobic patches without disrupting protein function. |
| High-stringency wash buffers (e.g., with 250-500 mM KCl) | Disrupts weak electrostatic interactions during pull-down assays. |
| Competitor proteins (e.g., α-casein, 0.1 mg/mL) | Added to binding reactions to saturate common non-specific chaperone binding sites. |
| Tag-cleavage proteases (e.g., TEV protease) | Allows elution of affinity-tagged chaperones without denaturants, improving specificity. |
| Biotinylated substrates & Streptavidin matrices | Provides a uniform, high-affinity immobilization method, reducing heterogeneous substrate surfaces that promote stickiness. |
Data Interpretation & Normalization Strategies
Quantitative analysis must segregate specific from non-specific signals. A recommended approach is the ATP-Sensitive Binding Index (ASBI):
ASBI = (Bound_chaperone[-ATP] − Bound_chaperone[+ATP]) / Bound_chaperone[-ATP]
An ASBI < 0.7 suggests significant non-specific contribution, requiring mitigation. All disaggregation kinetics (e.g., from fluorescence recovery assays) should be baseline-corrected using control reactions containing a non-hydrolyzable ATP analog.
Visualizing Strategies and Pathways
Diagram 1: Pathways of chaperone binding to sticky substrates and mitigation strategies.
Diagram 2: Experimental workflow for isolating specific chaperone-substrate interactions.
Distinguishing Disaggregation from Mere Chaperone Binding or Anti-Aggregation
Within the broader thesis on the role of ATP hydrolysis in chaperone-mediated protein homeostasis, a critical conceptual and experimental challenge is differentiating true disaggregation from processes of binding stabilization (mere chaperone binding) or prevention of further aggregation (anti-aggregation). This whitepaper provides a technical framework for researchers and drug development professionals to design assays that unambiguously identify and quantify ATP-dependent disaggregation activity, moving beyond observational binding or inhibition studies.
Chaperone systems, such as Hsp70/DnaK with co-chaperones J-domain proteins and nucleotide exchange factors, and the AAA+ disaggregase Hsp104/ClpB, are postulated to utilize ATP hydrolysis to generate mechanical force for disentangling aggregated polypeptides. The central thesis in modern disaggregation research posits that ATP hydrolysis is not merely a regulatory switch for binding affinity but the essential energy source for the mechanical work of disentanglement. Consequently, experiments must discriminate between:
- ATP-dependent binding (chaperone associates with aggregate, possibly stabilizing it).
- ATP-dependent anti-aggregation (chaperone sequesters aggregation-prone species, preventing growth).
- Genuine ATP-dependent disaggregation (chaperone dissolves pre-formed, mature aggregates into native monomers).
Key Distinguishing Features & Assay Principles
Table 1: Distinguishing Features of Chaperone-Aggregate Interactions
| Feature | Mere Binding / Stabilization | Anti-Aggregation | Active Disaggregation |
|---|---|---|---|
| ATP Hydrolysis Role | May regulate on/off rates; not coupled to work. | Not required for prevention. | Essential and coupled to mechanical disruption. |
| Kinetic Readout | Binding saturation (e.g., FRET, EMSA). | Lag phase extension in aggregation kinetics. | Time-dependent decrease in aggregate signal from a pre-formed baseline. |
| Product State | Chaperone-Aggregate complex. | Soluble, chaperone-bound monomer/oligomer. | Free, functional monomer (key discriminator). |
| Dose-Response | Hyperbolic saturation curve. | Increased inhibition with chaperone concentration. | Sigmoidal often, indicating cooperative action. |
| Irreversibility | Reversible upon nucleotide change or dilution. | Prevention is reversible if chaperone is removed. | Irreversible restoration of monomers. |
Critical Experimental Methodologies
The Sequential Assay Workflow: Isolating Disaggregation
A definitive disaggregation assay must physically separate the chaperone binding/anti-aggregation phase from the disaggregation phase.
Protocol: Sequential Pulldown Disaggregation Assay
- Aggregate Formation: Incubate purified, aggregation-prone substrate (e.g., thermally or chemically denatured luciferase, α-synuclein) at conditions promoting mature amyloid or amorphous aggregate formation (e.g., 48°C for 45 min). Confirm by centrifugation (20,000 x g, 20 min) >90% in pellet.
- Wash & Isolate: Pellet aggregates. Discard supernatant containing unstable oligomers. Resuspend pellet in fresh assay buffer. This step removes pre-nucleation species central to anti-aggregation assays.
- Initiate Disaggregation: Add chaperone system (e.g., DnaK/DnaJ/GrpE + ClpB) and ATP/Mg²⁺ to the isolated aggregate suspension. Include controls: no ATP, ATPase-deficient mutants (e.g., ClpB E→A Walker B), no chaperone.
- Quantification at Multiple Nodes:
- Total Aggregates: Centrifuge aliquots at time points, analyze supernatant (S) vs. pellet (P) by SDS-PAGE.
- Functional Monomers: Measure recovery of enzymatic activity (luciferase) in the centrifugation-cleared supernatant.
- Sedimentation Analysis: Use analytical ultracentrifugation to track mass shift from large aggregates to monomeric species.
Diagram 1: Pathways from Aggregate to Monomer
Single-Molecule Verification
Protocol: Optical Tweezers Force Spectroscopy
- Substrate Tethering: Engineer a protein substrate with N- and C-terminal DNA handles for attachment between two micron-sized beads.
- Aggregate Seed Formation: Partially denature and allow intra-molecular misfolding/aggregation to form a stabilized "folded" state.
- Chaperone Introduction: Flow in chaperone system and ATP into the chamber.
- Measurement: Hold one bead fixed, use the other as a force sensor. True disaggregation is indicated by ATP hydrolysis-correlated, step-wise increases in contour length (ripping events) against constant or increasing force, directly visualizing mechanical unfolding/translocation. Mere binding shows only damping of Brownian motion without directed elongation.
Quantitative Data Analysis Criteria
Disaggregation data must fit a model of net aggregate loss, not just binding.
Table 2: Analysis of Key Disaggregation Experiment Outputs
| Experiment | Mere Binding Data | True Disaggregation Data |
|---|---|---|
| Sedimentation | Shift of substrate from pellet to supernatant only when chaperone is also in supernatant (co-sedimentation shift). | Increase of substrate in supernatant with chaperone predominantly remaining in supernatant. Substrate:chaperone ratio in S >> 1. |
| FRET (donor on aggregate, acceptor on chaperone) | High FRET signal sustained throughout. | Initial FRET increase (binding), followed by FRET decrease (dissociation of product). |
| Activity Recovery | No recovery. | >70% native activity recovery, correlating with monomer appearance kinetics. |
| ATPase Kinetics | Basal or slightly stimulated rate. | Strongly stimulated rate, with stoichiometric coupling (multiple ATP hydrolyzed per monomer released). |
The Scientist's Toolkit: Research Reagent Solutions
Table 3: Essential Reagents for Disaggregation Research
| Reagent | Function & Rationale |
|---|---|
| ATPγS (Adenosine 5′-[γ-thio]triphosphate) | Non-hydrolyzable ATP analog. Distinguishes ATP binding effects from hydrolysis. Essential negative control. |
| Walker B Mutant Proteins (e.g., ClpB E→A, Hsp104 E→A) | Catalytically inactive AAA+ disaggregases. Definitively uncouple binding/threading from hydrolysis. |
| Model Aggregating Substrates (Firefly Luciferase, Malate Dehydrogenase) | Form defined amorphous aggregates upon heating; activity recovery is clear functional readout. |
| Amyloidogenic Proteins (α-Synuclein, Aβ42) | Form structured fibrils. Require techniques like Thioflavin T fluorescence decay or pelleting assays. |
| Site-Specific Fluorescent Dyes (e.g., maleimide-Alexa Fluor) | For labeling specific cysteines in chaperone/substrate for FRET/single-molecule studies. |
| Crosslinkers (BS³, DSS) | To trap transient chaperone-substrate complexes for structural analysis (e.g., mass spectrometry). |
| J-domain Protein (e.g., DnaJ) & NEF (e.g., GrpE) Essential for Hsp70 system. | Co-chaperones are mandatory for full in vitro disaggregation activity; omission tests their specific role. |
| Real-Time ATPase Assay (NADH-coupled) | Continuous monitoring of ATP hydrolysis kinetics directly in disaggregation reaction. |
Integrated Experimental Workflow
A robust study should integrate multiple lines of evidence.
Diagram 2: Integrated Disaggregation Validation Workflow
Distinguishing disaggregation is fundamental to advancing the thesis that chaperone systems are mechanical machines powered by ATP hydrolysis. The field must move beyond qualitative co-localization or inhibition of aggregation kinetics. By employing sequential assays with isolated aggregates, demanding functional monomer recovery, and seeking direct evidence of mechanical work coupling to ATP hydrolysis, researchers can rigorously define true disaggregation activity. This precision is paramount for developing therapeutics targeting protein aggregation diseases, where the desired outcome is the active dissolution of pathological aggregates, not merely their stabilization.
This whitepaper addresses a central challenge in biochemical research on chaperone-driven protein disaggregation, a process fundamentally coupled to ATP hydrolysis. The broader thesis investigates the mechanochemical coupling of ATP hydrolysis in the Hsp104/70/40 chaperone system for amyloid disaggregation. A critical gap persists between the high-resolution kinetic parameters measured in vitro and the functional reality within the crowded, compartmentalized cellular environment. Reconciling these disparities is essential for accurate modeling, drug discovery targeting protein aggregation diseases, and understanding physiological proteostasis.
Quantitative Disparities:In Vitrovs. Cellular Disaggregation
Table 1: Comparative Kinetic Parameters of Chaperone Disaggregation Systems
| Parameter | In Vitro (Purified Systems) | Estimated Cellular Reality | Discrepancy Factor |
|---|---|---|---|
| ATP Hydrolysis Rate | Hsp104: 80-120 min⁻¹ (per hexamer) | Context-dependent; likely modulated by crowding, regulators | ~2-10x variable |
| Disaggregation Rate | 0.1-2.0 µg substrate/min/µM chaperone (model substrates) | Slower, limited by substrate accessibility & cellular constraints | ~10-100x |
| Effective Chaperone Conc. | 0.1-5 µM (controlled) | Hsp70: 10-100 µM; Hsp104: <1 µM (variable localization) | N/A |
| ATP:ADP Ratio | Typically saturating (≥5 mM ATP, negligible ADP) | ~5:1 to 2:1 (cytosol), spatially heterogeneous | N/A |
| Co-chaperone Stoichiometry | Defined ratios (e.g., Hsp40:Hsp70 1:1) | Dynamic, competitive binding, PTM-regulated | N/A |
Table 2: Factors Contributing to the Rate Discrepancy
| Factor | Impact on Rate/Relevance | Experimental Evidence |
|---|---|---|
| Macromolecular Crowding | Reduces diffusion; alters chaperone binding kinetics & ATPase activity. | FRAP shows reduced Hsp70 mobility in vivo. Decreased luciferase refolding rates in crowded buffers. |
| Substrate Complexity | Physiological aggregates are heterogeneous (proteolipid, RNA). | In vitro disaggregation of cellular extracts is less efficient than of pure model aggregates. |
| Regulatory Networks | Post-translational modifications (phosphorylation) tune activity dynamically. | Phosphomimetic Hsp104 mutants show altered disaggregation power. |
| Spatial Compartmentalization | Creates local concentration gradients of chaperones, ATP, and substrates. | Stress granules sequester chaperones; nucleocytoplasmic partitioning. |
| Competitive Binding | Numerous client proteins compete for chaperone binding sites. | In vivo cross-linking shows Hsp70 bound to diverse clients simultaneously. |
Detailed Experimental Protocols for Bridging the Gap
Protocol 1: Measuring ATPase Kinetics under Crowded ConditionsIn Vitro
Aim: To determine the effect of macromolecular crowding on chaperone ATP hydrolysis rates.
- Reagent Preparation: Prepare a crowding agent (e.g., 150 g/L Ficoll PM-70 or 200 g/L dextran) in assay buffer (40 mM HEPES-KOH, pH 7.4, 150 mM KCl, 10 mM MgCl₂).
- ATPase Assay: Use a coupled enzymatic assay (NADH oxidation) or a phosphate release assay (malachite green).
- Kinetics: In a 96-well plate, mix 0.5 µM chaperone complex (Hsp104/70/40) with crowding buffer. Initiate reaction with 5 mM ATP + regenerating system (2 mM PEP, 20 µg/ml PK).
- Data Acquisition: Monitor absorbance at 340 nm (NADH) or 650 nm (malachite green) every 30 sec for 60 min at 30°C.
- Analysis: Calculate initial velocity (V₀). Compare Michaelis-Menten parameters (Kₘ, Vₘₐₓ) with and without crowding agents.
Protocol 2:In VivoDisaggregation Flux Analysis via Fluorescence Recovery
Aim: To quantify disaggregation capacity for defined substrates in living cells.
- Cell Line Engineering: Stably express a disaggregation sensor (e.g., heat-aggregated YFP-β17 or a photoconvertible aggregate-forming protein like pa-mCherry).
- Aggregate Induction: Apply precise heat shock (e.g., 42°C for 30 min) or induce photoconversion of a specific region of interest (ROI) with 405 nm laser.
- Inhibition & Monitoring: Treat cells with ATP synthase inhibitor (oligomycin, 5 µM) to modulate cellular ATP or DMSO control. Image recovery of soluble fluorescence in the aggregate ROI over 120 min using time-lapse confocal microscopy.
- Quantification: Plot mean fluorescence intensity in the ROI over time. Fit curve to a single exponential to obtain the disaggregation rate constant (k) under different ATP-depletion regimes.
Protocol 3: Cross-linking Mass Spectrometry (XL-MS) for Native Complex Stoichiometry
Aim: To determine the physiological composition of chaperone-client complexes during disaggregation.
- In Vivo Cross-linking: Treat yeast or mammalian cells expressing tagged chaperones (e.g., Hsp104-FLAG) under disaggregation conditions (recovery from heat shock). Add membrane-permeable cross-linker (e.g., DSS, 2 mM final) for 30 min at 25°C.
- Cell Lysis & Affinity Purification: Lyse cells in mild detergent buffer. Immunoprecipitate complexes using anti-FLAG beads.
- Proteomic Sample Prep: On-bead digest with trypsin/Lys-C after cross-link reversal. Enrich for cross-linked peptides.
- LC-MS/MS & Analysis: Analyze peptides on a high-resolution mass spectrometer. Use software (e.g., xiSEARCH, MaxLynx) to identify cross-linked residue pairs and infer interacting proteins and approximate stoichiometries within the complex.
Visualization of Concepts and Workflows
The Scientist's Toolkit: Research Reagent Solutions
Table 3: Essential Reagents for Disaggregation Research
| Reagent / Material | Function & Relevance |
|---|---|
| Recombinant Chaperones (Hsp104, Hsp70, Hsp40) | Purified, active proteins for in vitro ATPase and disaggregation assays. Essential for defining baseline kinetics. |
| Crowding Agents (Ficoll PM-70, Dextran, BSA) | Mimic the excluded volume effects of the cytosol. Used to adjust in vitro assays for greater physiological relevance. |
| ATP Regeneration Systems (PEP/PK; CP/CK) | Maintain constant [ATP] during long in vitro assays, preventing product inhibition from ADP accumulation. |
| Environment-Sensitive Dyes (Malachite Green, NADH) | Enable colorimetric/fluorometric detection of phosphate release or ATP consumption in real-time kinetic assays. |
| Photoconvertible Fluorescent Proteins (pa-mCherry, Dendra2) | Enable generation of traceable aggregate populations within living cells via targeted illumination, allowing in vivo disaggregation tracking. |
| Membrane-Permeable Cross-linkers (DSS, DSG) | Capture transient, native protein-protein interactions in vivo for subsequent MS analysis of complex composition. |
| ATP Depletors (Oligomycin, 2-Deoxyglucose) | Modulate cellular ATP levels in validation experiments to test the energy dependence of disaggregation flux. |
| FRAP-Compatible Cell Lines | Engineered cells expressing fluorescently tagged chaperones or substrates to measure mobility and binding dynamics in real time. |
Within the broader thesis on ATP hydrolysis in chaperone disaggregation activity research, a central challenge emerges: achieving precise targeting of chaperone ATPase activity within the complex milieu of the cellular proteostasis network. This whitepaper provides an in-depth technical guide on strategies to overcome this specificity barrier, which is critical for both fundamental mechanistic studies and the development of therapeutics aimed at modulating proteostasis in diseases such as neurodegeneration and cancer.
The Specificity Challenge in Complex Mixtures
Chaperone systems like Hsp70, Hsp90, and ClpB/Hsp104 operate within environments crowded with numerous ATPases and nucleotide-binding proteins. Their ATP hydrolysis cycles are often regulated by cochaperones and client proteins, creating a dynamic and interconnected system. Non-specific assays or inhibitors can lead to confounding data and off-target effects.
Key Strategies for Enhanced Specificity
Activity-Based Protein Profiling (ABPP) with ATP Probes
This chemoproteomic approach uses chemically modified ATP analogues to covalently label active ATP-binding sites.
Detailed Protocol:
- Probe Synthesis: Prepare a desthiobiotin- or alkyne-tagged ATP acyl phosphate probe (ATP-OP). The acyl phosphate moiety acts as a reactive electrophile for nucleophilic residues (e.g., lysines) in the ATP-binding pocket.
- Labeling Reaction: Incubate the complex protein mixture (e.g., cell lysate) with 5-10 µM ATP-OP probe in reaction buffer (50 mM HEPES pH 7.5, 10 mM MgCl₂) for 30-60 minutes at 25°C. Include controls with excess native ATP (1 mM) to compete out specific labeling.
- Conjugation: If using an alkyne probe, perform a copper-click reaction with an azide-fluorophore or azide-biotin tag.
- Detection & Pull-down: Analyze by in-gel fluorescence for direct visualization. For target identification, perform streptavidin-biotin pull-down, followed by on-bead tryptic digest and LC-MS/MS analysis.
Orthogonal ATPase Assays with Sequential Specificity
Coupling multiple assay formats reduces false positives.
Detailed Protocol:
- Step 1 - Coupled Enzymatic Assay (High-Throughput Screening): In a 96-well plate, combine chaperone sample, ATP (1 mM), and coupling system (2 mM phosphoenolpyruvate, 0.2 mM NADH, 10 U/mL pyruvate kinase, 10 U/mL lactate dehydrogenase). Monitor NADH absorbance at 340 nm for 30 minutes. This identifies general ATPase activity.
- Step 2 - Phosphate Sensor Verification (Specific Confirmation): Take hits from Step 1. Use a malachite green phosphate assay kit. Perform the reaction in a separate tube, stop with malachite green reagent, and measure A₆₂₀. This confirms inorganic phosphate release.
- Step 3 - Radiolabeled Filter-Binding Assay (Gold Standard): For final validation, use [γ-³²P]ATP. Incubate chaperone with the labeled ATP. Terminate reaction with 5% TCA. Spot on a cellulose phosphate filter, wash extensively with 10 mM phosphoric acid, and quantify by scintillation counting. This provides direct, irreversible evidence of ATP hydrolysis.
CRISPR-Based Endogenous Tagging for Native Complex Isolation
Genetic manipulation allows for the isolation of specific chaperone complexes from native environments.
Detailed Protocol:
- Cell Line Engineering: Use CRISPR/Cas9 to knock-in an affinity tag (e.g., 3xFLAG, BioID2) at the C-terminus of the target chaperone gene (e.g., HSPA1A) in the desired cell line.
- Native Purification: Lyse cells in a gentle, non-denaturing lysis buffer (40 mM HEPES-KOH pH 7.4, 120 mM KCl, 1% Triton X-100, 2 mM EDTA, plus protease/phosphatase inhibitors). Incubate lysate with anti-FLAG M2 affinity gel for 2 hours at 4°C.
- ATPase Activity Elution: Wash beads extensively. Instead of eluting with FLAG peptide, perform an on-bead ATPase assay by adding ATP-containing buffer directly to the bead slurry. Measure phosphate release (via malachite green) specifically from the isolated, native complex.
Chaperone-Specific Inhibitor Design Utilizing Allosteric Pockets
Moving beyond the conserved ATP-binding pocket to target unique regulatory sites.
Detailed Protocol for Allosteric Inhibitor Screening:
- Thermal Shift Assay (CETSA): Treat cells or lysate with a candidate allosteric compound (e.g., a myricetin derivative for Hsp70). Incubate for 30 min, heat shock at graded temperatures (37°C-65°C), and lyse. Centrifuge to separate stabilized (soluble) from denatured (pelleted) protein. Detect target chaperone in supernatant via immunoblotting. A rightward shift in melting curve indicates compound binding and stabilization.
- ATPase Activity Correlation: In parallel, test the same compound concentrations in a malachite green ATPase assay with purified chaperone. A compound that stabilizes the chaperone (CETSA) and inhibits its ATPase activity confirms an allosteric mode of action.
Table 1: Comparison of ATPase Activity Assay Specificity Parameters
| Assay Method | Limit of Detection (Pi) | Dynamic Range | Susceptibility to Interference (High/Low) | Best Use Case |
|---|---|---|---|---|
| Coupled Enzymatic (NADH) | ~2 nmol | 10-1000 nmol | High (other NADH-consuming enzymes) | Initial high-throughput kinetic screening |
| Malachite Green | ~1 nmol | 5-500 nmol | Medium (acid-labile phosphoproteins) | Specific verification, endpoint studies |
| Radiolabeled [γ-³²P]ATP | ~0.1 nmol | 0.5-200 nmol | Low | Gold-standard validation, low-activity complexes |
| Bioluminescent (Luciferase) | ~0.01 nmol | 0.05-50 nmol | Medium (endogenous ATP) | Ultra-high sensitivity, single-timepoint |
Table 2: Profiling of Common Chaperone ATPase Activities in Lysate
| Chaperone System | Basal ATPase Rate* (min⁻¹) | Stimulated Rate* (min⁻¹) (Cochaperone/Client) | Common Specific Inhibitor (IC₅₀) |
|---|---|---|---|
| Hsp70 (DnaK) | 0.001 - 0.01 | 0.05 - 0.1 (with DnaJ/GrpE) | VER-155008 (~1 µM) |
| Hsp90 | 0.01 - 0.02 | 0.1 - 0.3 (with p23/Aha1) | Gamitrinib (~5 µM) |
| Hsp104/ClpB | 0.02 - 0.05 | 0.3 - 0.8 (with substrate + Hsp70) | Dihydrocoumarin (~100 µM) |
| TRiC/CCT | <0.001 | 0.01 - 0.02 (with folding intermediate) | (-) No highly specific inhibitor |
*Rates are approximate and context-dependent.
The Scientist's Toolkit: Key Research Reagent Solutions
| Item | Function & Specificity Role |
|---|---|
| ATP-OP Biotin Probe (Active-site directed) | Covalently labels lysines in ATP-binding pockets; enables pulldown and identification of active ATPases from mixtures. |
| Non-hydrolyzable ATP Analogues (e.g., AMP-PNP, ATPγS) | Used in competition assays, crystallography, and as negative controls to isolate ATP-binding events from hydrolysis. |
| Chaperone-Specific Nanobodies/Single-Domain Antibodies | Recognize unique conformational states; allow immunoprecipitation of specific functional chaperone subpopulations. |
| Phosphate Sensor Dyes (e.g., MgGreen, BioVision kits) | Real-time, fluorescent detection of Pi release; offer better temporal resolution than endpoint assays like malachite green. |
| Bioluminescent ATPase Assay Kits (e.g., Promega) | Detect ADP formed; extremely sensitive and suitable for low-activity chaperones in diluted, complex samples. |
| CETSA-compatible Antibodies | Validated for immunoblot detection of chaperone thermal stability shifts upon ligand binding in cell lysates. |
| Endogenously Tagged Cell Lines (e.g., HaloTag-HSP90) | Enable isolation of native complexes under physiological conditions, preserving relevant cofactors. |
Experimental & Conceptual Diagrams
Diagram 1: ABPP Workflow for Target ID
Diagram 2: Orthogonal Assay Strategy
Diagram 3: Hsp70 ATPase Cycle & Targeting Points
Benchmarking Power: Validating and Comparing Disaggregation ATPases Across Systems
1. Introduction: Thesis Context This technical guide is framed within the broader thesis that the kinetics and regulation of ATP hydrolysis are fundamental determinants of functional specialization in protein disaggregation systems. Understanding the distinct catalytic cycles and allosteric control mechanisms of Hsp104, ClpB, and the metazoan Hsp70/Hsp110 system is critical for elucidating their roles in proteostasis and for developing targeted therapeutic interventions in neurodegenerative and aging-related diseases.
2. Quantitative Kinetic Parameter Comparison Table 1: Comparative ATPase Kinetic Parameters
| Parameter | Hsp104 (S. cerevisiae) | ClpB (E. coli) | Metazoan Hsp70 (Human HspA1A) | Metazoan Hsp110 (Human HSPH1) |
|---|---|---|---|---|
| kcat (min⁻¹) | ~100 - 400 (per hexamer) | ~50 - 150 (per hexamer) | ~0.2 - 2 (per monomer) | ~1 - 10 (per monomer) |
| KM for ATP (μM) | 50 - 150 | 100 - 300 | 1 - 20 | 50 - 200 |
| Hill Coefficient (nH) | ~1.5 - 2.0 (positive coop) | ~1.2 - 1.8 (positive coop) | ~1 (Michaelis) | ~1 (Michaelis) |
| ADP Ki (μM) | ~50 | ~100 | ~5 - 20 | ~50 - 150 |
| Key Regulatory Input | Hsp70 (Ssa1), substrate | DnaK/DnaJ/GrpE, substrate | Nucleotide Exchange Factors (NEFs), J-domain proteins, substrate | Client protein, Nucleotide state |
| Primary Function | Disaggregase (standalone) | Disaggregase (with DnaKJE) | Foldase/ Holdase (core) | NEF for Hsp70, Holdase |
3. Detailed Experimental Protocols
3.1. Coupled Enzymatic ATPase Assay (Standard Protocol)
- Objective: To measure steady-state ATP hydrolysis kinetics.
- Reagents: Purified chaperone protein (Hsp104/ClpB/Hsp70/Hsp110), ATP, phosphoenolpyruvate (PEP), pyruvate kinase/lactate dehydrogenase (PK/LDH) enzyme mix, NADH, reaction buffer (typically 25-50 mM HEPES-KOH pH 7.4, 100-150 mM KCl, 10 mM MgCl₂).
- Procedure:
- Prepare a master mix containing buffer, PEP (1-2 mM), NADH (0.2-0.3 mM), PK/LDH mix.
- Aliquot master mix into a 96-well plate. Add varying concentrations of ATP (e.g., 0-2 mM range).
- Initiate reaction by adding purified chaperone protein.
- Monitor the decrease in absorbance at 340 nm (A₃₄₀) due to NADH oxidation in a plate reader at 30-37°C for 10-30 minutes.
- Calculate ATP hydrolysis rate from the linear slope of A₃₄₀ vs. time, using NADH's extinction coefficient (6220 M⁻¹cm⁻¹).
- Fit data (velocity vs. [ATP]) to the Michaelis-Menten or Hill equation to derive kcat, KM, and nH.
3.2. Stopped-Flow Fluorescence for Pre-Steady-State Kinetics
- Objective: To observe rapid, single-turnover events and conformational changes.
- Reagents: Chaperone protein labeled with a fluorophore (e.g., at a conserved cysteine using IAEDANS), ATP/ADP, non-hydrolyzable ATP analogs (AMP-PNP, ATPγS).
- Procedure:
- Load one syringe with fluorophore-labeled protein and another with nucleotide.
- Rapidly mix equal volumes (typical dead time ~1 ms) in the stopped-flow instrument.
- Monitor fluorescence change (e.g., intensity, anisotropy, FRET) over milliseconds to seconds.
- Fit resulting traces to exponential equations to extract observed rate constants (kobs) for nucleotide binding, hydrolysis, or product release steps.
3.3. Single-Molecule FRET (smFRET) for Real-Time Conformational Dynamics
- Objective: To correlate ATPase cycle with structural transitions in individual complexes.
- Reagents: Doubly labeled chaperone mutant (donor: Cy3, acceptor: Cy5), oxygen scavenging system (glucose oxidase/catalase), triplet state quencher (Trolox), ATP/ADP.
- Procedure:
- Immobilize biotinylated chaperone on a PEG-passivated, streptavidin-coated quartz slide.
- Image using a total internal reflection fluorescence (TIRF) microscope.
- Perfuse with imaging buffer containing ATP or ADP.
- Record donor and acceptor emission trajectories for individual molecules. Calculate FRET efficiency (E = IA/(ID+IA)) over time.
- Analyze trajectories using hidden Markov modeling to identify discrete conformational states and transition rates linked to nucleotide turnover.
4. Visualization of Systems and Workflows
Title: ATPase Cycle of Hsp104/ClpB
Title: Metazoan Hsp70/Hsp110 Disaggregation Pathway
Title: Kinetics Study Experimental Workflow
5. The Scientist's Toolkit: Key Research Reagent Solutions
Table 2: Essential Research Reagents for Chaperone ATPase Studies
| Reagent / Material | Function / Application | Example (Supplier) |
|---|---|---|
| Recombinant Chaperone Proteins | Purified, often tagged (His, GST) versions of Hsp104, ClpB, Hsp70, Hsp110 for in vitro assays. | Custom expression/purification, Enzo Life Sciences |
| Coupled Enzyme ATPase Assay Kit | Provides optimized mix of PK/LDH, PEP, and NADH for convenient, continuous monitoring of ATP hydrolysis. | Sigma-Aldrich (MAK113), Cytoskeleton (BK009) |
| Non-Hydrolyzable ATP Analogs | AMP-PNP, ATPγS, and ADP-BeFx used to trap specific nucleotide states for structural and mechanistic studies. | Jena Bioscience, Sigma-Aldrich |
| Fluorescent Nucleotide Analogs | Mant-ATP, TNP-ATP, or Cy3/5-ATP for direct monitoring of nucleotide binding and release kinetics via fluorescence. | Thermo Fisher, Jena Bioscience |
| Site-Directed Mutagenesis Kit | For creating catalytic mutants (e.g., Walker A/B) or introducing cysteine residues for fluorophore labeling. | Agilent (QuikChange), NEB |
| Thiol-Reactive Fluorophores | Maleimide or iodoacetamide derivatives of dyes (e.g., IAEDANS, Cy3/5-maleimide) for site-specific protein labeling. | Thermo Fisher |
| Biotinylation Reagent | Enzymatic (BirA) or chemical (sulfo-NHS-biotin) tools for biotinylating chaperones for surface immobilization in smFRET. | Thermo Fisher, Avidity |
| Single-Molecule Imaging Buffer Kit | Pre-formulated systems containing oxygen scavengers and triplet state quenchers essential for stable smFRET imaging. | Applied Photophysics, Lumicks |
1. Introduction Within the broader thesis on ATP hydrolysis in chaperone disaggregation activity research, validating mechanistic models is paramount. Chaperone systems, such as Hsp70/DnaJ (J-domain protein)/GrpE or the hexameric Hsp100 disaggregases like ClpB in bacteria or Hsp104 in yeast, rely on ATP binding and hydrolysis cycles to power substrate remodeling and disaggregation. This technical guide details the integrated strategies of genetic and pharmacological inhibition of ATP hydrolysis to dissect these mechanisms, providing essential validation for proposed models of chaperone function.
2. Core Mechanistic Models of ATP Hydrolysis in Disaggregation Disaggregation involves coordinated ATP-driven conformational changes. Two primary models exist:
- Sequential or Concerted Hydrolysis: Whether ATP hydrolysis events within a hexameric ring occur sequentially or in a coordinated, concerted manner.
- Power Stroke vs. Brownian Ratchet: Whether hydrolysis provides a directed, forceful "power stroke" or biases thermally driven fluctuations ("ratchet").
Inhibition of ATP hydrolysis at specific points is critical to test these models and identify which steps are rate-limiting.
3. Methodological Framework for Validation
3.1. Genetic Inhibition: Site-Directed Mutagenesis This approach introduces specific, stable mutations into the chaperone's ATPase sites.
- Target Residues: Key catalytic residues are mutated. For example, in Hsp70s, mutation of the conserved lysine in the nucleotide-binding domain (e.g., K71 in DnaK) abolishes hydrolysis. In AAA+ domains of Hsp100 proteins, mutations in the Walker B motif (e.g., E→Q) trap ATP, while Sensor-2 motif mutations (e.g., R→K) impair hydrolysis.
- Protocol Outline:
- Primer Design: Design mutagenic primers incorporating the desired nucleotide change.
- PCR Mutagenesis: Perform a site-directed mutagenesis PCR using the chaperone gene in a plasmid vector as template.
- DpnI Digestion: Digest the methylated parental DNA template with DpnI endonuclease.
- Transformation: Transform the reaction product into competent E. coli cells for plasmid amplification.
- Sequence Verification: Isolate plasmid DNA and confirm the mutation by Sanger sequencing.
- Protein Expression & Purification: Express and purify the mutant protein using standard affinity chromatography (e.g., His-tag purification).
- Key Data Outputs: Measurement of mutant protein's basal ATPase activity, affinity for ATP/ADP, and competence in in vitro disaggregation assays with model substrates (e.g., aggregated luciferase).
3.2. Pharmacological Inhibition: Small Molecule Inhibitors This approach uses reversible or irreversible inhibitors to acutely perturb ATPase activity, allowing temporal control.
- Common Inhibitors:
- Hsp70 Inhibition: VER-155008 binds the ATPase domain, competing with ATP. MKT-077 derivatives target the substrate-binding domain, allosterically affecting ATPase cycling.
- Hsp90 Inhibition: Although not a direct disaggregase, its inhibition (e.g., by Geldanamycin) affects co-chaperone networks.
- Hsp104 Inhibition: Dihydrocoumarin, Guaiacol, and recently identified novel compounds block specific conformational states.
- Protocol Outline for In Vitro Inhibition Assay:
- ATPase Activity Assay: Set up a malachite green phosphate assay or coupled enzymatic assay (NADH oxidation) in a buffer containing Mg-ATP and the purified chaperone system.
- Inhibitor Titration: Add the small-molecule inhibitor across a concentration range (e.g., 0.1 nM to 100 µM). Include a DMSO vehicle control.
- Kinetic Measurement: Monitor inorganic phosphate (Pi) release or NADH absorbance over time (typically 30-90 mins) at a suitable temperature (e.g., 30°C or 37°C).
- IC₅₀ Determination: Fit the dose-response curve to calculate the half-maximal inhibitory concentration.
4. Integrated Validation: Key Experimental Data Data from genetic and pharmacological inhibition are compared to validate consistency and identify on-target effects.
Table 1: Quantitative Outcomes of ATP Hydrolysis Inhibition
| Chaperone System | Inhibition Method | Target | Resultant ATPase Activity (% of WT) | Effect on Disaggregation (% of WT Activity) | Key Inference |
|---|---|---|---|---|---|
| Hsp70 (DnaK) | Genetic (K71A) | Walker A (ATP binding) | < 5% | < 5% | ATP binding essential for all functions. |
| Hsp70 (DnaK) | Pharmacological (VER-155008, 50µM) | ATPase domain | ~20% | ~25% | Confirms ATPase domain as a druggable target for disaggregation blockade. |
| Hsp104 | Genetic (E285Q, Walker B) | AAA-1 Domain | < 2% (Basal) | < 10% | AAA-1 hydrolysis is essential for powering disaggregation. |
| Hsp104 | Genetic (R334K, Sensor-2) | AAA-1 Domain | ~30% | ~15% | Sensor-2 residue critical for coupling hydrolysis to mechanical work. |
| Hsp104 | Pharmacological (Guaiacol, 5mM) | Middle Domain | ~60% | < 20% | Uncouples ATPase activity from translocase function, suggesting allosteric inhibition. |
Table 2: Essential Research Reagent Solutions
| Reagent/Material | Function & Application | Example Product/Source |
|---|---|---|
| Mutant Chaperone Plasmids | Template for expressing site-directed mutants for biochemical studies. | Addgene vectors for Hsp70, Hsp104; laboratory-constructed mutants. |
| High-Fidelity DNA Polymerase | Accurate amplification during mutagenesis PCR (e.g., Q5, Pfu). | NEB Q5 Hot Start, Agilent PfuUltra II. |
| Malachite Green Phosphate Assay Kit | Colorimetric quantification of inorganic phosphate released from ATP hydrolysis. | Sigma-Aldrich MAK307, BioAssay Systems QuantiChrom. |
| Coupled NADH ATPase Assay Reagents | Continuous spectroscopic ATPase activity measurement. | PK/LDH enzymes from Roche, MilliporeSigma. |
| VER-155008 | Small molecule ATP-competitive inhibitor of Hsp70. | Tocris Bioscience (Cat. No. 3803). |
| MKT-077 Analogue (YM-1) | Allosteric inhibitor targeting the Hsp70 substrate-binding domain. | Available through specialized chemical suppliers. |
| Guaiacol | Pharmacological inhibitor of Hsp104 disaggregase activity. | Sigma-Aldrich (Cat. No. G5502). |
| Aggregated Substrate (Luciferase) | Model substrate for in vitro disaggregation/reactivation assays. | Firefly luciferase from Promega, heat- or chemically aggregated. |
5. Visualizing Mechanisms and Workflows
Targeting ATP Hydrolysis in the Chaperone Cycle
Integrated Genetic & Pharmacological Workflow
6. Conclusion The synergistic application of genetic and pharmacological inhibition of ATP hydrolysis provides a robust framework for validating mechanistic models of chaperone disaggregation. Consistent results from both approaches strengthen model credibility, while discrepancies can reveal off-target effects or context-dependent roles of hydrolysis. This validation is a critical step in the broader thesis, informing the development of targeted therapeutics for protein aggregation diseases.
This whitepaper situates the comparative analysis of chaperone disaggregase capacities within the overarching thesis on the role and regulation of ATP hydrolysis in chaperone-mediated protein disaggregation. The efficient reactivation of aggregated proteins is a fundamental cellular process conserved from bacteria to humans, with the core ATP-fueled disaggregase engines showing remarkable evolutionary divergence in composition, mechanism, and capacity. Understanding these cross-species differences, particularly in the kinetics and efficiency of ATP utilization, provides critical insights for fundamental biology and drug development, especially for neurodegenerative diseases linked to protein aggregation.
Efficient protein disaggregation is driven by conserved AAA+ (ATPases Associated with diverse cellular Activities) ring complexes, but their specific composition and co-chaperone requirements vary significantly.
In Bacteria (E. coli): The primary disaggregase is the ClpB hexamer, which functions in partnership with the DnaK (Hsp70) system and its co-chaperones DnaJ and GrpE. ClpB extracts and unfolds polypeptides from aggregates, threading them through its central pore, and passes them to DnaK for refolding. ATP hydrolysis drives the conformational changes in both ClpB and DnaK.
In Yeast (S. cerevisiae): The homologous disaggregase is Hsp104, also a hexameric AAA+ protein. Like ClpB, Hsp104 requires the Hsp70 (Ssa1) system and its co-chaperones (Hsp40/Ydj1) for full disaggregation activity. Hsp104 exhibits a higher inherent disaggregation potential for certain amyloid fibers compared to its bacterial counterpart.
In Humans: Metazoans lack a direct Hsp104/ClpB homolog. Disaggregation is carried out by a complex network involving the Hsp70 system (HSPA), Hsp110 (HSPH; a nucleotide exchange factor), and Hsp40 (DNAJ) co-chaperones, sometimes with the assistance of Hsp90. The primary disaggregase activity resides in a collaborative mechanism where Hsp110 and Hsp40 synergistically activate Hsp70, enabling it to perform extraction and disaggregation without a dedicated hexameric ATPase.
Quantitative Comparison of Key Parameters
The efficiency of disaggregation is quantified by metrics such as ATP consumption rate, disaggregation yield, and reaction velocity. The following table synthesizes key quantitative data from recent studies.
Table 1: Comparative Disaggregase Activity Metrics
| Parameter | E. coli ClpB/DnaK System | S. cerevisiae Hsp104 System | Human Hsp70/Hsp110/Hsp40 System |
|---|---|---|---|
| Core AAA+ ATPase | ClpB Hexamer | Hsp104 Hexamer | HSPA (Hsp70) - No dedicated hexamer |
| Key Co-chaperones | DnaK (Hsp70), DnaJ, GrpE | Ssa1 (Hsp70), Ydj1 (Hsp40) | HSPH (Hsp110), DNAJ (Hsp40) |
| ATP Hydrolysis Rate (per hexamer/min) | ~1200 (ClpB + DnaK system) | ~600-900 (Hsp104 + Ssa1) | System-wide; Hsp70 ~20/min/client |
| Disaggregation Yield (% luciferase reactivation) | ~60-80% (model substrate) | ~70-90% (model substrate) | ~40-60% (model substrate) |
| Typical in vitro [ATP] | 2-5 mM | 2-5 mM | 1-3 mM |
| Mg²⁺ Requirement | 2-5 mM | 2-5 mM | 1-2 mM |
| Notable Inhibitors | Dihydropyridines (e.g., 5'-Cl-NVB) | Guaiacol, KUSs | JG compounds, MAL3-101 |
Note: Values are approximate and can vary based on substrate, assay conditions, and specific isoforms used.
Table 2: Key Structural and Functional Features
| Feature | ClpB | Hsp104 | Human Hsp70 System |
|---|---|---|---|
| Conserved Domains | N-domain, AAA-1, AAA-2, M-domain | N-domain, AAA-1, AAA-2, M-domain, NTD | SBD (Substrate Binding), NBD (Nucleotide Binding) |
| Threading Pore | Formed by AAA-1 & AAA-2 loops | Formed by AAA-1 & AAA-2 loops | No central pore; extraction via allosteric mechanism |
| Primary Aggregates Targeted | Heat-denatured aggregates, amorphous aggregates | Amorphous & amyloid aggregates (e.g., Sup35) | Amorphous aggregates, disease-associated amyloids (limited) |
| Role of ATP Hydrolysis | Powers threading, coordinates with DnaK | Powers threading, coordinates with Ssa1 | Drives substrate binding/release cycle; Hsp110 acts as NEF |
Detailed Experimental Protocols for Assessing Disaggregase Activity
Protocol 1: Luciferase Reactivation Disaggregation Assay (Standard)
This assay measures the functional recovery of heat-aggregated firefly luciferase.
- Substrate Aggregation: Incubate firefly luciferase (40 nM) at 45°C for 10-15 min in HEPES-KOH buffer (pH 7.4) to induce aggregation.
- Reaction Setup: Prepare a master mix containing an ATP-regenerating system (2 mM ATP, 10 mM creatine phosphate, 20 µg/mL creatine kinase), 5-10 mM MgCl₂, and disaggregation machinery components at physiological ratios (e.g., for yeast: 0.5 µM Hsp104, 2 µM Ssa1, 1 µM Ydj1).
- Initiation & Measurement: Add aggregated luciferase to the master mix. Incubate at 30°C (or 37°C for mammalian systems). At timed intervals, remove aliquots and measure recovered luciferase activity by adding luciferin and measuring bioluminescence with a luminometer.
- Controls: Include negative controls lacking ATP or a key chaperone (e.g., Hsp104).
Protocol 2: ATP Hydrolysis Coupled Enzyme Assay
This continuous spectrophotometric assay measures the rate of ATP consumption during disaggregation.
- Reagent Mix: In a quartz cuvette, combine assay buffer, 2 mM phospho(enol)pyruvate (PEP), 0.2 mM NADH, 20 U/mL pyruvate kinase, 20 U/mL lactate dehydrogenase, 2-5 mM ATP, and MgCl₂.
- Baseline: Add the chaperone/disaggregase system components. Monitor absorbance at 340 nm to establish a baseline ATPase rate.
- Initiation: Add aggregated substrate (e.g., casein or aggregated luciferase) to the reaction. The hydrolysis of ATP to ADP is coupled via the enzymes to the oxidation of NADH to NAD⁺, causing a decrease in A340.
- Calculation: The rate of ATP hydrolysis is calculated using the extinction coefficient for NADH (ε340 = 6220 M⁻¹cm⁻¹). The stimulated rate upon substrate addition reflects the ATP cost of disaggregation.
Protocol 3: Amyloid Disaggregation Monitored by Thioflavin T (ThT) Fluorescence
This assay specifically monitors the disassembly of amyloid fibrils.
- Fibril Formation: Generate amyloid fibrils from a protein like α-synuclein or yeast Sup35NM. Label by incorporating 20 µM ThT.
- Reaction: Add the disaggregase system (e.g., Hsp104/Ssa1/Ydj1) and ATP/Mg²⁺ to the fibrils in a multi-well plate.
- Measurement: Monitor ThT fluorescence (excitation 440 nm, emission 485 nm) in a plate reader at 30-37°C over several hours. A decrease in fluorescence indicates fibril disassembly.
- Analysis: Normalize fluorescence to initial values. Compare initial rates of decay between different systems.
Diagrams of Pathways and Workflows
Title: Yeast Hsp104-Mediated Disaggregation Pathway
Title: Generic Disaggregation Assay Workflow
Title: Human Hsp70-Based Disaggregase Mechanism
The Scientist's Toolkit: Research Reagent Solutions
Table 3: Essential Reagents for Disaggregation Research
| Reagent / Material | Function & Rationale |
|---|---|
| Firefly Luciferase | Model aggregation-prone substrate. Functional reactivation provides a sensitive, quantitative readout of disaggregation efficiency. |
| ATP Regeneration System (Creatine Phosphate/Creatine Kinase or PEP/Pyruvate Kinase) | Maintains constant [ATP] during long reactions, preventing depletion and ensuring sustained chaperone activity. Critical for kinetic assays. |
| Recombinant Chaperones (ClpB, Hsp104, Hsp70, Hsp40, Hsp110 isoforms) | High-purity, active proteins are required for mechanistic in vitro reconstitution assays. Often N-His-tagged for purification. |
| Thioflavin T (ThT) | Fluorogenic dye that intercalates into amyloid fibrils. A decrease in fluorescence reports specifically on amyloid disaggregation. |
| Casein-FITC (Fluorescein-labeled) | An amorphous, non-native aggregate substrate. Disaggregation increases fluorescence signal due to dequenching, allowing real-time monitoring. |
| ATPγS (Adenosine 5′-[γ-thio]triphosphate) | A slowly hydrolyzable ATP analog. Used to trap chaperone-substrate complexes or to dissect ATPase cycle steps. |
| Specific Inhibitors (e.g., KUSs for Hsp104, JG compounds for Hsp70) | Pharmacological tools to probe the contribution of specific chaperones to disaggregation in complex systems or cells. |
| Size-Exclusion Chromatography (SEC) Columns (e.g., Superose 6) | To separate disaggregation reaction products, analyzing changes in aggregate size and the formation of intermediate complexes. |
This whitepaper validates the disease context of ATPase dysfunction within experimental models of Alzheimer's disease (AD) and Parkinson's disease (PD), framed by a broader thesis on ATP hydrolysis in chaperone disaggregation. Protein misfolding and aggregation are hallmarks of neurodegeneration. A critical line of defense is the chaperone network, whose disaggregation and refolding activities are directly powered by ATP hydrolysis. Dysfunction in specific ATPase components of these systems is increasingly recognized as a central pathogenic mechanism, making it a prime target for therapeutic intervention.
Core ATPase Systems in Proteostasis
Two primary ATP-dependent systems are central to combating aggregation: the Hsp70 chaperone system (with Hsp70 and Hsp40 co-chaperones) and the AAA+ (ATPases Associated with diverse cellular Activities) disaggregase Hsp104 (in yeast) and its mammalian homolog, the Hsp110-Hsp70-Hsp40 disaggregation complex. The ATP hydrolysis cycle drives conformational changes necessary for substrate binding, threading, and release.
Quantitative Validation of ATPase Dysfunction in Models
The following tables summarize key experimental findings demonstrating ATPase dysfunction in neurodegenerative models.
Table 1: ATPase Activity Deficits in Alzheimer's Disease Models
| Model System | ATPase Component Analyzed | Quantitative Change vs. Control | Associated Pathological Readout | Citation (Year) |
|---|---|---|---|---|
| Tg2576 Mouse Brain | Hsp70 ATPase Activity | ↓ 40-50% | Increased Aβ oligomers, cognitive deficit | (Miyata et al., 2013) |
| SHSY-5Y cells + Aβ42 oligomers | Hsc70 ATP Hydrolysis Rate | ↓ 35% | Increased insoluble Tau, cell death | (Freilich et al., 2018) |
| APP/PS1 Mouse Neurons | Mitochondrial ATP Synthase (Complex V) Activity | ↓ 30% | Synaptic loss, memory impairment | (Beck et al., 2016) |
Table 2: ATPase Dysfunction in Parkinson's Disease Models
| Model System | ATPase Component Analyzed | Quantitative Change vs. Control | Associated Pathological Readout | Citation (Year) |
|---|---|---|---|---|
| A53T α-synuclein Transgenic Mice | Neuronal Hsp70 ATP Turnover | ↓ ~45% | Higher α-synuclein aggregation, motor decline | (Klucken et al., 2004) |
| LRKK2 G2019S Dopaminergic Neurons | Lysosomal vATPase Activity | ↓ ~30% | Impaired autophagic clearance of p62 | (Wallings et al., 2015) |
| Rotenone-treated SH-SY5Y cells | 26S Proteasome ATPase (Rpt) Activity | ↓ 60% | Accumulation of ubiquitinated proteins | (Um et al., 2010) |
Detailed Experimental Protocols
Protocol 1: Measuring Hsp70 ATPase Activity in Brain Tissue Homogenates
- Objective: Quantify the rate of ATP hydrolysis by Hsp70 from cortical tissue of AD model mice.
- Reagents: Homogenization buffer (20 mM HEPES-KOH pH 7.4, 50 mM KCl, 5 mM MgCl2, 1 mM DTT), ATP regeneration system (pyruvate kinase, phosphoenolpyruvate), malate dehydrogenase, NADH, ATP, Hsp40 (J-domain protein).
- Procedure:
- Homogenize cortical tissue in ice-cold buffer, centrifuge at 20,000g for 30 min at 4°C.
- Desalt supernatant using a spin column to remove endogenous nucleotides.
- In a 96-well plate, mix 10 µL sample with 80 µL assay buffer (homogenization buffer + 2 mM ATP, 2 mM PEP, 20 U/mL PK, 0.2 mM NADH, 1 U/mL MDH, 1 µM Hsp40).
- Initiate reaction by adding ATP. Monitor NADH oxidation at 340 nm for 30 min at 30°C.
- Calculate ATPase activity (nmol ATP/min/mg protein) from the linear rate, using an NADH extinction coefficient of 6220 M⁻¹cm⁻¹.
Protocol 2: Assessing Proteasomal ATPase Activity in Cell Lysates
- Objective: Determine 26S proteasome function via its ATP-dependent activity in PD cell models.
- Reagents: Lysis buffer (50 mM Tris-HCl pH 7.5, 5 mM MgCl2, 1 mM DTT, 2 mM ATP, 10% glycerol), Proteasome activity assay buffer (50 mM Tris-HCl pH 7.5, 40 mM KCl, 5 mM MgCl2, 1 mM DTT, 1 mM ATP), fluorogenic substrate (Suc-LLVY-AMC for chymotrypsin-like activity).
- Procedure:
- Lyse cells in ATP-containing lysis buffer, clarify by centrifugation at 16,000g for 15 min.
- Determine protein concentration.
- In a black 96-well plate, combine 10 µg lysate, assay buffer, and 100 µM Suc-LLVY-AMC substrate in a final volume of 100 µL.
- Incubate at 37°C, measuring fluorescence (Ex/Em: 380/460 nm) kinetically for 60 minutes.
- For ATP-dependency, run parallel reactions replacing ATP with an ATP-depletion system (apyrase) or non-hydrolyzable ATPγS.
Pathway and Workflow Visualizations
Experimental Workflow for Validating ATPase Function
The Scientist's Toolkit: Research Reagent Solutions
| Reagent/Material | Function/Utility | Example Product/Cat. # |
|---|---|---|
| Recombinant Human Hsp70 (HSPA1A) | Purified ATPase for in vitro activity assays and co-crystallization with inhibitors/activators. | Enzo Life Sciences, ADI-NSP-555 |
| PANTHER Hsp70/Hsc70 ATPase Assay Kit | Homogeneous, luminescence-based kit for rapid quantification of Hsp70 ATPase activity in lysates. | Thermo Fisher Scientific, A35134 |
| 20S Proteasome Activity Assay Kit (Fluorogenic) | Measures chymotrypsin-, trypsin-, and caspase-like activities; used to infer 26S ATPase function. | MilliporeSigma, APT280 |
| ATP Depletion System (Apyrase) | Critical control to confirm ATP-dependence of observed chaperone or proteasome activity. | New England Biolabs, M0398S |
| Bafilomycin A1 | Specific inhibitor of the lysosomal Vacuolar-type H+-ATPase (vATPase). Used to model dysfunction. | Cayman Chemical, 11038 |
| Fluorescent ATP Analog (TNP-ATP) | Binds ATPase sites; fluorescence quenching/change used to measure binding affinity and kinetics. | Jena Bioscience, NU-901 |
| Hsp40 (DNAJB1) Co-chaperone | Essential for stimulating Hsp70 ATP hydrolysis; required for physiologically relevant assays. | Proteintech, AG11778 |
| α-Synuclein Pre-formed Fibrils (PFFs) | Pathological seeds to induce aggregation in cellular models, challenging the ATPase systems. | StressMarq, SPR-322 |
This technical guide, framed within the thesis of understanding ATP hydrolysis mechanisms in chaperone disaggregation, provides a comparative analysis of AAA+ ATPase structural and functional paradigms. By contrasting the disaggregation machinery (e.g., Hsp104/ClpB) with the 26S proteasome and protein translocation machines (e.g., SecA, FtsH, p97/VCP), we elucidate conserved principles and specialized adaptations in ATP-driven protein remodeling. The insights are critical for researchers targeting AAA+ systems in protein aggregation diseases and drug development.
AAA+ ATPases (ATPases Associated with diverse cellular Activities) form a large superfamily of molecular machines that utilize ATP hydrolysis to perform mechanical work on substrate proteins. Within the thesis on chaperone disaggregation, understanding the core ATPase cycle is paramount. This guide compares the disaggregation-specific AAA+ systems with two other well-characterized classes: the proteasomal regulatory particle (19S RP) responsible for substrate unfolding and translocation into the proteolytic core, and protein translocation ATPases like SecA (secretion) and FtsH (membrane-integrated degradation). Each system adapts the conserved AAA+ module—comprising a nucleotide-binding domain (NBD) with Walker A/B motifs and a second region of homology (SRH)—for distinct biological outcomes: disaggregation, degradation, or membrane transport.
Structural and Mechanistic Core: A Comparative Framework
Conserved Architectural Themes
All AAA+ ATPases operate as ring-shaped hexamers. The ATPase active sites are formed at the interface between subunits, enabling coordinated hydrolysis and communication. A central pore lined with conserved, often pore-loop residues engages the substrate polypeptide, applying a mechanical force upon conformational changes induced by ATP binding/hydrolysis.
Specialized Adaptations
- Disaggregases (Hsp104/ClpB): Feature two distinct AAA+ nucleotide-binding domains (NBD1 and NBD2) per monomer, often with a regulatory coiled-coil M-domain essential for coupling to Hsp70. They operate as a "power-stroke" machine to extract polypeptides from aggregates.
- Proteasomal AAA+ (Rpt1-6 of 19S RP): Six distinct but homologous subunits (Rpt1-Rpt6) form a heterohexameric ring. They specialize in processive unfolding and translocation of tagged (ubiquitinated) substrates into the 20S core peptidase.
- Translocation ATPases (SecA, FtsH, p97): Often feature additional domains for substrate recruitment or localization (e.g., SecA's polypeptide-crosslinking domain, p97's N-domain for cofactor binding). FtsH combines AAA+ and protease domains. They typically translocate polypeptides across or into membranes.
Table 1: Core Comparative Features of AAA+ Systems
| Feature | Disaggregase (Hsp104/ClpB) | Proteasomal ATPase (19S RP) | Translocation ATPase (SecA / p97) |
|---|---|---|---|
| Primary Function | Extract/remodel aggregated proteins | Unfold & translocate for degradation | Thread/unfold for secretion or ER-associated degradation |
| Ring Composition | Homohexamer (two rings of 6 NBDs each) | Heterohexamer (Rpt1-6) | Homohexamer (p97); Monomer/Dimer that forms transient rings (SecA) |
| Key Substrate | Amyloid/cross-beta aggregates | Ubiquitin-tagged native/misfolded proteins | Signal peptide-containing (SecA) / Polyubiquitinated (p97) |
| ATP Hydrolysis Rate | ~50-100 min⁻¹ per hexamer (model) | ~300-500 min⁻¹ per hexamer | Variable; SecA: ~100 min⁻¹; p97: ~50-100 min⁻¹ |
| Direction of Pull | Pulls substrate through central pore from aggregate | Pulls into 20S core chamber (cis to trans) | Pushes (SecA) or pulls (p97) across membrane/into complex |
| Essential Co-factors | Hsp70 system (DnaK/J in bacteria) | Ubiquitin receptors, deubiquitinases | SecYEG channel (SecA); Ufd1-Npl4 complex (p97) |
| Regulatory Element | M-domain (coiled-coil) | N-terminal domains, CP interactions | N-terminal domains, lipid binding (SecA) |
Table 2: Quantitative Parameters from Key Studies (Representative Values)
| Parameter | Hsp104 (Yeast) | ClpB (E. coli) | 26S Proteasome | p97/VCP |
|---|---|---|---|---|
| Hexamer MW (kDa) | ~1020 | ~960 | ~2000 (RP only ~900) | ~540 |
| Reported kcat (ATP/min) | ~60-80 | ~40-60 | ~300-500 (total) | ~50-80 |
| Step Size (residues/ATP) | 2-8 (estimated) | 2-8 (estimated) | ~5-10 | ~4-6 |
| Unfolding Force (pN) | ~20-50 (model) | ~20-50 (model) | ~20-40 (single molecule) | Data limited |
| Critical [ATP] (mM) | 1-3 (half-max) | 1-3 (half-max) | 0.05-0.2 (high affinity) | 0.1-0.5 |
Experimental Protocols for Comparative Analysis
Protocol: Single-Molecule FRET to Monitor Conformational Cycling
Objective: Measure real-time conformational changes in AAA+ rings during ATPase cycle.
- Labeling: Introduce cysteines at strategic positions in pore loops or inter-subunit interfaces via site-directed mutagenesis. Label with maleimide-conjugated donor (Cy3) and acceptor (Cy5) fluorophores.
- Reconstitution: Purify and hexamerize the labeled AAA+ protein in the presence of ATPγS (non-hydrolyzable analog) or ADP.
- Imaging: Immobilize hexamers on a PEG-passivated quartz slide via a His-tag. Image using a total internal reflection fluorescence (TIRF) microscope in the presence of an oxygen-scavenging and blinking-suppression imaging buffer (e.g., with PCA/PCD, Trolox).
- Kinetic Measurement: Initiate reaction by flowing in ATP-containing buffer. Record donor and acceptor emission intensities over time. Calculate FRET efficiency (E = IA/(ID + I_A)) to report on intra- or inter-subunit distances.
- Analysis: Use hidden Markov modeling to identify discrete FRET states and derive transition rates, correlating with hydrolysis steps.
Protocol: Cryo-EM Analysis of Substrate-Engaged States
Objective: Obtain high-resolution structures of AAA+ complexes with model substrates.
- Complex Formation: Incubate the AAA+ hexamer (e.g., p97, proteasome RP) with a non-hydrolyzable ATP analog (AMP-PNP, ATPγS) and a designed substrate (e.g., a ubiquitinated or ssrA-tagged protein, or a poly-peptide).
- Vitrification: Apply 3-4 µL of sample at ~1-2 mg/mL to a freshly glow-discharged cryo-EM grid (e.g., Quantifoil R1.2/1.3). Blot for 2-4 seconds at 100% humidity and plunge-freeze in liquid ethane using a Vitrobot.
- Data Collection: Acquire movie stacks on a 300 keV cryo-TEM (e.g., Titan Krios) with a GIF quantum energy filter and a direct electron detector (e.g., Gatan K3) at a nominal magnification of 105,000x (~0.83 Å/pixel). Use a defocus range of -0.8 to -2.5 µm.
- Processing: Motion-correct and dose-weight movies. Perform iterative 2D and 3D classification in RELION or cryoSPARC to isolate homogeneous, substrate-engaged populations. Refine a high-resolution map and build/refit atomic models using Coot and Phenix.
Protocol: Coupled ATPase Activity Assay with Substrate Stimulation
Objective: Quantify the stimulation of ATP hydrolysis by different protein substrates.
- Reaction Setup: In a 96-well plate, mix 0.1-0.5 µM AAA+ hexamer with varying concentrations (0-20 µM) of substrate (e.g., casein, aggregated luciferase, ubiquitinated protein) in reaction buffer (25 mM HEPES-KOH pH 7.5, 150 mM KCl, 10 mM MgCl₂).
- ATP Regeneration System: Include 2 mM ATP, 2 mM phosphoenolpyruvate (PEP), 20 U/mL pyruvate kinase, and 0.2 mM NADH.
- Monitoring: Initiate reaction by adding ATP. Monitor the oxidation of NADH (absorbance at 340 nm) continuously for 30-60 minutes at 30°C using a plate reader. The rate of absorbance decrease is proportional to ATP hydrolysis rate (linked via lactate dehydrogenase reaction).
- Analysis: Calculate rates (µM ATP/min/µM enzyme) from the linear slope. Plot rate vs. [substrate] and fit to the Michaelis-Menten equation to determine kcat and Km for substrate stimulation.
Visualization of Key Concepts
Title: Conserved AAA+ ATPase Mechanical Cycle
Title: Functional Diversification of AAA+ Core Architecture
The Scientist's Toolkit: Research Reagent Solutions
Table 3: Essential Reagents for AAA+ ATPase Research
| Reagent / Material | Function in Research | Example / Specification |
|---|---|---|
| Non-hydrolyzable ATP Analogs (AMP-PNP, ATPγS, ADP-BeFx) | Trap specific conformational states (ATP-bound, ADP+Pi) for structural and binding studies. | Sigma-Aldrich A2647 (AMP-PNP), Roche 10253287001 (ATPγS) |
| Fluorescent ATP Analog (Mant-ATP, TNP-ATP) | Monitor nucleotide binding and release kinetics via fluorescence polarization or FRET. | Jena Bioscience NU-901 (Mant-ATP) |
| Site-Directed Mutagenesis Kit | Introduce point mutations in Walker A/B, pore loops, or sensor motifs for functional dissection. | NEB Q5 Site-Directed Mutagenesis Kit (E0554S) |
| Cysteine-Reactive Fluorophores (Maleimide-Cy3/Cy5, Alexa Fluor dyes) | Site-specific labeling for single-molecule FRET or fluorescence anisotropy assays. | Cytiva Cy3/Cy5 maleimide, Thermo Fisher A10254 (Alexa Fluor 488 C5 maleimide) |
| Tag-Specific Affinity Resins | High-purity purification of recombinant AAA+ proteins. | Ni-NTA Superflow (Qiagen) for His-tags, Strep-Tactin XT (IBA) for Strep-tags. |
| Reconstituted Substrates | Defined substrates for activity assays. | Ubiquitinated proteins (Boston Biochem), Aggregated Luciferase (self-prepared via heat shock), ssrA-tagged GFP (purified). |
| ATPase Activity Assay Kits | Coupled enzymatic or colorimetric measurement of hydrolysis rates. | EnzChek Phosphate Assay Kit (Thermo Fisher E6646), NADH-coupled assay (homebrew). |
| Cryo-EM Grids | Support for vitrified sample preparation. | Quantifoil R1.2/1.3 300 mesh Au grids. |
| Negative Stain Reagents | Rapid sample screening for homogeneity and complex formation. | Uranyl acetate (2%) or Phosphotungstic acid. |
| Proteasome/P97 Inhibitors | Tool compounds for functional validation. | MG132 (proteasome), NMS-873 (p97), DBeQ (p97). |
The comparative analysis underscores that while the fundamental AAA+ engine is conserved, subtle differences in nucleotide coordination, pore-loop dynamics, and regulatory interfaces define functional specificity. For drug development targeting AAA+ systems in aggregation diseases (e.g., targeting p97 in cancer or modulating Hsp104 in neurodegeneration), lessons from proteasomal inhibitors (like bortezomib) highlight the potential of targeting allosteric sites or cooperative subunit interfaces rather than the active ATPase site directly. Future research must integrate high-resolution structural data from all three classes with single-molecule kinetics to fully decode the mechanochemical coupling rules, enabling rational design of next-generation modulators.
This whitepaper details the methodology for a critical biophysical validation within a broader thesis investigating ATP-driven chaperone disaggregation systems (e.g., Hsp104, ClpB, Hsp70-DnaJ-NEF systems). The central hypothesis posits that the mechanical unfolding force generated by these hexameric or oligomeric chaperone machines is directly coupled to and powered by the chemical energy released from ATP hydrolysis. A direct, quantitative correlation between site-specific ATP hydrolysis rates and the resultant, single-molecule mechanical forces provides the most stringent test of this mechanochemical coupling, moving beyond correlative bulk assays to causative, real-time validation.
Table 1: Key Parameters for Biophysical Correlation
| Parameter | Typical Measurement Method | Representative Value(s) (from Literature) | Relevance to Correlation |
|---|---|---|---|
| Single ATP Hydrolysis Rate (k_cat) | Coupled enzyme assay (bulk); Fluorescent ATP analogues (single-molecule) | 10 - 100 s⁻¹ per subunit | Sets the temporal scale for force generation cycles. |
| Mechanical Unfolding Force (F_unfold) | Optical Tweezers (OT), Atomic Force Microscopy (AFM) | 10 - 50 pN | Direct readout of mechanical output. |
| Step Size (Δx) | OT/AFM, Hidden Markov modeling of stepping data | 1 - 10 nm per mechanical step | Relates chemical cycles to physical displacement. |
| Work Output (W = F * Δx) | Calculated from F_unfold and Δx | ~50 - 500 pN·nm (≈ 12 - 120 kBT) | Energy per mechanical cycle, comparable to ~γ-phosphate hydrolysis energy (~80-100 pN·nm). |
| Hydrolysis Coupling Efficiency (η) | W / (Energy from ATP Hydrolyzed) | 30% - 70% | Ultimate metric of mechanochemical coupling efficiency. |
Table 2: Comparison of Force Spectroscopy Techniques
| Technique | Force Range | Spatial Resolution | Temporal Resolution | Suitability for Hydrolysis Correlation |
|---|---|---|---|---|
| High-Resolution Optical Tweezers | 0.1 - 100 pN | Sub-nm | ~1 ms | Excellent. Allows simultaneous fluorescence co-localization. |
| Atomic Force Microscopy (AFM) | 10 pN - 10 nN | ~0.5 nm | ~1-100 ms | Good for high-force unfolding, less ideal for fast dynamics. |
| Magnetic Tweezers | 0.01 - 100 pN | ~1-10 nm | ~1-10 ms | Excellent for long-term stability and torque application. |
Detailed Experimental Protocols
Protocol: Single-Molecule ATP Hydrolysis Kinetics via Fluorescence
- Objective: Measure real-time ATP turnover at individual chaperone complexes.
- Materials: Cy3-ATPγS or Mant-ATP (donor/quencher pair); Zero-mode waveguide (ZMW) chips or TIRF microscope; Purified chaperone complex immobilized on passivated surface.
- Procedure:
- Immobilize chaperone hexamers on a PEG-passivated quartz slide or in ZMW wells.
- Perfuse reaction buffer containing fluorescent ATP analogue.
- Using TIRF or ZMW-based imaging, record fluorescence time traces at each immobilized complex.
- Single hydrolysis/binding events cause transient fluorescence intensity changes (e.g., quenching on binding, release on hydrolysis).
- Analyze traces using change-point detection algorithms (e.g., vbFRET, HaMMy) to extract dwell times and calculate per-complex hydrolysis rates.
Protocol: Concurrent Force and Hydrolysis Measurement (Optical Trapping)
- Objective: Directly correlate a mechanical unfolding event with the consumption of ATP molecules.
- Materials: Dual-trap high-resolution optical tweezers; Polystyrene or silica beads; DNA handle-tethered substrate protein (e.g., aggregated α-synuclein, misfolded GFP); Fluorescent non-hydrolyzable ATP analogue (Cy5-ATPγS) for competition.
- Procedure:
- Engineer a polyprotein or aggregated substrate flanked by DNA hybridization handles.
- Tether one end to a bead held in a fixed optical trap, the other to a bead on a movable piezo stage.
- Introduce chaperone complex and ATP into the flow chamber.
- Force Measurement: Record bead displacement with nm precision, converting to force via trap stiffness. Record force-extension curves during chaperone activity.
- Correlative Kinetics: In parallel experiments, use fluorescent ATP (or competitive inhibitors) in a confocal volume aligned with the trap. Monitor fluorescence fluctuation coincident with mechanical stepping/unfolding.
- Data Correlation: Align the temporal traces of force/extension changes with fluorescence event timestamps. Calculate the number of hydrolysis events per pN of force generated or per nm of substrate translocated.
Visualizations and Workflows
Title: Workflow for Correlative Biophysical Validation
Title: Concurrent Force & ATPase Measurement Setup
The Scientist's Toolkit: Research Reagent Solutions
Table 3: Essential Reagents and Materials for Correlative Experiments
| Item | Function/Description | Key Supplier Examples (Illustrative) |
|---|---|---|
| Fluorescent ATP Analogues (Mant-ATP, Cy3-ATPγS, ATTO647N-ATP) | Report binding/hydrolysis events in single-molecule fluorescence assays. | Jena Bioscience, Thermo Fisher, Sigma-Aldrich |
| PEG-Based Passivation Reagents (mPEG-SVA, biotin-PEG-SVA) | Create inert, non-sticky surfaces for immobilization, preventing non-specific protein adsorption. | Laysan Bio, Creative PEGWorks |
| Streptavidin-Coated Beads/Supports (Polystyrene, Silica) | Provide high-affinity binding for biotinylated DNA handles or proteins in tethering. | Spherotech, Bangs Laboratories, Micromod |
| Biotinylated DNA Handles (e.g., ~500-1000 bp dsDNA) | Tether substrate proteins to beads for force spectroscopy; act as flexible, calibrated spacers. | IDT, Genscript (custom synthesis) |
| Engineined Substrate Proteins (Tandem-repeat proteins, misfolded GFP variants) | Provide well-defined, mechanically stable modules for unambiguous unfolding detection. | Custom cloning & purification. |
| Zero-Mode Waveguide (ZMW) Chips | Confine observation volume to zeptoliters, enabling single-molecule fluorescence at physiological ATP concentrations. | Pacific Biosciences |
| High-Purity ATP Regeneration Systems (PK/LD, CP/CK) | Maintain constant [ATP] during long experiments, crucial for kinetic measurements. | Sigma-Aldrich, Cytiva |
Conclusion
The disaggregation of toxic protein aggregates is fundamentally an energy-dependent process, with ATP hydrolysis serving as the indispensable engine. From foundational principles revealing the intricate coupling of ATPase cycles to collaborative mechanical work, to methodological advances enabling precise measurement and perturbation, our understanding has matured significantly. Navigating experimental challenges and rigorously validating findings across systems have solidified the central role of chaperone ATPases. For biomedical research, this knowledge opens direct paths for therapeutic intervention: modulating specific steps in the ATP hydrolysis cycle of disaggregases represents a promising strategy to boost cellular clearance of aggregates in neurodegenerative diseases, or conversely, to disrupt pathogen resilience. Future directions will involve developing more precise, allosteric modulators of these ATPase machines, translating single-molecule mechanics into predictive cellular and clinical outcomes, and exploring the therapeutic window for enhancing disaggregation capacity in aging and disease.